#data-science-and-ml
1 messages · Page 218 of 1
 earnest prawn
So you read the pixel, reformat it into a 2d tensor according to the format info and then feed it into your CNN?
 lapis sequoia
Can someone plz help me get internship for data science
 coral yoke
no?
 coral otter
hi all, i want to make a function to add a suffix to a dataframe name like
add the suffix _4 to the dataframe name............function(toto) = toto_4
i m a begginer
 late jackal
Could anyone nudge me in the right direction for starting this problem
 velvet thorn
do you know how weights and biases work @late jackal
late jackal
I know it's like x1w1+....xiwi+b
Like a weighted avg plus the constant
I'm not sure if they just want us to write out the simple function. Or if they would like us to make some sort of training data
velvet thorn
why do you think so?
like for a) they just want oyou to calculate the output i.e. through algebraic substitution
the others are logic questions
 hybrid scroll
Hello guys, I did AutoML using h2o and the result look like this
how to save the model for DRF_1 ?
so I can share or recall that model without retrain the data
 dire stirrup
pick;e?
 somber hamlet
hello, how can I draw a pyplot graph from a dict? {x:y}
Seems like I've to separate them in two list, but I don't find the answer elegant
velvet thorn
*zip(d.items())?
 mild sierra
anyone here use luigi
lapis sequoia
anyone know what do do in feature engineering to beat svm ?
lapis sequoia
new columns
coral yoke
you said beat the SVM as in using another model. what are you trying to say i must be misunderstanding, sorry
 deep spire
So I've been trying to get more organized with my project management (been having some issues with communication/tasks at work). Do any of you guys have any suggestions for tools or methodologies for managing data analytics/data science projects?
lapis sequoia
I am trying to get a better score
but I don't know how
this is the data set https://www.kaggle.com/becksddf/churn-in-telecoms-dataset
 coral yoke
i can't spend my time performing EDA for you man i'm sorry
it's up to you to understand your dataset and know how to handle it
others may have that time but unfortunately i do not
lapis sequoia
Model LogisticRegression
    CV scores [0.12244898 0.27083333 0.29166667 0.10416667 0.22916667]
    mean=0.204 std=0.077

Model SVC
    CV scores [0.53061224 0.5625     0.5625     0.39583333 0.625     ]
    mean=0.535 std=0.076

Model DT (prunned=4)
    CV scores [0.42857143 0.52083333 0.52083333 0.4375     0.64583333]
    mean=0.511 std=0.078
are these bad numbers?
¯_(ツ)_/¯
I don't like the data we were given
I don't get how I am supposed to build a feature for a categorical data
 alpine tiger
Hey, guys! I'm writing a school paper on a ML project, and I'm a bit confused about the terminology of Hypothesis, Hypothesis Class and Representation.
I have a dataset, with alot of features - though I in practice only use 32-40 variables.
The target value is either a signal (True/1.0) or a background (False/0.0)
I'm using a neural network, with undetermined architecture (Not yet performed Model Selection), though a sigmoid activation in the output node.
With LaTeX notation :
Is it correct to say that my representation is (X^d_i, y_i),
where X is a "n x d"-matrix, y a n-vector, d is an integer in the intervall = [32,40], y_i = {0.0 , 1.0} and i ranges from [0, n] where n is number of samples?
Is my hypothesis class every function : R^d -> [0.0, 1.0]
An instance of (preferably trained) network would be a hypothesis?
 uncut shadow
Hey. I was trying to make my own neural network from scratch, but I have got stuck on a problem which I cannot solve (I was trying for few days, but it still doesn't know).
I have a code for a backpropagation:
a1 = np.dot(X, weights1) + b1
hidden = sigmoid(a1)
a2 = np.dot(hidden, weights2.T) + b2
output = sigmoid(a2)
outputs.append(output)

# backpropagtion
dloss_yh = - (np.divide(y, output) - np.divide(1 - y, 1 - output))
dloss_y = np.dot(np.divide(1, X.shape[1]), 2*(output - y))
dloss_z2 = dloss_yh * np.dot(output, 1 - output)
dloss_a1 = np.dot(weights2, dloss_z2)
dloss_z1 = np.dot(dloss_a1, np.dot(hidden, 1 - hidden))
dloss_w1 = np.dot(np.divide(1., X.shape[1]), np.dot(dloss_z1, X.T))
dloss_w2 = np.dot(dloss_z2, a1.T)
dloss_b1 = np.dot(dloss_z1, np.ones((dloss_z1.shape[1], 1)))
dloss_b2 = np.dot(dloss_z2, np.ones((dloss_z2.shape[1], 1)))

weights1 -= dloss_w1 * learning_rate
weights2 -= dloss_w2 * learning_rate
b1 -= dloss_b1 * learning_rate
b2 -= dloss_b2 * learning_rate
I have made it to adjust my weights properly to find the smallest loss. The problem is with numpy and matrices. I get error when I try to update weights2:
Traceback (most recent call last):
  File "C:\Program Files\JetBrains\PyCharm Community Edition 2019.1.3\plugins\python-ce\helpers\pydev\pydevd.py", line 1434, in _exec
    pydev_imports.execfile(file, globals, locals)  # execute the script
  File "C:\Program Files\JetBrains\PyCharm Community Edition 2019.1.3\plugins\python-ce\helpers\pydev\_pydev_imps\_pydev_execfile.py", line 18, in execfile
    exec(compile(contents+"\n", file, 'exec'), glob, loc)
  File "C:/Users/PC/PycharmProjects/Machine Learning/basic_neural_net.py", line 75, in <module>
    result = fit(X, y, n_epochs=1000)
  File "C:/Users/PC/PycharmProjects/Machine Learning/basic_neural_net.py", line 65, in fit
    weights2 -= dloss_w2 * learning_rate
ValueError: non-broadcastable output operand with shape (1,2) doesn't match the broadcast shape (2,2)
How can I change the shape of these losses to make it work?
That's how they look like.
also X is just a
X = [[1 0]
     [0 0]]
and y is just a
y = [[1]
     [0]]
Also when should I use ndarray.T? I mean, is there any specific way to use it to make it work or I have to just transpose matrices randomly?
lapis sequoia
Medium
Thinking of data science as merely a technical profession, like programming, may take you away from your goals.
Did some mistakes while starting out in Data Science. Don't want other beginners to do same
 tawdry rose
did you use datacamp ? is it good
lapis sequoia
@tawdry rose if that question was for me then answer is "no, I haven't use datacamp"
 granite sierra
tbh, I've used it a tiny bit, it seems great for learning, but I'm not paying 300$ a year for subscription, if it was paid for, I'd definitely use it
tawdry rose
courses not very awesome but i liked their project based learning
but idunno if its worth it
lapis sequoia
Fro my understanding, free stuff is as useful as a course
Kaggle Courses and free courses on edX, udacity and coursera
from the point of view of my work expereince
granite sierra
Yea that's true, datacamp does ahve this "skills based learning", where it tests your skills and helps you strengthen your weaker skills, that's kinda useful. Obviously can be done with the free ones as well, but then you have to have a good enough understanding of what you think are your weaknesses and strengths
lapis sequoia
@granite sierra That's correct. I am aware of my weaknesses:
Python (general)
NumPy (design, data structures and operations/functions/methods)
Pandas (advanced data cleaning and preprocessing)
Statistics (both in general and in Python)
and those all are important things one needs to know for day to day work as data scientist/ML-engineer
I figured this while listening to "Seat next to You" (you know who is behind this song)
granite sierra
@uncut shadow what's that way to get it for free
uncut shadow
https://www.quora.com/How-do-I-access-DataCamp-courses-for-free
@granite sierra
granite sierra
Huh interesting
uncut shadow
yeah
there are also free udemy courses (not only the ones which are always for free). search for "udemy coupons" if you want
you might find some interesting ones
tawdry rose
what is yout suggestion about project based learning
like datacamp's projects
i actually like projects more than courses
lapis sequoia
Try Kaggle
tawdry rose
hmm you are so true.
what resources you are using
on datascience
actually im not datascientist im first grade cs student
lapis sequoia
Focus more on something called "Reproducible Data Science" (you need to know Git and GitHub/GitLab)
@tawdry rose, you want to be a data scientist?
why not Software Enginner or computer programmer
lapis sequoia
Because I wanted to change, most of the work in India is service based where you write 100 LoC in a year
I worked with a startup, a product based company, and I wrote 1000 LoC a day
and I am not an engg grad.
I became programmer because I liked Linux along with its all development tools
found programming there and started doing it and felt like doing it forever
Then I could not find much product based companies (no I was not a genius who got hired by M$/Google from my final year). If I am not writing much code, then why do such a job. Better find one where impact is higher, where I can use technology to solve problems more directly
that is where data science came in, I like AI more of course. But for now, I am sticking to data science. All AI of today is ML based and one must have good grounding in data science to make more sense of ML. That is what I believe
So yeah...
What about you, why you chose CS @tawdry rose
tawdry rose
because i wanted to be computer scientist and programmer
i could go to medicine
but i didn't want
lapis sequoia
may be then you should follow your heart
become programmer.
Python + Corman + SICP + Rust is a good combination, for you still got 4 years before you start looking for a job
tawdry rose
hmm what is corman
lapis sequoia

The MIT Press
The latest edition of the essential text and professional reference, with substantial new material on such topics as vEB trees, multithreaded algorithms, dynamic programming, and edge-based flow.
Some books on algorithms are rigorous but incomplete; others cove...

Structure and Interpretation of Computer Programs (SICP) is a computer science textbook by Massachusetts Institute of Technology (MIT) professors Harold Abelson and Gerald Jay Sussman with Julie Sussman. It is known as the Wizard Book in hacker culture. It teaches fundamental ...
dont look anywhere else other than following your heart. You got a long way to go
tawdry rose
ah i will read 'em thanks 😄
this AI looks interesting and cool
training machine
and artificial intelligence
 upbeat jetty
Ouch, that's pretty hardcore stuff 🙂
BTW, i think i saw somewhere on the net a SICP version which uses Python
lapis sequoia
yeah, there's one with Common Lisp too
tawdry rose
Structure and Interpretation of Computer Programs (a.k.a SICP, or “The Wizard Book”) is
considered one of the great computer science books. Some people claim it will
make you a better programmer. It was the entry-level computer science subject at MIT
and it’s still used in uni...
maybe this one
lapis sequoia
unfortunately, the only way to become a good programmer is to do this hard stuff. (sometimes people get lucky from college placements. Lucky in the sense, in college, algorithms are still fresh in your minds)
upbeat jetty
Probably. Didn't read through it, so take it with a grain of salt check reviews.
tawdry rose
actually learning cs in hard way can be little exhausting sometimes 😄
im first grade student but still we have 5 assignment(which 2 weeks deadline projects) and 6 quizzes(2 days deadline little programming tasks)
upbeat jetty
Well, while i'm not a programmer, i think if you want to to learn software engineering (compared, to CS), other books become "bibles"
Check that one
Balancing practical application and baseline knowledge is hard
Loved that book, but the examples are in Java, so some things may be a bit different compared to other languages.
upbeat jetty
Also, there's a so-called Gang of Four https://en.wikipedia.org/wiki/Design_Patterns
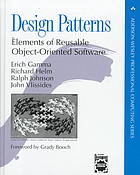
Design Patterns: Elements of Reusable Object-Oriented Software (1994) is a software engineering book describing software design patterns. The book was written by Erich Gamma, Richard Helm, Ralph Johnson, and John Vlissides, with a foreword by Grady Booch. The book is divided ...
While you probably shouldn't blindly implement everything you see in that book (and esp not in Python, which has its differences), knowing what people mean under certain names (say, singleton) would help understanding code of other people.
oops
lapis sequoia
GoF is high level book. You cant understand it unless you master OOA/M/D first
Those are the fundamentals
GoF is a fine-fine book, it is good of you to bring it up. Thing is, one first must learn to walk before he starts to run
This is a prerequisite for that
Even any basic OOA/M/D book by great authors like Uncle Bob, Rebecca Wirfs-Brock or James Rumbaugh will be fine
I have missed few authors, you can find them on comp.object
May be this discussion should be moved to #algos-and-data-structs
 terse crater
Hey, how do I grab data from video files? Any ideas?
It is gameplay footage
OCR / ML?
upbeat jetty
Is it possible to reverse-engineer replay files instead of raw video?
uncut shadow
Hey. If I have a 2 layer neural network [2, 2, 1] (number of neurons in each layer). What would be the shape of the matrix for biases for hidden layer? The input X has shape (7, 2).
 oblique belfry
Has anyone used MXNet? What are your thoughts? I am seeing a lot of interesting blog posts on the platform, but I am not seeing a lot of either research projects or production ready projects. This is a bit concerning.
 jolly briar
I have an SQL group by query that I want to reproduce in pandas - so in the SQL I can create multiple variables as part of the group by operation, but I'm not sure how to do this in pandas.
I'm currently planning to create an assignment for each variable in the SQL groupby, so that's around 10 instances along the lines of
x1 = df.groupby([...]).blah
x2 = df.groupby([...]).blah
...
x10 = df.groupby([...]).blah
whereas the SQL had something along the lines of
select
    count(*) as n_x,
    sum(x1) as sum_x1,
    sum(x2) as sum_x2,
    sum(x3) / count(*) as x3_dens,
    sum(x4) / count(*) as x4_dens,
    sum(x3) / sum(x4) as x3_x4,
    sum(x5) / sum(x6) as x5_x6,
from some.table
group by THING
is there a straightforward way to reproduce this in pandas?
jolly briar
i just created a separate function and applied it to each sub dataframe created by groupby().apply()
 worn minnow
is this a good channel for a bs4 question?
uncut shadow
Hey. Does anybody know any good tutorial about activation functions? I see that they might change loss a lot so I just want to know which ones to use for a particular problem
Also is there anything wrong with using 2 sigmoid functions in 2 layer nn?
uncut shadow
Because I don't think loss should look like this
jolly briar
when grouping the data is often reduced in size, I'm wondering if it's possible to group data and instead of reducing the size of it introduce duplicates
currently I'm merging back in to the original dataframe and introducing dups there anyway
 bitter skiff
Hi, somebody used StyleGAN2?
I try to generate a latent space representation out of an image with StyleGAN2.
I original thought that would be covered under "Projecting images to latent space" using "run_projector.py"
But this doesn't seem to generate latent space representations but a lot of png's.
Am I completely on the wrong track or does the projector function generate latent spaces?
 trail pagoda
Transformations and costly i/o operations are an inherent hyperparameter of a model im working on
as these transformed data sets are expensive what is the reccomended way to intelligently 'cache' the most used ones so that the model will save and load something it's been asked to do before without filling my hard drive with gigabytes of trash?
at the minute I have a folder in my project called 'pickle_jar' which is just a big folder full of serialized objects that can be called on later but it does it with literally everything and isn't sustainable.
oblique belfry
Can you be a little more specific?
trail pagoda
the raw data is a text file called a .cif that contains all the information about the crystal structure of some material
representing the crystal in an machine learnable way is an open question and I will be trying a lot of different representations with slight perturbations as my training data to see what works best for a given problem
these perturbnations are non trivial and essentialyl ahve to be constructed through some cpu intensive stuff and as such my model spends more time waiting for data to be prepared than it does training and gpu utilization is at about 15%
oblique belfry
@trail pagoda
Yeah...I understand being in that place. I was working on an action recognition project and we had many of the same issues. I think one can run a normal training with basic preprocessing. But if your model requires data from multiple sources and/or requires a LOT of different preprocessing steps, it might be better to do those ahead of time.
Before every train, we would create a "data cache" for the model to train on. This cache was the data already preprocessed in .hdf5 format. This allowed the model to just load the preprocessed data from the disk in an optimized way. I know creating a lot of these cache's can be annoying, but I'd personally rather pony up and get another SSD versus having epoch training times to be on the order of days instead of hours or minutes.
With preprocessing before training, this allowed us to utilize all 24 CPUs on our dev box. Running this script took 10 min instead of 3-4 hours.
So instead of taking days to get results, we spent 15 min prepping the data. Then the first epoch's results came back within 40 min.
We viewed that whole process as a sort of "compilation step" before training.
 hexed rampart
What exactly is a gate in an LSTM neural network. I could not find a clear answer for this online. From what I understood it is a feed forward neural network who's output is squished through a certain activation function? Thanks in advance.
velvet thorn
not...really?
each LSTM unit has a state, right
"gates" are basically rules that affect how that state changes when new data comes in.
lapis sequoia
anyone wanna team up for hash code
jolly briar
how to check the kernel that a notebook is using , i'm not sure whether it's using the right env and that's going to make it hard to share with others
 lament needle
any good sources to read transformer ?
 crystal sluice
hey guys, quick question
import pandas as pd

file = open('file1.xlsx', 'rb')

df = pd.read_excel(file)

df_media = df.mean()
df_count = df.count()

df_nomes = df['Nome']
df_nome_idade = df[['Nome','Idade']]


filtro = [df['Idade'] > 30]

print(filtro)
This is Showing the data like:
1 True
2 False
3 True
4 True
I want it to show the actual values contained in cells
any tips?
oblique belfry
Is there a notable difference using TF/Pytorch with nvidia-docker vs just running it normal? Is there a notable slowdown running models via containers?
 vivid cloak
does anyone know how to find things in a pandas dataframe?
like if I want to get the index of something in a column
I've looked through the docs section on indexing but didn't come across anything that helped
 drowsy grove
Has anyone used pd.read_sql_querywith if statements? I keep getting syntax error.
df2 works but can't get df3. Very confusing.
I know I can just read the whole table and then just select with pandas functions. But I just want to know what I'm doing wrong here.
The error message
drowsy grove
After getting the data, I need to, per instruction, "removing user PII, while still allowing the application to be hydrated
with data for development or testing."
I wonder what that means, does it just mean that I need to hash the name column?
Thanks.
 shell yarrow
I think if my very old and vague memories of SQL are correct that your if ought to be a WHERE
drowsy grove
Jesus. How did I miss that?
@shell yarrow I'm thoroughly ashamed.
Thank you so much. I will leave my images up there to serve as a reminder for me to be always humble.
shell yarrow
I've stopped counting my stupid mistakes after passing the 1000000th 🙂
lapis sequoia
print()
 thin terrace
How can I normalize the features of my dataset in the range of (-0.5, 0.5)? I can only find solutions for between -1 and 1 or 0 and 1.
 supple ferry
@thin terrace , there is an argument called feature_range in which you can use to give your range.
https://scikit-learn.org/stable/modules/generated/sklearn.preprocessing.MinMaxScaler.html
thin terrace
Thanks
 pine path
 wary apex
Hey guys, is sentdex a good playlist to go through ? Heard a lot about it
 plain turret
Give it a try to see if it's for you
wary apex
I see
plain turret
You only have a youtube video lenght of time to lose in case not :)
wary apex
Yeah I'm planning on getting the andrew coursera course as well
Got a lot of recommendations for it
plain turret
Yah
wary apex
Would I need to separately learn data science or does ML delve into it as well ?
 chilly shuttle
data science delves into ML, not so much other way around
5c comment from someone who hires, I see too many people who did some moocs on convnets but have almost 0 understanding of stats. Gotta get that foundation
drowsy grove
Has anyone dealt with anonymizing personal data or PII before? I'm supposed to remove user PII, while still allowing the application to be hydrated with data for development or testing.
Honestly I don't know what that means, but this is the closest I get.
The dataframe c below is my result
Would this work? I can then just drop the original name column.
chilly shuttle
it depends on what you need for your models and what requirements you need to meet
it's somewhere between difficult to impossible to truly anonymise data in a way that makes is still useful for ML models and there have recently been some surprising cases of reidentifying supposedly anonymous data
velvet thorn
good place to start would be deciding on an anonymity metric
thin terrace
Hi,
Looking for a way to reshape a B x W x H x 1 grayscale image (np.array) to a B x W x H x 3 RGB image.
I fail miserably in my attempts
chilly shuttle

Stack Overflow
I am a beginner with numpy, and I am trying to extract some data from a long numpy array. What I need to do is start from a defined position in my array, and then subsample every nth data point fro...
just select 0th 1st and 2nd elements
thin terrace
It's not that simple, the shape is (1, 28, 28, 1)
which means the last 1 which I need to extend to 3 elements is nested deep in 28x28 arrays
I guess I can do an ugly nested loop but surely there must be another way
chilly shuttle
yes...
take 3 slices with the method i linked
then concat them into 28x28x3
DM me your data i'll do it for fun
 vital cipher
hi guys just wanted to know is there any installation steps to download SAS enterprise miner on an ubuntu machine?
if so please guide
sas 9.4*
velvet thorn
for that kind of stuff, if I understand correctly, you want np.repeat(a, 3, axis=-1)
lapis sequoia
which is the best clustering algorithm when it comes to not knowing how many exact clusters or groups we need?
drowsy grove
@chilly shuttle Thanks
@velvet thorn Does anonymity metric mean how anonymous the data is?
chilly shuttle
yes but your organisation needs to explicitly define what that is
so that when inevitably the data gets leaked and reidentified, you're not on the hook
velvet thorn
if you don't know how many clusters there are...DBSCAN is nice to start with, I would say
can consider hierarchical clustering depending on your use case
yes, basically
"anonymity" is a nebulous concept - there are several different metrics that aim to objectively represent "how anonymous" some data is
 gaunt blade
I want to try to make crypto price predictor. Anyone has recommendations on what to watch/read/look for? I know how to get history market data and such I am wondering more on ML part, what model to use stuff like that. Preferrably something that'd be good introduction to learning ML etc
lapis sequoia
can i get some help with R? i need to make a graph based on my data, but i dont know how to do
i have state, city, fatalities, wounded, date as the columns
yes where fatalities most likely to occur
map of the area? what do you mean?
ohh
i am a newbie at this, so i would like to try where deaths are most likely to occur with a line graph
with states
does that make sense?
ohh
currently, my data is like this:
is there a way in R to total up the fatalities by state?
so i can make the x axis
thanks!
 vast temple
Hi guys, i have a problem. I have a authors dataset with ~270k names, and other 1k dataset with books and their descriptions. I need to create new dataframe with authors in books descriptions, and measure accuracy of that maching. How do i do that? I mean general direction, how to do that kinda stuff. Do i need to use fuzzywuzzy? Do i need to use loops to do that? Do i need to create very big 'dirty' df and for each author with 1k extra rows, and match within?
 rotund knot
Hi guys, I've got a df that has data stored from twitter scraping, sorted by word and frequency of word. I want to make a front end that will enable a user to search for a keyword, run a python script to append to a bar graph. Is Django my best way forward?
velvet thorn
@rotund knot it really depends.
the fact that you want to display a bar graph makes it a little twitchy
you could use Dash
which is built for this kind of thing
it is possible to use Django
or even Flask
but then you'd have to code more of the plotting logic yourself
so like either Dash alone or Django/Flask/something else with MPL
 granite steppe
hi im just trying to get into data visulization but i just dont know where to start... any suggestions?
shell yarrow
where do you start?
I mean - what's your current situation ? Are you in school or currently working ? Do you have a domain of expertise or trying to gauge possible careers for your higher education ?
granite steppe
left in 3rd year of uni
bscit
i dont have a single knowledge in data science @shell yarrow
shell yarrow
bsc it = bachelor in information tech ?
shell yarrow
I'm only gonna be able to give 'spare time / continuous education' kind of advice but...
shell yarrow
pick a subject matter that interests you and try to find interesting patterns about it
shell yarrow
I did a couple coursera courses - i'm not good but they were helpful laying out what the field looks like
shell yarrow
you can catch up on that (khan academy and many others)
shell yarrow
but if you need a formal education / validation, I'm not sure.
I don't think for Visualization specifically, maths are too hard (you're not ought to do hard stats)
granite steppe
ohhh
i c
i might as well start with coursea to start with then
thnx heaps bud @shell yarrow
shell yarrow
hey - also google around as much as you can (trying to avoid buzzfeed and other clickbaits...)
granite steppe
ye sure thnx for the tips 😄
coursea courses fro datavisulization are not free gonna look somewhere else haha
i feel cheap but it is what it is haha
shell yarrow
are you working?
as in the very judgemental question 'hey do you have a job' ?
anyway - youtube is same for free but you need to search for cotnent
 tired copper
corey schafer's got some good videos on data science
granite steppe
i have a job but not in IT atm haha and also i worked as a junior ui/ux designer during my uni time
does that answer ur question
sure will check his video out @tired copper thnx bud
granite steppe
hi i was wondering sud i be able to use pandas properly before i use mathplotlib
granite steppe
oh sweet thnx
rotund knot
@velvet thorn Thank you most kindly for your advice, I will start with Dash today.
 hollow shard
hello, I've been writing a CNN from scratch to train on the MNIST data, but its been producing strange results, for example the accuracy rising to 30% and then just falling back down to 10%, could anyone please look at my code and find out why this is, because I'm stumped
its very loosely based on this tutorial:
Medium
Convolutional neural networks are the workhorse behind a lot of the progress made in deep learning during the 2010s. These networks have…
 tiny flame
Hello guys
Has anyone tried to implement a machine learning algorithm in a language like Scratch
In Python it's pretty easy
velvet thorn
@hollow shard you should probably consider formatting your code better
so it's easier to find out what's wrong with it
you can check out PEP8
 eternal mantle
I have some a Pandas DataFrame with three simple columns, plus a separate index/id. One column is a timestamp/datetime object string output. I would like to be able to filter that data by date or time, separately. For example, filter for all rows that occur between this day and that day. Or filter for all rows that occur on any day, but in the morning.
What would be the best way to go about that, assuming very minor knowledge of Pandas? I was originally thinking to split the timestamp into a date, and time. Then make use of the strftime formatting to generate the right string output for writing to disk, and again for reading back into a datetime object when reconstructing the DataFrame
velvet thorn
I...don't really see what the first part of your question has to do with the second
for filtering: .dt accessor
for writing/reading, pandas should infer data type automatically, but if it doesn't, pd.to_datetime
eternal mantle
Hmm, might not have explained that the best. Pandas did not actually determine the datetime format automatically, so I am using pd.to_datetime to create that datetime object. The same in reverse when creating new rows.
I am more wondering if I want to filter the datetime by either the date only or the time only, would it be best to have those columns split or unified?
velvet thorn
unified.
because there is no date type or time type.
when loading from disk, did you tell pandas to parse dates?
check the documentation; it needs to be enabled
eternal mantle
So then with unified, I would essentially combine the command line arguments they they assemble the proper datetime objects to compare the data against. Im not sure that makes sense. But I think I understand the basics of how I would filter, just need to figure out how to translate that to code
And looking at the code, it looks like my only argument given to pandas regarding reading data is index_col=0. I could have sworn I used the option for parsing dates at some point. Maybe early on in development. But it doesn't look to be there now. I'll have to mess around with that too
Also worth mentioning, I use a slightly different time format but I think it would still be picked up by Pandas auto-detection. Though I understand it's best to explicitly tell Pandas the format so it doesn't waste time trying to guess.
%Y-%m-%d %H:%M:%S is the time format I use. Only real change from ISO is I don't include the timezone info in the middle
velvet thorn
depends on what your command line arguments look like.
eternal mantle
At the simplest, I want to be able to select by date. Time ranges haven't been fully decided on. Selection by date would look something like suppylement list --before 2020-02-01 --after 2020-01-14. Supporting a combination of the filters where you can use a combination of --before, --after or --on to select specific ranges.
Time filtering would be similar variations of those arguments. Need to decide if I am going to support the same set of arguments, or different arguments. It may be easiest to just accept a full datetime string and determine which pieces of the datetime it is applicable for. Though I have not had the best luck getting argparse to properly accept spaces in arguments so I may need to fix that, or change the time format in arguments slightly
velvet thorn
hm
okay, two things
- that kind of filtering is quite trivial, just need to be comfortable with
argparse
- rather than getting
argparseto accept spaces, escape the spaces in the arguments you pass to your script.
eternal mantle
Makes sense. Still figuring out argparse and getting the hang of the finer details. First project I'm trying to tackle on my own so a lot of figuring out and learning new things. I did try some various combinations of escape for arguments coming in from the command line without much luck. Might be worth taking another shot at it as having spaces properly in some args would be very helpful
Thanks for all the tips though, def appreciate it.
velvet thorn
no...
what I mean is, for example
python script.py —arg a\ b\ c
that’s one argument that will be parsed as 'a b c'
eternal mantle
I just tried like that, and I get an 'unrecognized argument' error. I believe the issue may stem from the way I set up argparse to handle the modes. It can definitely be done, I did it in the past. Just may need some adjustment to the arg setup for spaces to work. Right now, I cannot enter spaces in arguments -- probably because I am using positional args instead of named args
 pulsar stag
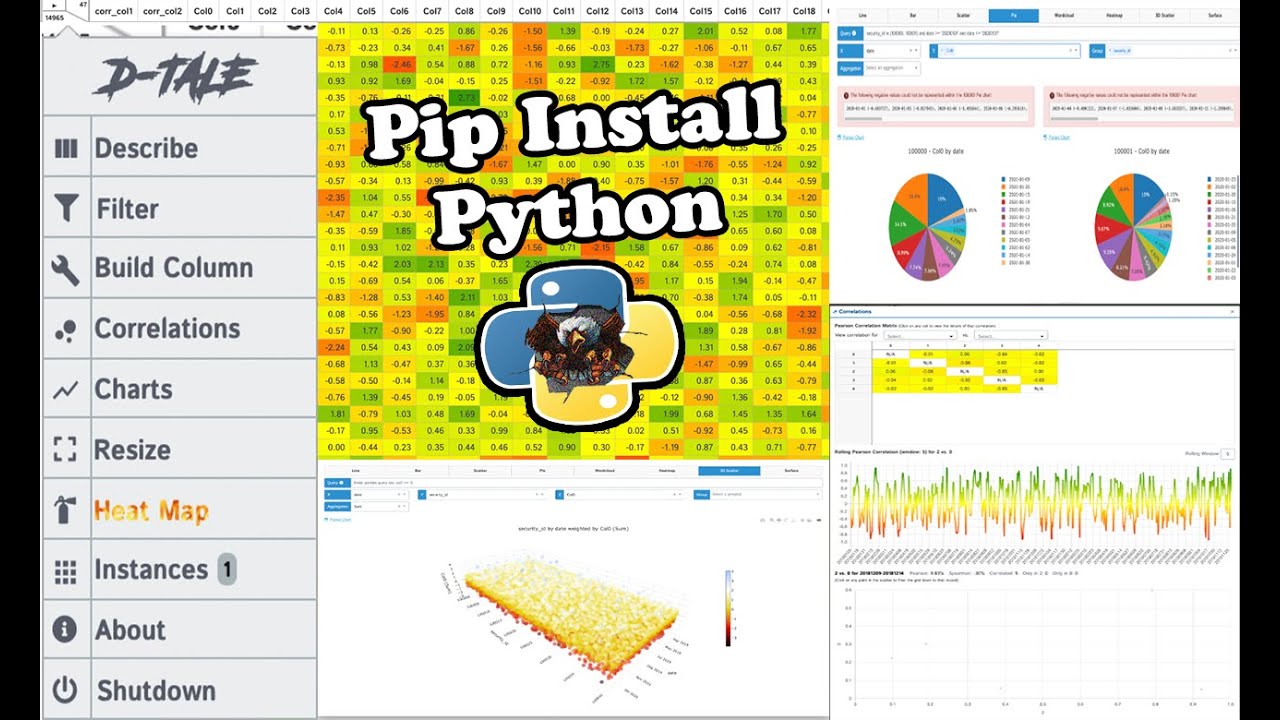
As a programmer/algorithmic trader the majority of my time at work is spent breaking down big data and trying to figure out ways of creating dashboards around this information. With this being said, I've found a tool that I started using before my dashboard creation process to highlight relationships between my data for further investigation. This tool is D-Tale a python, react, flask library that's built off Plotly & Dash to allows easy data analysis and integrates easily into Jupiter notebook.
As a fan, I wanted to put together a practice & tutorial on how to use this powerful tool in a comprehensive way so I made this video where I take the Coingecko API to pull all cryptocurrency financial data by date & break it down into price, volume & market cap. Easily adaptable to an endless amount of cryptocurrencies to compare with each other on this tool.
You can find the full tutorial on this subject here:
https://www.youtube.com/watch?v=0RihZNdQc7k&feature=youtu.be
Python Dash Plotly Udemy Course: https://www.youtube.com/redirect?v=psvU4zwO3Ao&event=video_description&redir_token=ie8R3amPq4Qn8G8CvRoYjWuW2L18MTU4MjQ2NTM0OEAxNTgyMzc4OTQ4&q=https%3A%2F%2Fwww.udemy.com%2Fcourse%2Fplotly-dash%2F%3FcouponCode%3DPOTLUCK
---------Useful Links---...
 chilly glen
I have one dumb question not sure if this is the right channel. Why is it important to learn ML from scratch, fundamentals etc since we already have bunch of libraries which are so much helpful that we pretty much don't have to build our own ML algorithm from scratch
PS I'm new to python/ML 😅
hollow shard
Well because its useful, and for me at least, fun to know how these things work, and the best way to learn how something works is to make it yourself
it really provides great insight into how what youll be working with actually functions, which allows you to work more efficiently
personally, because its my hobby, i make it a rule to only build stuff from scratch, because i dont see the fun in just writing a few lines and getting results, but i think its good to at least build a simple neural network yourself first @chilly glen
chilly glen
Ohhh thank you @hollow shard for the honest answer 💯
hollow shard
Np 👍
hollow shard
Well I use numpy, but not tensorflow
building neural networks is a challenge but not impossible
at the end of the day its just simple calculus and its really rewarding, for me at least
again, building a normal neural network for mnist with only numpy is practically a rite of passage, but youll most likely want to build cnns and more complex stuff using tensorflow
chilly glen
Aah ok I'm not too familiar with the jargons

Anyway what's the best way to start ? I probably feel like one need to have a strong maths
hollow shard
Well mnist is just a dataset of handwritten numbers
one second
there are 2 resources that really helped me, 3blue1browns video series on neural nets, and michael neilsens book, which comes with code

Home page: https://www.3blue1brown.com/
Brought to you by you: http://3b1b.co/nn1-thanks
Additional funding provided by Amplify Partners
For any early-stage ML entrepreneurs, Amplify would love to hear from you: 3blue1brown@amplifypartners.com
Full playlist: http://3b1b.co/...
Nielsens github is linked in the description
chilly glen
Should I start with neural networks ? Is that a beginning of the roadmap or something ?
hollow shard
Hm, how much do you know already?
i mean i would say yes, but others might say that it would be good to start with simple regression
if you really know nothing try the start of andrew ngs machine learning course
chilly glen
I am a software developer already on the ui side but I know python little bit. Yeah I believe I should start with Coursera Andrew ngs course
jolly briar
imo simple regression is important, i don't get why people do stuff like GANs and whatever right off the bat... and can't imaging them being any use in the workforce
maybe they are though, but I would be surprised i guess
hollow shard
I think for a lot of people its just a matter of interest
jolly briar
right - if it's purely interest then fair enough
but a lot also say they're interested in work
and in the case of the latter, i think they're probably wasting their time
that being said - "all roads lead to rome", if someone is having fun and is interested, it's not a waste of time necessarily if it leads to them getting the foundations etc at a later date
hollow shard
Right, for work purposes i think the majority of cases just need some kind of basic regression
hollow shard
Right, just data processing and visualisation (maybe) is hugely important
especially as a lot of peoples knowledge doesn't stretch beyond some simple excel formulas
hollow shard
Im trying to think of an actual scenario where gans would be useful
shell yarrow
hello data-sciencers, does anyone has a recommendation for a DB when crawling some subreddit on a local computer?
i'm only interested in subreddit name, text and timestamps. I don't care (or want) the other metadata
the type of operations i'll do with the crawled data are basic NLP things (tokenize, build frequency lists of n-grams, etc.)
eternal mantle
I've never used it in Python but maybe SqlLite could work if you want an actual database
shell yarrow
here's my consideration, writing to file makes it hard to have several crawlers in parallel
so I thought something that'd handle the locks out of the box would help 🙂
checking SQLite now and see if it has limitations re- size
ok the internet told me it'd be enough for playing at home (I don't intend to have more than 16TB of data for this experiment). Thank you Dexter!
edit: if someone has other considerations, recommendations, I'm all ears. It's still very early in the project and i'm mainly playing around prototypes.
 umbral forge
Got a question to ask the data scientists here. So let us just say we have an array of X amount of either True or False randomly distributed. I have a goal of just basically performing a search pattern that is based on a percentage of search coverage that will provide me with the amount of index skipping necessary to achieve that percentage. Of course, if it find True, then it should stop searching. So the percentage is more or less the maximum search coverage. I don't need it to be a complete linear search. Rather, just wanted to check an even amount of samples to see if True is in there.
For example, if I have 100 items of randomly True of False. If I want to perform a 50% search, then obviously I should be searching at array index of 0, 2, 4, 6... etc, which will provide me a 50% search coverage. If I have 159 items in an array and I want 30% coverage, then that means I should be searching roughly 47 or 48 items out of 159 to achieve that 30% search coverage. How would I translate that into the appropriately evenly distributed index out of 159 in order to do that? Such algorithm should obviously work in all scenarios like 1314 array length and 40% coverage will mean skipping X indexes to get that percentage coverage.
 reef bone
so we're just trying to calc the step needed between indices? that should be fairly easy to do
umbral forge
I mean it's really just skip by the 1/coverage, right?
reef bone
i think so yea
umbral forge
Bonus point if we do the search front and back towards the middle.
umbral forge
So basically, assuming it's a 50% coverage... 0, -1, 2, -3, 4, -5... etc?
Yeah that's fine.
The percentage is just there for a suggestion.
Does not have to be exact.
Just needs to be close enough.
reef bone
>>> def get_step(coverage):
...     return int(1 / coverage)
...
>>> get_step(0.5)
2
>>> get_step(0.25)
4
>>> get_step(0.9)  # Rounding 'error'
1
>>>
>>> from string import ascii_letters as data
>>> data
'abcdefghijklmnopqrstuvwxyzABCDEFGHIJKLMNOPQRSTUVWXYZ'
>>>
>>> for index in range(0, len(data), get_step(0.33)):
...     print(index, data[index])
...
0 a
3 d
6 g
9 j
12 m
15 p
18 s
21 v
24 y
27 B
30 E
33 H
36 K
39 N
42 Q
45 T
48 W
51 Z
it would be more tricky for bonus points yea, but just for one direction this seems sufficient
umbral forge
Yeah I guess so.
From performance perspective, given a random sample, would searching front and back towards middle theoretically supposed to be faster?
or there is negligible difference?
reef bone
it really depends on the distribution
for example, if we had 100 indices, there was only 1 True, and we could only check 10
and it's truly random
then just checking the first 10 should be just as good as checking each 10nth
umbral forge
Interesting.
Ah yes using range()'s step parameter is indeed a good way to do this. Thanks.
reef bone
yea it's "safe" in that it won't let you step outside of the allowed range
umbral forge
I don't know why I was having a brain freeze on this.
I think I was just thinking too much about the "bonus point" part, haha
reef bone
it's an interesting question and if you stick around for a while maybe you'll get a response from some of the more statistics-oriented members that lurk here, but if the distribution is truly random then I'm fairly sure it doesn't actually matter how you search
umbral forge
Right yeah it becomes a question of whether there is any performance to be gained from doing the extra work.
Maybe there is not.
Assuming a sample size of around 200.
If sample size becomes 1000, I wonder if that will make a difference though.
 silent swan
I'm not sure I fully understand the question
but if it's truly random it really doesn't matter how you search right?
the first K observations will have the same distribution as an evenly distributed K observations
umbral forge
On that note, is there a better search algorithm for tackling such an issue then? So the perimeter is a random sized array that contains a completely random distribution of True or False. I am not necessarily looking for 100% accuracy when searching this array for True. I just need a search that covers the array in a uniform manner. Maybe it could be 30% coverage, 50% coverage or more. So I guess I was just looking for an efficient way to achieve that @silent swan
 elfin hatch
I've been coding python for a while now but i can't think of any projects to try out (that take a medium to long time)
Any help?
uncut shadow
Hey. I have a small problem, gradient should point to the highest point on the graph but somehow for me it doesn't. What is wrong? https://pastebin.pl/view/13ce5f98
I had to use self.weights -= -np.dot(...) because only the the loss decreases
Pastebin.pl is a website where you can store code/text online for a set period of time and share to anybody on earth
chilly shuttle
so i haven't tried your actual code
but Gradient should point to the highest direction so I should substract it from weights, but then the loss increases.
gradients are not monotonic
you can and typically will have a drop in loss function on your way to the global maximum
see: local maxima/minima
jolly briar
given a dataframe with a multiindex for columns i want to just select the second level of the index, currently i have [x[1] for x in df.columns], I'm wondering if there's a better way / more pandas-y
 stable forum
@jolly briar df.xs() allows to select data at particular level.
uncut shadow
Hey. I have a general question. I have seen many times that in deep learning you have to take the sum of weighted inputs. There is one thing, I have never seen in any tutorial/video/repository doing this sum. The only thing people do is
activation(np.dot(X, weights) + bias)
So where is this sum?
 fallow vapor
Does anyone know how to get Vim keybindings in Jupyter?
 paper niche
@fallow vapor there’s an nbextension called “Select Codemirror Keymaps” that does this
fallow vapor
@paper niche awesome. thank you
velvet thorn
...in the dot product...?
oblique belfry
Is Scala good for data science/machine learning? If so, why? I see multiple libraries being written and Scala and I am curious why.
velvet thorn
Scala is generally better for productionisation than experimentation
Spark is written largely in Scala
powerful type system leads to stronger compile-time correctness guarantees
oblique belfry
Gotcha. I see Scala and Spark together a lot. How about for deep learning and neural networks? Mxnet has api bindings for Scala?
I am curious if one could take a trained model, maybe in Onnx, and run it in production in Scala.
silent swan
@uncut shadow dot product includes a summation
jolly briar
anyone had <IPython.core.display.Javascript object> appear in notebooks (using gitlab)? They're not there when i run the notebook locally, but appear when I commit to the repo then look at it within gitlab, I don't really get where they're coming from but they're kinda annoying
supple ferry
@void anvil , considering pandas 1.0 just came out it might take some time
supple ferry
Stack Overflow
I have a special case of integer partitioning. I have looked at StackOverflow and combined two pieces of code I have found. Yet, it does not fit my purpose well.
I want to have an array of k non-
If anyone can give me a helping hand, that would be great
lapis sequoia
hello every one, I'm quite new to python(Student), today i got an assignment in which i have to find the repeated value in column H and those rows where value in H is same those rows needs to be appended in new columns in front of old row.
please reply if anybody here to help
if question is not clear please ask for more clarifications
this the original csv and some work done
in img1 you can see name of person, suppose this name is repeated in the data then all rows where value is true those rows should be get selected
and repeated rows should be pasted in front of first value and if more than one then in new columns (i+)
 summer plover
I sent spiderMan here because I do not know the tools of the data science, but I know you guys do. if you could please help out that would be great 😄
lapis sequoia
@summer plover thank so much
 vagrant sparrow
Anyone in here use anaconda? Can you share your experience using it in data science?
dire stirrup
@vagrant sparrow very convenient
most of the ds libraries are alrdy installed in anaconda
vagrant sparrow
Is it easy to crawl data from youtube comments, twitter, facebook, instagram, etc? Do you have any tips and trick on using anaconda to do that kind of task?
@dire stirrup
dire stirrup
explore beautiful soup @vagrant sparrow
they scrape html code parts
it is installed in anaconda as well
vagrant sparrow
Do you recommend to use it with pycharm?
@dire stirrup well thanks for your insight and suggestions.. its help alot.. 😀👍
dire stirrup
Yeah pycharm is fine
lapis sequoia
here is the csv file if you want to try https://we.tl/t-cL3CcLMP77

1 file sent via WeTransfer, the simplest way to send your files around the world
looking for help 👀
velvet thorn
I actually don't really get what you're trying to do @lapis sequoia
do you have an example of what your result should look like
lapis sequoia
desired output
stable forum
@lapis sequoia Sorry, but the image is unclear as well. What you mean by, rows needs to be appended in new columns in front of old row?
I mean, when the values are duplicated more than once, do you add the columns, where?
lapis sequoia
@velvet thorn @stable forum please click on open original in the left-bottom of image for clear image
when values are found to be duplicated then number of columns ==number of times value if found duplicated
velvet thorn
no, I am not saying the image is of low quality/resolution
lapis sequoia
and the values should be paste into those columns front of original row
velvet thorn
I am saying that your intentions are not obvious from the image
stable forum
You want to output how many times, the DataFrame['Name on Account'] is duplicated, in new column?
Make simple excel, and just shoot a image, or structure your problem.
Asking about your attempted solution rather than your actual problem
So in your example, 'cell J' would be the count of item in the .csv, and then it would be the values?
And if the count is > 2, it expands horizontally?
lapis sequoia
yes
please allow me to explain
as you can see in cell 'H' have values using these values find duplicate
if duplicated value found:
then copy cell['D','E','F']
and paste those values in front of row1
 wide knot
hi everyone. anyone familiar with scikit's TSNE?
trying to run a 3MB file, but I always run out of memory and my whole computer hangs. 🙂
need ideas on how to handle large datasets for tsne. 😦
 jaunty canopy
reduce n_iter and perplexity. this would reduce exec time and reduce memory usage but solution would be less valide
“Since t-SNE scales quadratically in the number of objects N, its applicability is limited to data sets with only a few thousand input objects; beyond that, learning becomes too slow to be practical (and the memory requirements become too large)”
Medium
Update: April 29, 2019. Updated some of the code to not use ggplot but instead use seaborn and matplotlib. I also added an example for a…
wide knot
@jaunty canopy damn so it's O(n^2) in memory. hmm. right now I'm on perplexity=500, and I still haven't reached the point where the cluster generated is visually appealing.
I guess I'll just reduce my dataset for now (since I plan on increasing the perplexity further). What do you think?
jaunty canopy
ok
but you can try running a PCA first then running a tsne on the ouput. your choice.
wide knot
so the thing is my data is only 2 dimensional. is it still advisable to run PCA on this
jaunty canopy
as i said it all depends on you. but with 2D just reduce the dataset
wide knot
thanks !
 somber lagoon
so im getting into python. looks like im most intersted in processing text. so what kind of career path or jobs should i targe
 slim torrent
ok so after reading countless sql vs nosql comparisons I still have no clue what to use for my project
 still abyss
Hey guys, I'm running Ridge, Lasso and ElasticNet on some data with GridSearchCV. Should I be using the same alpha values for all three?
eternal mantle
@slim torrent I'd probably just go with SQL then. At least in my case, I already know it. Unless you need specific NoSQL features you can probably do fine without it. Never used SQL with Python myself but I heard with PostgreSQL is a popular combo. I'm also a fan of SqlLite
slim torrent
@eternal mantle thanks I will keep that in mind and will probably go with sql. although atm I'm trying out mongodb
velvet thorn
do you intend to hook it up to anything else?
like say a web framework or a cloud computing service etc.
lapis sequoia
@velvet thorn hey man
do you know if there's any open source serving option.. for building ML applications
like you know how we have kaggle kernels.. there's repos, an environment, hosting for notebooks, etc
jolly briar
how to replace chars in strings by dict
say
d = {'k':'t', 'a' : 't'}
df = pd.DataFrame({'a': ['dog', 'kat'], 'b' : [1,2]})
i want to do some
df.a.replace(d)
such that kat is converted to ttt
( here d contains a single value - i would like this to extend to as many as is needed )
jolly briar
show you what?
i know looping works , ive given an example
@lapis sequoia updated example
obviously you can just do
for key in dict:
    df.col.replace(regex=key, value=dict[key], inplace=True)
@lapis sequoia do you know or not?
lapis sequoia
im not sure what you're trying to do here
jolly briar
i don't know how you couldn't
lapis sequoia
replacing characters in a column with a dict?
jolly briar
yes, i don't know what is unclear from the example
lapis sequoia
if you could show me your expected input and output..
jolly briar
🙄
lapis sequoia
I meant, an example df
jolly briar
look up ffs
jolly briar
that would be a dataframe, yes
lapis sequoia
ok, and what do you want to do here
lapis sequoia
hey man.. this is a very roundabout way of doing this
dont write shit code and expect people to understand without telling them what you want to do
ideally you should have done something like
jolly briar
@lapis sequoia explain how it's unclear then
rather than failing to read for 10 minutes
dont write shit code
it's an example
without telling them what you want to do
it's specified in the example, if ... you... read
lapis sequoia
translate_dict = {'a':'X', 'b':'Y'}
translate_table = "ab".maketrans(translate_dict)
df["col1"]= data["col1"].str.translate(translate_dict)
it's hard to read, because I was trying to wrap my head around why someone would do that.. try to understand
jolly briar
well ask a question then
lapis sequoia
and an example means, actual sample input and output
jolly briar
don't imply it's not clear when it is
lapis sequoia
yes, that's perception.. to you it's clear because you wrote it.. in a way that's not optimal..
jolly briar
no
obviously i'm not going to give all the bloody context in a MWE
it has data, and what needs to be done with it
it doesn't get a fat lot clearer
jolly briar
@lapis sequoia I just want to make this completely clear:
an example means, actual sample input
d = {'k':'t', 'a' : 't'}
df = pd.DataFrame({'a': ['dog', 'kat'], 'b' : [1,2]})
** and output
i want to do some
df.a.replace(d)
such that kat is converted to ttt
there may be somethings that I missed, but you completely failed to
highlight any of them and instead made requests such as
show me
there's an example...
im not sure what you're trying to do here
it's explained
replacing characters in a column with a dict?
like in the example? ofc...
if you could show me your expected input and output..
like what's in the example?
I meant, an example df
the one in the example?
ok, and what do you want to do here
perhaps what's in the example?
etc.
lapis sequoia
calm down man
jolly briar
@lapis sequoia read, man
jolly briar
i didn't know str.replace took a custom function - you mean like apply etc?
velvet thorn
no.
jolly briar
hrm
velvet thorn
d = {'k':'t', 'a' : 't'}
df = pd.DataFrame({'a': ['dog', 'kat'], 'b' : [1, 2]})
regex = '|'.join(d)

df['a'].str.replace(regex, lambda match: d[match.group()])
output:
0    dog
1    ttt
Name: a, dtype: object
@velvet thorn that makes sense
not sure if i prefer it to looping over the dict or not though now
i thought there was something more 'inbuilt' for this i guess
velvet thorn
well, there's an obvious difference
but anyway it doesn't seem like a common use case to me
umbral forge
Don't want to hijack the current conversation here but I just put a question in #help-falafel that's data-science related if anybody here can help me 🙂
 quartz stream
Anyone interested in creating a AI model where we can check if the site is phishing or not based on database from https://www.phishtank.com/developer_info.php
So it would learn the features of what does a phishing site look like and it would detect the website which are not yet in the database but have similar characteristics to a phishing website
 trim ridge
The only real indicators in the data for a phishing site is the url containing or replicating anothers - which can be done through an algorithm. The times dont really tell much to AI nor do the RIR since servers are everywhere. Seems overkill.
trim ridge
For determining new phishing sites I would do this.
Go through each organisation and check if a key word of their's is in the URL or in any text/header tag in the HTML. Probably do this with regex.
I would check if the page has a <form> and an action attribute alongside a username/password input. Then compare the URL/IP of the action to the organisation its mimicking.
Only consider the RIR if its Chinese (APNIC).
Probably add some sort of checklist, if the page doesnt meet a set amount of criteria then put it up for human review.
quartz stream
Thanks a ton !
There should be probably a library which does the same
LOL
@trim ridge
trim ridge
Seems like a useful tool, will create if not exists.
jolly briar
@velvet thorn obvious difference in what sense? I get that they're different, i'm not sure what you're referring to though. I doubt it's a common use case, but it's one that I have 🙃
 lyric kernel
does anyone know of some minamal example code for GANs ? I want to use some more abstract example as sample code because i cant use the hundred lines of code, used for the original implementations of the papers.
 rigid summit
Hey, for some reason the results of my kruskal test doesn't display in my console, is there anything I can do to print the statistic and p value?
era_900_1100 = df.loc[(df['expected_recovery_amount']<1100) & (df['expected_recovery_amount']>=900)]

by_recovery_strategy = era_900_1100.groupby(['recovery_strategy'])
by_recovery_strategy['age'].describe().unstack()

Level_0_age = era_900_1100.loc[df['recovery_strategy']=="Level 0 Recovery"]['age']
Level_1_age = era_900_1100.loc[df['recovery_strategy']=="Level 1 Recovery"]['age']
stats.kruskal(Level_0_age,Level_1_age)```it runs, but nothing shows up in the console
plain turret
this will print in Jupyter Notebooks but not for regular console if i'm not mistaken
try printing it with print()
 cedar briar
visdom or tensorboard and why?
jolly briar
https://pandas.pydata.org/pandas-docs/stable/user_guide/style.html#Export-to-Excel
anyone had any joy with highlighting cells?
i just get this kinda thing
 kind hollow
is it me or is that not yellow 
jolly briar
its not yellow
oblique belfry
I started at a new company on Monday. When I was hired, I understood the situation that they had basic ML in place but were looking to take things up a notch. After being here most of the week, that is not the case. Their "ML" is just some thresholds. Actually, they offer 4 "ML" offerings, but only one of the offerings is used in production. I asked if they record the decisions of the ML (They save the data, run the ML, and get alerts if the threshold has been hit.), and they said no. They have no clue if what they are offering is even valid.
Given all that, I know I have a long way to go with this company. What are some valuable things I should know in building out this infrastructure? Obviously I want to start logging all these actions for the future so that I can run A/B tests on models and what not.
I guess my thing is, I know what I need to do for my job, but transforming a business into a data-driven business is a tall task and I want to make sure I am not forgetting anything. Also, it is a good way to share common best practices.
upbeat jetty
What are your favorite packaging practices? Basically, if you saw some console program written in Python for processing/visualising data you want to use, how would you like to be packaged and organised? I'm asking here because data science is close for intended audience.
 carmine forge
hello, can anyone share an impressive jupyter notebook, something visiually appealing and scientific in nature, preferably something related to geology or natural sciences
lapis sequoia
@oblique belfry tell me more
you need infrastructure in place for versioning models, recording results, verifying them and updating models..
 grand copper
Hey, does somebody know how to find a second dominant frequency in a signal?
grand copper
Not at the moment. Couldn't really understand it.
grand copper
czestotliwosc, Data = wav.read(root.filename)
        if len(Data.shape) == 2:
            Data = Data[:, 0]
        dlugosc = len(Data)
        okres_cz = 1.0 / czestotliwosc
        sek = dlugosc / float(czestotliwosc)
        czas = np.arange(0, sek, okres_cz)
        #Transformata fouriera
        FFT = np.abs(fft(Data))
        FFT_side = FFT[range(dlugosc // 2)]
        czest = np.fft.fftfreq(Data.size, d=(czas[1] - czas[0]))

        #Znajdowanie maksymalnej czestotliwosci w sygnale
        pos_mask = np.where(czest > 0)
        czest_prob = czest[pos_mask]
        max = czest_prob[FFT[pos_mask].argmax()]
        max = int(max)
        print(max)
"czestotliwosc" is rate, "dlugosc" is length, "okres_cz" is a period? (you see it in code, 1 divided by frequency/rate)
"sek", I have no idea, myself.
I'm on the phone, that's why I haven't translated in code.
lapis sequoia
well the formatting isn't helpful either
gonna need comments or at least a formula
lapis sequoia
I am trying to use the AdaBoostRegressor with scikit optimize and it needs the predict method to also return the std dev of y at X , I am using the ExtraTreesRegressor as the base estimator
oblique belfry
@lapis sequoia Sorry. I fell asleep and it has been a crazy morning.
When I first took over the job, I was concerned about model versioning and whatnot. But, that was under the assumption they were already recording all that they were doing.
But even with their crude "ml", they do not record the output of their predictions. How can you implement ML if you do not even know what the baseline is?
Just a big culture shift.
Wasn't prepared for that.
lapis sequoia
https://www.reddit.com/r/learnmachinelearning/comments/faxrpr/where_can_i_learn_about_activation_functions_loss/. Can anybody give suggestion for this questions which might help.Thanks!
reddit
0 votes and 0 comments so far on Reddit
 strange stag
mk, so i have df1 with the keys ['direction','Exp Date','Name','Exp Time','Price'] and df2 with the keys ['Name','Exp Time','Exp Value','Exp Date'] and i am trying to merge these two dataframes, the only difference being that the columns direction and Price, which are not existent in df2
.merge and df10 = pd.concat(frames, keys=['Name','Exp Time','Exp Value','Exp Date','Price', 'direction']) not exactly working
velvet thorn
merge how
I’m assuming you want to combine the rows?
and the values in the columns from the second dataframe will be null?
strange stag
lolz... nvm was concating the wrong dfs..
strange stag
@velvet thorn you still there?
anyone know why im getting a Unable to allocate array with shape (23980000,) and data type int64
when trying to df = df.drop(df[df['Type'] == 'Spread'].index) with a jupyter notebook
I know the df is huge (282mb) worth of lines, because im reading in 180-ish csvs with 10-20k lines each
2,995,051 rows
stackoverflow suggests 64bit python, but i am using this...so
perhaps it is because i am doing this...
df = pd.DataFrame()
for csv_file in csv_files:
    df = df.append(pd.read_csv(csv_file))
df.info(memory_usage='deep')
says the memory usage is 1.0GB, so this is by no means out of my computing power
strange stag
jupyter notebook
velvet thorn
in Jupyter stuff hangs around
how about this?
pd.concat([pd.read_csv(filename) for filename in csv_files])
strange stag
MemoryError: Unable to allocate array with shape (6200000,) and data type int64
when running
df = df.drop(df[df['Type'] == 'Spread'].index)
perhaps i should use a loop instead?
hmm, samething with a loop
just a lesser shape
for x in range(len(df)):
    if df[df['Type'][x] == 'Spread']:
        df = df.drop(df[df['Type'] == 'Spread'].index)
 ripe forge
@strange stag can you check what python is running just to be safe? What os do you use?
If you're on windows or Linux, run import platform; platform.architecture()
strange stag
('32bit', 'WindowsPE')
notebook using 32bit?
hmm, didnt error when i ran it outside of the notebook
ripe forge
You most likely have multiple python installs and your notebook is launching with the crappy one
Remove the 32 bit python, and only use 64 bit
 jovial river
How can I graph a multiple linear regression model? I am having trouble with this because when I go to graph, it tells me that x and y has to be the same size. How can I make them be the same size then?
Here are my x and y variables. Data is a pandas dataframe.
y = data['mpg']
x = data[['cyl', 'disp']]
x_train,x_test,y_train,y_test=train_test_split(x,y) # by default will do a 25,75 split for testing and training respectively.
x_train
plt.scatter(x_test, y_test, label='Testing Set') # Error not the same size.
plt.plot(x_test, efficiency_y_pred_model_1, label='Model 1', color = 'orange', linewidth=2)
plt.plot(x_test, efficiency_y_pred_model_2, label='Model 2', color = 'red', linewidth=2)
plt.xlabel('Cyl')
plt.ylabel('Mpg')
plt.title('ROC curve')
plt.legend(loc="best")
plt.show()
print('MSE for model1: {0}'.format(MSE_model1))
print('MSE for model2: {0}'.format(MSE_model2))
anyone know a faster way to do this?
for x in range(len(df)):
    df.loc[x, 'Exp Time'] = datetime.strptime(df.loc[x, 'Exp Time'].split(' ', 1)[1], '%I:%M %p').strftime('%H:%M')
 analog dawn
HELLO GUYS DO YOU KNOW ANY GOOD COURSE THAT ARE COMPLETE DATA SCIENCE ?
velvet thorn
what exactly do you want to do @strange stag
@jovial river well, a plot only has 2 axes, but you want to graph 3 different variables (two features and one target)
 sand fractal
Got any good guides for making a word frequency generator?
I feed it a CSV file full of comments. I would feed dictionary so it can account for different words
jovial river
@gm ya I figured I would have to either graph it as a three dimensional plot or plot each feature separately.
velvet thorn
you could use colour for the target
hollow shard
hello, I've been writing a CNN from scratch to train on the MNIST data, but its been producing strange results, for example the accuracy rising to 30% and then just falling back down to 10%, could anyone please look at my code and find out why this is, because I'm stumped
http://dpaste.com/0SY73M0 (code updated to follow pep8)
its very loosely based on this tutorial:
https://towardsdatascience.com/a-guide-to-convolutional-neural-networks-from-scratch-f1e3bfc3e2de
Medium
Convolutional neural networks are the workhorse behind a lot of the progress made in deep learning during the 2010s. These networks have…
uncut shadow
Hey. I have a question. How to update biases? I initialize them all to be 0 at start, but how do I have to update them during backpropagation? This is my code so you can run it and check https://repl.it/repls/SnoopyGleefulTab

Repl.it is a simple yet powerful online IDE, Editor, Compiler, Interpreter, and REPL. Code, compile, run, and host in 50+ programming languages: Clojure, Haskell, Kotlin (beta), QBasic, Forth, LOLCODE, BrainF, Emoticon, Bloop, Unlambda, JavaScript, CoffeeScript, Scheme, APL, L...
hollow shard
I believe it would just be dfunctionin your dense code, but also dont initialize weights or biases as zeros
also @uncut shadow if you want I have complete code of a neural network from scratch if you want
 hot badger
I want to save data which is in train which has 5 rows and 12 columns into csv file how to do it?
oblique belfry
df.to_csv
 harsh sapphire
Hi! I have a question related to memory for Data Cleaning. Right now I'm running an iterated for loop across a DataFrame that stores audio files. Everything in the for loop is working perfectly. It pulls a file splits it into time segments and generates and saves a spectrogram for each audio file. However, I can't seem to figure out what it is holding in memory. I have plt.close and soundfile.close() after my data read ins and image generation.
I keep getting crashes after it consumes about 14GB of RAM over 2~3 minutes.
It's 50+ lines but I can't post or message the code if you need it.
Also I have an ipywidget for variable inspection. Which doesnt't show any objects stored in memory
oblique belfry
https://developers.google.com/machine-learning/guides/rules-of-ml
Very good guide by the Google team to develop ML infrastructure in a business from scratch.

Google Developers
uncut shadow
@hollow shard Yes, I'd like to see those nets from scratch If you can show the repo, thanks
jolly briar
anyone have any approach of keeping papers they download organised? my downloaded pdfs are a bit of a mess...
late jackal
would this be the proper channel to ask about dbscan sklearn?
 worn stratus
yes @late jackal
late jackal
i have some clusters that i plotted but there seems to be lots of noise would you know how i can make a second plot that doesn't include the noise so that i can see the clusters more easily
lapis sequoia
If we're allowed to ask questions here then I'd really appreciate if anyone has any insight to my issue in #help-croissant
oblique belfry
@jolly briar
I used to keep them all in Dropbox. Now I just keep a private Git repo with notes on them.
jolly briar
@oblique belfry hrm, yeah i do something similar.
something that i've made good use of recently (couple of months or so) is the
following:
make_note() {
    pushd ~/<where i store my notes>
    clear
    vim daily-notes/$(date +'%d-%m-%Y'.md) -c 'Goyo'
    git add .
    git commit -m "notes update"
    git push
    popd
    clear
}

search_notes() {
    # search through daily notes dir
    egrep -rni ~/<where i store my notes> -e $1 --color=auto
}
with aliases for each of them.
oblique belfry
Nice. How does the search work.
Does egret look through the files?
Sorry. Egrep...texting on the new iPad is a new experience.
jolly briar
@oblique belfry yeah it looks through all the files
haven't got enough for it to be an issue yet speed wise, it's been handy though
oblique belfry
Nice. I’ll be stealing those bash commands. Lol
I wish there was an easier way.
jolly briar
tbh i'm not sure if there could be an easier way
I mean - here we've just chained a few commands, which is the beauty of terminal stuff i guess
people probably use something like evernote or whatever for less than this provides 🤔
idk though, as I've never used anything like that lol
oblique belfry
I tried Dropbox paper since I like markdown.
jolly briar
yeah i take all these in md
and i've been tagging them as well at the end - and making sure (when possible) everything is on oneline
so that a search brings up the context
currently i have 33 files and 2585 lines, apparently...
jolly briar
@lapis sequoia steal my commands, now you're on the level 🤝
lapis sequoia
I would if I could understand them XD
I do computer science GCSE and we've just been introduced to python
currently we are doing an exam which is just mainly text file handling, organising data in a text file and recalling the data back and sorting it
jolly briar
this isn't python fwiw - these are just a couple of functions that you could put in your bash/zsh rc file
exam sounds pretty pragmatic
lapis sequoia
Is it possible for me to create a dataframe that contains a bunch of different categories, then add in only a few specific categories at a time while leaving the other blank until later? I have a large datasets that I need. The page I'm scraping has a built in html table for some of the data, but not for all of it. Could I grab that table, insert the appropriate data, then leave the rest blank until later?
 weary finch
Hey guys, looking to learn how to continuously retrain and redeploy ML models in production as new data becomes available. I have very good skills with scraping and would like to use them as a means to update the data to retrain models with.
Does anyone have any ideas of websites I could scrape off to do this?
 copper umbra
Can anyone here help me with a seaborn visual problem
normal output looks like this
but then i try to add the line width being determine but a integer value (removing the # from the code it does this)
hollow shard
Anyone ever seen a cnn behave like this before? (accuracy vs batches trained on)
the dataset is mnist btw and a keras model with the same architecture got 98% accuracy
uncut shadow
Hey. I was trying to make a neural network from scratch. The problem is, that it doesn't work like it should. I mean, it's not very accurate. Could somebody check it and suggest what should I change or add?
https://repl.it/repls/HorizontalWarmheartedDegrees
Repl.it is a simple yet powerful online IDE, Editor, Compiler, Interpreter, and REPL. Code, compile, run, and host in 50+ programming languages: Clojure, Haskell, Kotlin (beta), QBasic, Forth, LOLCODE, BrainF, Emoticon, Bloop, Unlambda, JavaScript, CoffeeScript, Scheme, APL, L...
 proud iron
hello, is this a place where i can ask for help regarding coding of machine learning?
or do i ask in the many #help channels
velvet thorn
@proud iron depends on how in-depth your question is
simple questions/theoretical questions fit here, I think
proud iron
ah i see
it's posted on #help-apple
but it's basically me having trouble with label encoder from sklearn library
would a question like that fit here?
i'm just making sure, as it seems like this is a place for discussions rather than help
velvet thorn
yes, that would be fine
I think
but anyway, the reason is that you're using the wrong class
I think what you want is OneHotEncoder
LabelEncoder is for targets
not features
@uncut shadow honestly, I don't think many people will be willing to go through your code step by step and find out what exactly is wrong with it
it's quite a high-level bug
lapis sequoia
I'm making one dict from csv,
but getting all values of column in one key
but i want only that row should be get values in dict
here my code
please open in original for high quality img
sorry if i make any mistake , i'm quite new into this
not sure what you're trying to do
you want to load your csv as a dict?
then?
i want to make dict,
here column Vincode should be key and other rows as values
velvet thorn
hm.
velvet thorn
if I understand correctly...
you probably want a comprehension.
{row['VINCODE']: [row['District'], row['Taluka'], row['VIL_NAME']] for _, row in df.iterrows()}
lapis sequoia
please read this
actually i'm working on one assignment
@lapis sequoia
if I understand correctly...
@velvet thorn
output
here how to get individual key and it's value here
ok I got it
velvet thorn
@lapis sequoia don't ping me thanks
lapis sequoia
sorry
 late garnet
I would love to have anyone interested in time series data mining to check out this article and GitHub repository.
If you like what we are providing, a simple github star goes a long way!
“How To Painlessly Analyze Your Time Series” by Andrew Van Benschoten https://link.medium.com/ADrCfELCt4


GitHub
A Python 2 and 3 library making time series data mining tasks utilizing matrix profile algorithms accessible to everyone. - matrix-profile-foundation/matrixprofile
velvet thorn
@late garnet didn't you post this already?
late garnet
I had a typo, deleted it and reposted instead of editing. I apologize for the spam.
 polar acorn
How similar is it to stumpy?
late garnet
It is similar with different goals in mind. Stumpy is particular about what implementations it offers while our library is more full-featured. We try to make the barrier to entry low. Basically, you can treat the algorithms like a black box and just review the results. Stumpy requires some academic/technical understanding of the underlying algorithms prior to usage. For more details, you can read the article linked above.
polar acorn
Looks nice. Are you (as in the organisation) affiliated with research environment that published all those matrix profile papers?
late garnet
We are not directly affiliated with that group, however we do have web meetings with Eamonn at times and are provided early research results.
polar acorn
Seems nice. I considered matrix profiles for my current time series problem but looked elsewhere due to d>>>n, but I hope I get an excuse to try it out soon.
late garnet
d>>>n?
polar acorn
Many many more features than samples, highly correlated as well.
late garnet
I see
A GitHub star goes a long way in showing your interest in our work. 🙂 It is also highly appreciated!
Andrew and I are the original maintainers of the Target repository "matrixprofile-ts".
lyric kernel
Hey guys,
what is the "by design" way of providing a trained model to make predictions inside another application ? Like a Windowsforms app or something like that ?
Is it always : Set up an API ?
 eager heath
Not always, you can actually deploy the model
lyric kernel
Can you point to any ressources about that ?
The official Tensorflow stuff includes some weird docker & Kubernetes method
TensorFlow
late garnet
Your question is highly dependent on the use case. Are you hoping to integrate your model into a web application, desktop application, mobile application or make a library for many people to use?
lyric kernel
Lets say a desktop application. Im mostly looking for a point to read all about it. Not 1 specific solution. When i was looking by myself i didnt find what i was looking for
 timber shadow
Can someone help me with why my code isn't plotting anything on the graph?

I currently only have one set of values, but even that isn't being plotted
hollow shard
@timber shadow if you just want to plot one point use plt.scatter instead of plt.plot
also ur .append's are out of the loop
idk if thats an issue
timber shadow
Thanks, the issue was really silly in the end
It’s basically that I was only doing one set of data to start, then check it all works
But obviously it’s a line graph so it needed a second set of values to plot
rigid summit
Hey! I'm wondering how I get a $278 value from this regression - I'll explain more if needed:
The idea is that the actual_recovery_amount is greater past the $1000 expected_recovery_amount threshold. I'm just unclear how my course got a $278 difference from this output
The cost of recovery past $1000 is $50, if that helps
strange stag
What i mean by merge is... subtract the larger dataframe from the smaller giving me a new dataframe, that consists only of rows that are present in both dataframes
how do i merge these two dataframes...?
df1 ~> Index(['Name', 'Exp Time', 'Exp Value', 'Exp Date', 'Strike'], dtype='object')
df2 ~> Index(['direction', 'Exp Date', 'Name', 'Exp Time', 'Strike'], dtype='object')
df1 having the column Exp Value that does not exist in df2
df2 having the column direction that does not exist in df1
rigid summit
You need to use pandas .concat like this:
pd.concat([df1, df3], join="inner")```the "inner" means just the ones that match
strange stag
ah okay
rigid summit
Any insight on my stats?
strange stag
hmm
rigid summit
Didn't work?
strange stag
think i need to match on columns
and na... not a clue on your problem 😕
might have to give it more of a think, but i really dont think i can help w/ that
however, in regards to myself, i really am grateful for you giving me a direction on where/what to look for / do
rigid summit
I think I'm must being brain dead, it's the coerrelation coeficient that gives the number changed per one unit, I guess I multiply that by 1000?
No worries man, that's the first time I could help someone, I'm learning too
strange stag
ye, i literlly have no idea what ur talking about lols...
rigid summit
I'm pretty sure that's it. It's like a dollar change - for $1 of expected amount recovered, $2.something is actually revovered, past the threshold. So for the $1000 it's just $2.something times 1000
Must be some variance, and my course answer is just off because of that. But that is dangerous thinking in math derp
strange stag
ima be selfish and ask if u can help me with my q tho 😛
df3 = pd.concat([df, signals_df], join="inner", axis=1, objs=['direction', 'Name', 'Exp Value', 'Exp Date', 'Exp Time', 'Strike'])
TypeError: concat() got multiple values for argument 'objs'
rigid summit
I don't think you need the objs
just the simple one I put up
It should merge the right ones auto
strange stag
does not tho
well
lemme see if im blind
ye..
len(df3) = 1980875
len(df) = 1979663
len(signals_df) = 1212
rigid summit
try:
strange stag
so its adding
rigid summit
pd.concat(objs, axis=0, join='inner', ignore_index=False, keys=None,
levels=None, names=None, verify_integrity=False, copy=True)```oops
not outer inner
strange stag
df5 = pd.concat([signals_df, df], objs=k, axis=0, join='inner', ignore_index=False, keys=None,
          levels=None, names=None, verify_integrity=False, copy=True)
TypeError: concat() got multiple values for argument 'objs'
k = set of keys from df & signals_df
rigid summit
Not sure man, without fucking around with the data
I was just reviewing this:
https://pandas.pydata.org/pandas-docs/stable/user_guide/merging.html
and this:
strange stag
ight, nw, ill figure it out 🙂
strange stag
@rigid summit .combine_first o.O
rigid summit
You got? 👍
strange stag
dono, crashed my kernel, trying again 😛
darn, nvm Update null elements with value in the same location in other.
this seems more promising df5 = pd.merge(df, signals_df, on=['Exp Date', 'Name', 'Exp Time'])
lyric kernel
When i load data into a df . Then do something alike this:
new_df = df['Column1', 'Column 3']
df = []
does this free up the memory of the complete df that i stored at the beginning ? Prob not. How could i achieve this though ?
lapis sequoia
you can delete the df
lyric kernel
but does it free the memory ;/?
lyric kernel
lemme check
lapis sequoia
you can also, reduce memory usage by assigning fixed data types for your columns
lyric kernel
hm ?
lapis sequoia
df[col].astype(np.int8)
8, 16, 32, 64.. same with float but float 16, 32, 64
you need to check the min max of each column then assign one of these under which it falls under
lyric kernel
Hm would i check the min max before loading ?
lapis sequoia
i meant after loading
then whenever you do operations, you'll handling relatively lighter data
you can also take a look at dask
im gonna sleep now
byeee
lyric kernel
thx !
lapis sequoia
np
 blissful pike
for ML, anyone wanna give a detailed explanation between pytorch and tensorflow? which one should i pick up and should i eventually pick up both for ML?
 late drum
anyone familiar with openpyxl? It seems to refuse to close files it loads so raises errors when used in temporary directories
hmm, seems to only happen with "read_only" mode
 merry portal
So I finally figured out how to take a series, and create a multiplication table with it. For given numeric series nums, the below code works, but I'm wondering if there is builtin way to do this. Or if numpy has something
pd.DataFrame([nums]*nums.shape[0], index=nums.index).mul(nums, axis=0)
velvet thorn
@merry portal what do you mean by a multiplication table?
like this?
1 2 3 4  5
1 2 3 4  5
2 4 6 8  10
3 6 9 12 15
@lyric kernel why do you want to free memory manually?
velvet thorn
ah, okay, I see
that's simple
>>> a = np.arange(4)
>>> np.multiply.outer(a, a)
array([[0, 0, 0, 0],
       [0, 1, 2, 3],
       [0, 2, 4, 6],
       [0, 3, 6, 9]])
Ah yet thats it. Then you could pass it into dataframe contstructor along with original series as index and column, and everything is still magic. Thanks!
umbral forge
# Just curious how many iterations there are.
iteration_count = 0


def breadth_first_search(arr):
    global iteration_count

    # Length of the input array.
    arrayLen = len(arr)

    # Store traversed index here as proof.
    indexArray = []

    # Loop through the level as the divide will be exponential.
    for i in range(1, arrayLen):
        # Break out of loop when indexArray is complete.
        if len(indexArray) == arrayLen:
            break

        # levelArrayLen is the length of array split by the exponent amount.
        levelArrayLen = arrayLen // i

        # Start at 0 at the beginning of a level loop.
        first = 0

        # Loop through and start splitting into logarithmic amount.
        for x in range(1, i + 1):
            # Want to see how many times it ultimately iterated.
            iteration_count += 1

            # last is the length of array multiplied by how many times splitted.
            last = levelArrayLen * x

            # mid point of each split within a level.
            mid = (last - first) // 2 + first

            # Store mid point into indexArray and check its neighbour too.
            if mid not in indexArray:
                indexArray.append(mid)
            elif (mid + 1) not in indexArray and (mid + 1) < arrayLen:
                indexArray.append(mid + 1)
            elif (mid - 1) not in indexArray and (mid - 1) > -1:
                indexArray.append(mid - 1)

            # If the value in that index is True, break out.
            if arr[indexArray[-1]]:
                return indexArray

            first = last + 1

    return indexArray


testArray = [False, False, False, False, False, False, False, False,
             False, False, False, False, False, False, False, False]
print(breadth_first_search(testArray))
print('Iterated %s times.' % iteration_count)
So I made this attempt of breadth-first-search by attempting to divide the testArray down logarithmically. The idea is checking the middle of each logarithmic split of the testArray to see if it is True. The testArray is supposed to represent a sample which should only contain either True or False with the possibility of "clusters". These codes are working about as what I expected and basically it's just cycling through indexes logarithmically and add the middle index value into another array to signify that it has been "checked". The checking part, which may potentially be computationally heavy, doesn't get executed unless it's not part of the indexArray, in my attempt to be efficient with the check. However, if you see the print statement of Iterated X times., you will see that depending on the size of the sample, it can iterate many more times than its actual sample size. For example, if you replace the single True in the testArray and run it, you will see that it iterated 21 times. I am just curious about how bad that could be in a scalable sense and whether you guys can help me think of a way to minimize extra iterations? I am hoping just looping through and manipulating integer (index value) is pretty trivial in and so more iteration isn't the worst thing.Thank you!
velvet thorn
@lapis sequoia why don't you post your code/errors as text?
lapis sequoia
sorry, I will
'''Python
`Python """Rename multiple files in dir"""
import os
FilePath=r"C:\Users\Pocra_Gis\Desktop\2"
r=root, d=directories, f = files
for root, dirs, files in os.walk(FilePath):
for filename in files:
FileRename=(filename[filename.find('(')+1:filename.find(')')]+filename[-4:])
os.rename(filename,FileRename)
print(root,FileRename) `
thank you "gm" for suggestion
here only files in first folders get renamed
lapis sequoia
i'm getting error when in goes into subfolder/files
if i print print(root,filename)
i gett all the files present in dir C:\Users\Pocra_Gis\Desktop\2 1.txt C:\Users\Pocra_Gis\Desktop\2 2.txt C:\Users\Pocra_Gis\Desktop\2\1 TestFile(1_1).txt C:\Users\Pocra_Gis\Desktop\2\1 TestFile(2_2).txt C:\Users\Pocra_Gis\Desktop\2\2 TestFile(2_1).txt C:\Users\Pocra_Gis\Desktop\2\2 TestFile(2_2).txt
lapis sequoia
can anybody help
lapis sequoia
Hi morning!
I need some advice on below interview questions I met:
How do you define KPI?
How do you formulate clear problem statement, and hypotheses based on data insights?
Definition of all the metrics you plan to use?
Identification of key stakeholders?
I was working as ML engineer in B2B company. All I know is how to measure the algorithms performance... I am struggling in answering these questions. I'd appreciate some help there. Thanks!
 hybrid pecan
Those are going to depend heavily on the situation
lapis sequoia
As far as I am concerned, majority of the B2C companies asked me such questions without giving a clue. I checked what standard KPIs are out there, and got like 18+ at least depending on business interest: such as retention rate, churn rate, customer lifetime value, etc. You can imagine companies like these make money by having customers subscribing their products regularly. So how do you as data analyst/scientist can define a KPI, or formulate a problem statement?
lapis sequoia
so goddamn many questions lately
would love to try to answer some but it would take forever
lapis sequoia
Yo would anyone be able to help me create a histogram?
umbral forge
It would be lovely if somebody can answer my question if they scroll up just a little bit though 😉 It's a bit long but could be interesting to data scientists! As always, I appreciate the help!
velvet thorn
@umbral forge at this point
it's not really a data science question
more a computer science question I would say
umbral forge
You think so? So you'd suggest that I ask it in another channel then? @velvet thorn
I certainly can post it in #algos-and-data-structs
umbral forge
Done and thanks for the suggestion!
merry portal
When sorting in pandas, how can I break ties by index? Assuming index was not initially sorted, so using a stable sort will not give correct output
velvet thorn
how do you want to break ties then
merry portal
Unless pandas interally sorts index and I'm not aware of it. In which case a stable sort will work
velvet thorn
oh, what you mean is
you want to sort by values, but the lower indexed row will come first?
merry portal
Sure
velvet thorn
.sort_index().sort_values()
merry portal
Do I need to pass mergesort to sort_values as kind of sort to perform?
merry portal
Ok thank you. Just starting with pandas/scientific computing, and you've been a huge help!
velvet thorn
no worries, it wasn't much
incidentally, your other question
there are different kinds of indices, and you can check which with .index
in particular, the most common is a RangeIndex, which doesn't store individual values for each row
only a start and end, and therefore it is sorted by definition
merry portal
Oh yes. I think I have like int64 or somethign
velvet thorn
in this case, you would not need to sort by index
merry portal
Yep that makes sense
 fading abyss
Hello all!
I just started learning python and I want to take on a little project to practice what I have learned so far.
I am currently working for a destination management company and we are receiving a booking list from tour operators that we are uploading to our system for our reservations department to work on. The problem is that, the text file is inconsistent. I normally need to look for incorrect data then replace it with a correct data. In order to do so, I’m currently using Power Query to split the rows based on the positions and have it loaded in excel as a table. From there, I applied a conditional formatting that highlights the rows with incorrect data which I will then correct. Once done, I will copy the data to a notepad then just remove tab to put back each fields to their correct positions before uploading to our system.
My question is. How will I be able to execute the same task in Python? The goal is to have our end-users upload the received booking list. A script will then parse the text and look for the rows with errors and return it on a table ( some sort of form ) so that our end-users can correct it. Once done, they will apply the changes, then export a new text file with the changes.
What tools/library do I need to accomplish the task? I’ve been reading up about text processing and I keep seeing NLTK. I’m just hoping to know how would you go about the task as an experienced python developer. I hope the above makes sense. I want to include a sample data but unfortunately, there are sensitive information that I can’t share.
 dull fern
Hello @fading abyss, for anything related with excel/power query/tables you can look into the pandas library
Then it depends on what kind of text processing you wish to do. Maybe custom rules with regex (re library) can be enough. If you want more complex processing you can check SpaCy
velvet thorn
@fading abyss it depends on the nature of the errors
lapis sequoia
Anyone got any resources on how to prepare data for a neural network? I'm using pytorch
oblique belfry
Well...what type of data do you have?
lapis sequoia
a spreadsheet of football games
dates, teams, results and statistics
Project for a job opportunity. Hopefully goes well
oblique belfry
-
Congrats. I hope it goes well.
-
I assume this is some type of regression like problem?
I know more about CV problems, but the general start of data prep is:
- Checking outliers and null data
- One-hot encoding things that need to be one-hot encoding
- Scale data
- Setup a Pytorch DataLoader
There are others on here that can help you out more than I can. Good luck.
lapis sequoia
Thanks
Was looking at Sentdex's videos on pytorch but we don't have similar data. Plus his data is already prepared and ready to be fed to the NN
oblique belfry
I wish there were more posts on data prep. That is always the "magic" of those tutorials.
lapis sequoia
Yeah usually they go "A NN is very easy to set up! Just a few lines of code"
But the real work is data preparation
fading abyss
@velvet thorn and @dull fern , nothing sort of complicated errors. Just some incorrect numbering on some rows.
Like for example in the screenshot, the left most 7-digit-number is the booking reference field. The right most highlighted numbers are the number of members in each room and the highlighted numbers in the middle is the number of rooms under the booking reference.
That booking should be 3 rooms, but it was numbered as 1 and 2. So that field should be replaced by 3. Then the number of members is 1 through 5, but it should be 1,1,2,1,2. Meaning 1 single occupancy room and 2 double occupancy for a total of 3 rooms.
Anyhow, I'm not planning to implement some sort of algorithm to automatically replace those numbers as of yet. The goal for now is to output the data in a tabular form and have the end-users an option to replace the numbers to a correct one and re-export it so it's ready to be uploaded in our system.
dull fern
So the screenshot is what you get as an input ? And you would like to export it to an excel file, correct it and then back to that format, right ?
lapis sequoia
Could I please get some help? I'm trying to use a query to get only a select few cities to show up in a column but I just keep running into issues
donations_new.query('Contribution_City == "MANCHESTER"'and 'Contribution_City == "NASHUA"', inplace = True)
Now whenever I use donations_new.head() nothing shows up
fading abyss
So the screenshot is what you get as an input ? And you would like to export it to an excel file, correct it and then back to that format, right ?
@dull fern Yes. That’s the input file we are receiving. No, not in excel. I’d like to keep them out working in excel as those numbers cant be replaced directly with a number. There are whitespaces before the number to keep them in the correct position when uploading in our system. They might end up putting the number on a wrong position. What I have in mind is output it in a tabular form ( web browser ) and have them correct the numbers there. Once done, they will submit the changes and my script will do the necessary actions to position each data then output it again on a text file that is ready to be uploaded.
 lone blaze
Hello!
eager heath
Hey!
dull fern
@fading abyss Alright, so basic string formatting should be enough for the processing part, you could use the string method split to catch each "field" of a row in a list. Then the method format or join should work to put them back together.
 silk cedar
Hello, new to the discord world, if I have questions on manipulating large excel sheets using pandas would this be the best channel?
 runic rock
silk cedar
runic rock
silk cedar
Trying to haha
Seems that pandas is not optimized for sorting so it is very slow, I am also relatively new to Python/programming in general so I am sure there is probably a better way just in the case that I am using it
jolly briar
@silk cedar what's the question
merry portal
If I have a pandas dataframe that is sparse on both rows and columns (15x more row than column), which of the scipy.sparse matrix representation should I be using for math operations? I'm guessing block sparse matrix or compressed sparse row matrix, but not sure. https://docs.scipy.org/doc/scipy/reference/sparse.html
I'm doing: mean, subtraction, element-wise or row/column wise multiplication and dot product with another matrix or vector
silk cedar
Essentially I am looking through one excel and if the serial matches in another excel write a date of manufacture to the original spread sheet
`for s1 in df.itertuples():
idx=s1.Index
print(s1)
for s2 in dfDoM.itertuples():
idx2=s2.Index
if df.loc[idx]['Serial'] == dfDoM.loc[idx2]['BARCODE']:
df.at[idx, 'DoM'] = dfDoM.loc[idx2]['PACKING_DATE']
break
problem is the second excel is 61k rows and the first is 5k
I am sure there is a better way using pandas, but not sure how
Also even better would be probably just analyze lists but I was trying to remain in pandas because going from excel to list back to excel sounded tedious
@jolly briar
jolly briar
@silk cedar not sure i fully follow - can't you merge ?
silk cedar
Maybe? Haha sorry still pretty new to this
silk cedar
Thanks! Off the top of your head do the formats of the two df's have to match?
jolly briar
what - the types of what you'd be merging on?
if df.loc[idx]['Serial'] == dfDoM.loc[idx2]['BARCODE'] works then i'd expect merging to work as well
 unborn shuttle
Hello all 🙂 I am seeking direction towards a sub-community within the data-science group that covers topics in bioinformatics, preferably using Python + regex to do pattern searches in DNA sequence snippets. If anyone would be able to direct me to the correct "group"/sub-community, I would appreciate it. Please and thank you!
silk cedar
Thanks again @jolly briar I will try and get that working
jolly briar
@silk cedar np - sounds like a merge is what you're after tho
pandas docs are nice btw - esp the new ones - check out the getting started and user guide
merry portal
Given a mask, how do I know what the positions of the true values are? Feels trivial but haven't been able to find efficient solution
Like to print out. Double for loop is not terrible runtime (under one min), but feels wrong
velvet thorn
what kind of mask do you mean
ripe forge
If you're ever looping when it comes to pandas or numpy, there's probably a better way
 vale fog
lapis sequoia
vale fog
lapis sequoia
I want to work on model that can detect subject,object,verb etc in a sentence.Where can i find the dataset or where can i scrap the raw data
lapis sequoia
In that case the problem is that i need to label it myself which would take so much time for creating huge dataset
merry portal
@velvet thorn @ripe forge: (my_matrix > 5) -> I want the index/column of each true occurance
Instead of giant matrix full of true/false
ripe forge
well, it gives what it's supposed to give. the question should be, how to get what you want
without knowing more about what you're doing, take a look at np.where
merry portal
   aa bb cc
a  1   2 3
b  5   1 5
c  5   5 5
so from m < 5 I would want something like [(a,aa), (a,bb), (a,cc), (b,bb)]
Which is not what np.where returns. My understand is np.where is conditional replacement of values
lapis sequoia
Hey guys, does anyone have some tips on how to optimize randomforest regressions most effectively? random gridsearch? gridsearchcv? a combination thereof? I know how to do those, but I'm an absolute beginner in terms of randomforests... i only did a parameter grid test for n_estimatorsand max_features and the results are rather unsatisfactory. Thanks
lapis sequoia
Does anyone know what values I should use to replace NaN in a column of averages?
The data I have puts NaN if there is no prior data to calculate the average
Need it for a NN btw
 chrome rampart
Hello, would you recommend learning another language next to Python like Java? And should I learn about algorithms and computer science before getting into Data science (AI)?
 slim elm
Do you know any programming language pyro?
Does anyone know what values I should use to replace NaN in a column of averages?
@lapis sequoia
Does anyone know what values I should use to replace NaN in a column of averages?
@lapis sequoia Hey deusex, if you are using pandas and this is a pandas data frame you can use the .fillna() method to replace all NaN values with what every you specify inside the tuple.
chrome rampart
@slim elm yes, I know python and I'm learning pandas
lapis sequoia
If you are learning python, finish learning that one first.
Would be better to start from compsci and algorithms though @chrome rampart
lapis sequoia
lol you can't learn compsci in days