#data-science-and-ml
1 messages · Page 217 of 1
 velvet thorn
@lapis sequoia did you do it in the right environment?
you ran pip install scikit-learn --upgrade?
 lapis sequoia
conda update scikit-learn
velvet thorn
try using pip
 hasty maple
ah I thought gm's avatar was familiar, I've seen it @ Ed Sheeran & Passenger - No Diggity vs. Thrift Shop (Kygo Remix)
velvet thorn
are you serious
I Googled "california hipster skater girl"
and just took a random pic
 misty lake
I have posted a question here looking for a valid suggestions . Please tag me if you could help. Thanks
https://datascience.stackexchange.com/questions/67460/building-a-search-tool-and-classifying-text-using-nlp-and-ml

Data Science Stack Exchange
Im a newbie in information Retrieval. Currently Im reading a book entitled " An Introduction to Information Retreival" by Christopher D. Manning and Prabhakar Raghavan. Im trying to implement an ai...
lapis sequoia
why is it that jupyter lab is sooooooooooooooooo much slower than the good ol' notebook?
lapis sequoia
Jupyter Notebook runs dependent cells, and saves the code in the back. That takes resources. However i like using the jupyter Notebook style but not on my computer. I recommend Google Colaboratory
 olive prairie
Hey! This is related to multiprocessing too - has anyone here used Ray??
I spent the weekend rewriting this textual analysis code I have to make it capable of taking in larger datasets - had a bottleneck on calculating pairwise cosine distances for a bunch of different fields and now it's working, but I'd love to get more CPUs working on it/ make it faster
 uncut shadow
Hello! I don't quite understand forward propagation between Dense layers in NN. I know that layers before take input (let's assume it's x), multiply it by weights and add bias. So something like this y = xw + b and then apply activation function (for example sigmoid) z = sigmoid(y). But how does this work with Dense layers? Like, I still do y = zw + b and use activ. function. I don't understand the model of those layers in an image (this one is made by me lol, but afaik they look like that), because if you look at it closely If you forward propagate just by multiplying output from the previous layer by weights and add bias it shouldn't work
uncut shadow
I have another question. What are activation functions for? I mean, what do they do and does anybody know any good article showing How they work and make Ur network non-linear?
 silent swan
when you compose linear functions (take the output of a linear function, and feed it to another linear function), the overall function is still linear
the purpose of activation functions is to break that linearity, which allows you to express non-linear functions
the choice of what activation function to use varies from arbitrary reasons, to you explicitly need your function output to be in a certain range (e.g. positive, or between 0 and 1)
 crimson umbra

Medium
Here’s a list of the best servers on Discord for Data Science
 gentle depot
Hello, I would appreciate your help with this.
I need to merge several dataframes with different datetime indexes, but the outer merge I try to do warns me I need 250GB ram which I obviously don't have and something on the code is just wrong.
A simpler way to do it (not the initial approach i spoke before) I came with is as follows:
- Take all the datetime indexes of the dataframes and append them together in a single list or series.
- Drop duplicates, if any, of that list/series and set it to the index of an empty dataframe
- Use a reduce() and a lambda function to merge together the 'big', empty dataframe with the others
The problem is that I can't seem to make the reduce() and the lambda work for the first step. The code I'm trying to do is as follows:
final_list = functools.reduce(lambda a,b: a.index.append(b.index), [df1, df2, df3, df4, df5])
The result I am trying to get from the first step is equivalent to what I can get after this:
`i1=df1.index
i2=df2.index
i3=df3.index
i4=df4.index
i5=df5.index
#step 2 would be this
i6=pd.DataFrame(i1.append([i2, i3, i4, i5]).unique().sort_values()).set_index(0)`
gentle depot
I found a solution but i just turned off the pc
I'll try to type by memory
final_list = functools.reduce(lambda a,b: a.append(b.index), [df1.index, df2, df3, df4, df5])```
This takes care of the step 1, not so elegant but works hybrid scroll
Guys, this is my feature importance via importance permutation. work_experience is number 2
This is the correlation.. The worst correlation value to Labels is birth_city and work_experience
why it can be the opposite/different?
 undone shard
Going to compute a weather-like stuff, but it's a toy because Python isn't for fixed-point DSP. Dunno where to post.
🙂
lapis sequoia
How can i add '<class 'fastai.core.MultiCategory'>'; to a dataframe?
undone shard
I have a few terms but more terms will be in as the simulation becomes more nonlinear, and I am multithreading it, phew. Soon I might use my Radeon VII to do a lot of heavy lifting using PyOpenCL, the GPU is better than the CPU especially when you have HBM to mess with.
lapis sequoia
quick question:
how can I insert one single row between 2 specific rows in pandas?
0    THE    1
1    TNUF    1
2    TGT    1
3    TEHN    1
4    THUB    1
5    TBO    1
6    TGOL    1
7    TSRO    1
8    TSV    1
9    TSOS    1
10    TSUN    1
11    TSS    1
12    TSFS    1
13    TSMI    1
14    TS T    1
15    TSC    1
16    TSNS    1
17    TSU    1
18    TSOM    1
19    TEME    1
20    TE    1
21    TOES    1
22    TEZL    1
23    TACH    1
24    TP    1
25    TWER    1
26    TWD    1
27    TKTO    1
28 TKT 1```Let's say I'd want to add a row between 14 and 15, with "DS100"="TS" and "Line"=1
 solid heart
You can try splicing the dataframe at 14th position and concat the row and the remaining dataframe with the [0-14] size dataframe.
lapis sequoia
right, that definitely solves the problem. thanks
solid heart
😄
lapis sequoia
i assume there is no "neater" way? ^^
sometimes you gotta give credit to excel, lol
"insert row here", done.
lapis sequoia
yeah it's a weird problem
though i could pivot table it, then insert it and pivot it back
lol
is it possible to add to a list?
at specific place in that list
solid heart
as in ?
lapis sequoia

We often get into a situation where we want to add a new row or column to a dataframe after creating it. A quick and dirty solution which all of us have tried atleast once while working with pandas is re-creating the entire dataframe once again by adding that new row or colum...
this is helpful
solid heart
Didnt know index = 0.5 was a thing :p
lapis sequoia
Can u Send memes here?
 slim fox
defo not in this channel @lapis sequoia
 supple grove
@lapis sequoia whats funny bout that is i dont even get my own old code
 deft harbor
There has to be a better way to do this. When I need to graph multiple features as a group, I try to have them grouped in a 3 x 3 using plt.subplots. However, it is a pain to generate.
axes = [(0,0), (0,1), (0,2),
    (1,0), (1,1), (1,2),
    (2,0), (2,1), (2,2)]

fig, ax = plt.subplots(3, 3)

for r, c in axes:
  ax[r][c].plot(something amazing)
Any idea on how to do this in a better way?
The above doesn't look so bad, but if I have 20 features I need to graph, or worse iterate over an object containing them.. it gets a little dirty.
silent swan
fig, axes = plt.subplots(3, 3)
for ax in axes.reshape(-1):
  ax.plot(blurgh)
I knew I was missing something
 oblique belfry
I’d personally create a pandas data frame then save that to csv.
 uncut turret
Hey all, hoping someone call help me. The matplotlib Hist() documentation says the following regarding their bins:
The edges of the bins. Length nbins + 1 (nbins left edges and right edge of last bin).
I dont quite understand what that means.
The following is what returns from my call to get the bins (n, bins, patches) = plt.hist(test,50)
2.90366500e+06 5.00645592e+08 9.98387518e+08 1.49612945e+09
 1.99387137e+09 2.49161330e+09 2.98935523e+09 3.48709715e+09
 3.98483908e+09 4.48258101e+09 4.98032293e+09 5.47806486e+09
 5.97580679e+09 6.47354871e+09 6.97129064e+09 7.46903257e+09
 7.96677449e+09 8.46451642e+09 8.96225835e+09 9.46000027e+09
 9.95774220e+09 1.04554841e+10 1.09532261e+10 1.14509680e+10
 1.19487099e+10 1.24464518e+10 1.29441938e+10 1.34419357e+10
 1.39396776e+10 1.44374195e+10 1.49351615e+10 1.54329034e+10
 1.59306453e+10 1.64283872e+10 1.69261292e+10 1.74238711e+10
 1.79216130e+10 1.84193550e+10 1.89170969e+10 1.94148388e+10
 1.99125807e+10 2.04103227e+10 2.09080646e+10 2.14058065e+10
 2.19035484e+10 2.24012904e+10 2.28990323e+10 2.33967742e+10
 2.38945161e+10 2.43922581e+10 2.48900000e+10
Are these the complete set of bins, as in Bin 1 = 2.90366500e+06 - 5.00645592e+08
Or something else
The context here is that I need to take these bins, and do a count of a binary column I have based on the value of a column that falls between a given bin. So, conceptually: for all Column.Values between bin1_start and bin1_end count().
But I can't quite get there since I can't figure out how the bins work in hist()
velvet thorn
@deft harbor axes.flat would be slightly more efficient
(I hope)
@uncut turret you can pass your own bins too
if that’s easier to understand
 drowsy grove
Hello everyone, I'm not sure this is the right channel for this generic question, but here goes:
Is there anyway to utilize machine learning to tell if 2 or multiple video files are identical.
Filenames may be different. I'm trying to come up with a strategy for a personal project: my family have many video files on the hard-drive, videos shot by cellphones or VCR and whatnot.
Backups may have been made several times but not sure at this point. Of course we can watch each one, toggle around and do a rough checkup. I'm just wondering if there is a better and more efficient way, through which I can also learn something.
Thanks.
 manic mason
Are they byte-for-byte identical copies of each other?
Like if you just make a copy of a file and rename it, it will be identical
velvet thorn
@drowsy grove yeah, you need a bit more info
if they are totally identical, just hash and compare
if they are identical up to different metadata, same thing for the video data
if they have roughly the same human-understandable content but differ in e.g. resolution/quality
you probably need machine learning for that, but I'm pretty sure it'd be quite trivial
drowsy grove
Thanks for the responses guys. Yep I see where I should have clarified on
@manic mason Probably, what if the videos are converted to a different format? I may have done something like for my old videos I got in college in order to play on some mobile devices.
@velvet thorn Very good point. I don't think anything has been done to the metadata.
manic mason
If you did any kind of conversion, then they won't be identical copies
I would open up a few of the videos, and see if the metadata is the same. You could use that to find duplicates
drowsy grove
Since my knowledge on this is next to zero, I need to ask this: is the metadata automatically created with the video or is that manually updated?
drowsy grove
Hmm, good point. Usually recorded by phone or camcorder.
I happen to have that.
@velvet thorn Very thorough analyzing angles. I should've thought of those. Will bear in mind. Any tips for the machine learning process?
velvet thorn
different format can be a bit twitchy
drowsy grove
I imagine you can't possibly compare each frame.
velvet thorn
because it is in general not guaranteed that
conversion one way and back
will give you the original
drowsy grove
Can you check like certain frames to tell if they are good enough?
velvet thorn
uh...yeah, that's kind of what you do
frame-by-frame comparison
with the right network
it will be fast
no need for the whole video
just sample part of it
drowsy grove
Shit. Oh really? I thought it would take forever
velvet thorn
of course
there are other challenges
such as alignment
e.g. if one video is 60 FPs and the other is 30 FPS
and you take the 100th frame from both
it'll be a different frame.
drowsy grove
Very good point
velvet thorn
this is one of those things where the actual problem (comparing two sets of images) is easy
it's all the infrastructure surrounding it that is hard
drowsy grove
Just so I'm understanding correctly: if the videos are compressed to different formats, then the frames may not correspond correctly right?
I see. Good point.
velvet thorn
that's one thing
but that aside
the point is that because of different encodings
you can't compare them as files
because the binary content is different
you need to compare them as videos (in the sense of their semantic content), which requires machine learning
does that make sense?
drowsy grove
It does
And when you compare videos, what actually happens is all the frames are compared?
drowsy grove
Can a 30fps video be compressed to 60fps and still remain the same length?
velvet thorn
of course, that might take a while, especially if you're not using a GPU
drowsy grove
I'm so naive. Go on
velvet thorn
no, it's the other way round
FPS means frames per second
in simple terms, how many still images are played on the screen every second
so 60 FPS means one second of video comprises 60 images
which would take more space than a 30 FPS video
therefore compression would go from 60 FPS to 30 FPS
but that is not really what I was thinking of when I said "compression"
the most basic format for storing a video is as a series of images.
that is very memory-unfriendly
so many "video encodings" have been develope
d
these are ways of compressing videos such that they take less space
for example, you might record only the differences between successive images
drowsy grove
I thought it's the only way of doing it. Ah I see.
velvet thorn
and the intuition, of course, is that frames tend not to change "too much"
drowsy grove
I thought they wouldn't change at all.
Is the total number of frames for a video fixed?
velvet thorn
well...
no
when I say "change too much"
I mean
imagine a movie
the camera is fixed
but actors move around in it
the background pixels will not change, right?
therefore we don't need to record them more than once
only the parts that change when people move.
as for total number of frames
remember that one frame is, effectively, a still image that is part of the video
in general, what stays static is the video length
the number of frames making up the video can change.
drowsy grove
Holy cow, that's a game changer for me.
Suddenly the FPS number in games makes sense to me.
Higher FPS seems smoother because there is less change between frames? Am I still not getting it?
velvet thorn
hm
well
yes, that's one reason
but not only that
when you look around you
you see your vision changes "smoothly" because what you see updates many times a second
drowsy grove
That's right.
velvet thorn
if what you see on a screen updates 5 times a second
it looks choppy.
regardless of how much change there is
per update.
drowsy grove
I see.
Lemme try to digest and write these down: so a 60fps video has so many frames in one second that it consumes a lot of memory and thus can be compressed.
Into 30 fps for instance. And the total length of the video stays the same.
So when such compression is done, there are fewer frames therefore consuming less space. But the video will choppier as a result.
Am I following this correctly?
 real wigeon
any good resources on time series forecasting
velvet thorn
@drowsy grove yes, that's one example.
but as I said, there are also methods of compression that work on the content itself
e.g. decreasing how much memory is used to store colour data
drowsy grove
@velvet thorn Thanks. So there are actually ways to compress a video without losing many frames (quality) and yet decrease the memory?
Suddenly I'm reminded of Piped Piper.
velvet thorn
hm
no, I think you're looking at it the wrong way.
FPS is just one aspect of quality
for example
wouldn't you agree that a video in colour is higher quality than one in monochrome?
drowsy grove
Good point.
Resolution also
Thanks. So back to what you said about the problem: you mentioned the problem is easy (comparing videos), but the infrastructure surrounding it is hard. Could you elaborate a bit on what you mean by infrastructure please?
Like picking the right model or threshold for similarity definition? Sorry, just spitballing here.
drowsy grove
I see.
You mentioned that a lot of pixels between the frames are the same. Is it possible to compare frame differences rather than frames?
drowsy grove
Thank you. So directly comparing can be pretty effective if implemented right. I thought it would take forever due to filesize (100MB to 1GB).
Sometimes pandas takes a minute to do some operation on a 10MB file of mine.
velvet thorn
what operation is that
sounds like you're doing something wrong
I bet there's either an apply or for in there
...or you have a computer from 2005
 opaque stratus
 marble tundra
!warn 476735278627946497 Don't dump memes in this server, certainly don't dump memes in help channels.
 arctic wedgeBOT
:incoming_envelope: :ok_hand: applied warning to @tardy plover.
 tardy plover
lapis sequoia
tardy plover
lapis sequoia
This is not a very good result, is it?
 shut kraken
not sure if this is the proper chat for this sort of thing, but if i want to 'interpolate' a data set but to a transformed distribution, how would i do that?
is there an algorithm for it?
like, say for example, i have a frequency spectrum fresh out of a fourier transform, and i want to interpolate it such that there is an equal number of datapoints between every pair of frequences where one is twice the frequency of the other (ie an octave)
so far my plan was to massively upsize it then just pick samples to downsize it, but its occurring to me that it wont be necessarily as easy to downsize it further again into a frequency spectrum i can throw into FFT to get out a sample set about as big as i want
if this isn't the proper chat for this, where should i go?
lapis sequoia
you'll have to simplify your question further..
I don't want to think in terms of DSP
Consider phrasing as: 1. what datapoints you have 2. what you want to do
there's interpolate methods in scipy and numpy
but, would help to understand what you want to do
shut kraken
basically i want to be able to interpolate with varying "datapoint densities" across a set of data
uncut turret
Hey guys, trying this question a different way.
I have a dataframe of two columns:
Revenue | Class
Class is a binary classifier.
What I'd like to do is create a histogram that contains the count of instances of 1 in my Class for particular revenue ranges.
So bins are ranges of Revenue, and frequency is count of instances of class 1.
I cannot figure out how to accomplish this, any help would be greatly appreciated.
What I've tried so far:
Use hist() to generate some bins for me. Take those bins and use between() on my dataframe to count instances of Class 1. Then, pass the resulting series (count of class 1) into hist(), and the bins as the bin parameter. I get nothing.
velvet thorn
groupby pd.cut
df.groupby(pd.cut(df['revenue'], 20))['class'].sum()
I'm assuming the other value of class is 0
change variable/column names as necessary
20 is the number of bins
@uncut turret
uncut turret
Trying now, so many thanks simply for providing something to try
Ok, so that part is wonderfully simple. How do I take that output and pass into hist()
uncut turret
This is perfect, needs some tweaking but now I know where I'm actually starting. Thank you so much.
velvet thorn
yw
 latent oyster
How can you combine KerasClassifier and GridSearchCV in python to where you both pass a variable into the function and provide a list of parameters to search over for the CV?
 coral yoke
what are you trying to do again @latent oyster? i don't know what variable into a function you're referring to or what you're trying to do
unless you're hard-set on using keras for whatever reason, just use sklearn instead
 lofty fjord
@latent oyster def build_classifier(optimizer, units): classifier = Sequential() classifier.add(Dense(units, kernel_initializer='uniform', activation='relu', input_dim=10)) classifier.add(Dropout(0.1)) classifier.add(Dense(units, kernel_initializer='uniform', activation='relu')) classifier.add(Dropout(0.2)) classifier.add(Dense(1, kernel_initializer='uniform', activation='sigmoid')) classifier.compile(optimizer=optimizer,loss='binary_crossentropy', metrics=['accuracy']) return classifier classifier = KerasClassifier(build_fn=build_classifier) parameters = { 'batch_size': [10, 25, 32, 100], 'nb_epoch': [100, 500], 'optimizer': ['adam', 'rmsprop'], 'units': [6,12] } grid_search = GridSearchCV(classifier, param_grid=parameters, scoring="accuracy", cv=10, n_jobs=-1)
you can grid search any parameters that you pass into build_classifier as arguments
coral yoke
though instead of using that i would suggest just using the in-house KerasTuner library
 jolly briar
has anyone worked with geographic data? I'm trying to find something that will enable me to infer administrative regions from polish postcodes
lapis sequoia
@jolly briar what do you mean? plotting with geographical data? I've done a bit of that
jolly briar
no not plotting
given a postcode return the regions that it's within
geo-code api is expensive
lapis sequoia
@all is there a quick way to sort categories_ after using OneHotEncoder()? They're sorted alphabetically, but for the output of interpretation it's super weird when they are sorted like 'Monday', 'Saturday', 'Sunday', 'Thursday', 'Tuesday',
'Wednesday'
lapis sequoia
@jolly briar are you working on a dataset? or is it some realtime script or something?
I bet there is a list of the postalcodes and regions to be found somewhere on the net, right?
So if you're working on a dataset I guess i'd just make that a dataframe and use it as benchmark. You could then merge on the postal code of any order or whatever you're working with, and thus get the region for it
jolly briar
I bet there is a list of the postalcodes and regions to be found somewhere on the net, right?
not easily found
lapis sequoia
@slim fox true, but I think that'd be more work than just have the OHE do a fixed sort... i'm sure there will be an attribute command or something
@jolly briar you kidding? https://en.wikipedia.org/wiki/List_of_postal_codes_in_Poland

The Postal codes in Poland consists of 5 numbers in the following format xy-zzz.
First digit in the postal code represents the postal district, second digit major geographical subdivision of this district, and the three digits after dash: the post office, or in case of large ...
jolly briar
@lapis sequoia i've used geopandas and stuff before, I'm not asking because i'm not aware of dataframes or wikipedia
lapis sequoia
well.. you said not easily found, but it obviously is
jolly briar
ok
lapis sequoia
since i don't know what you're actually doing, that was just a proposal... not saying it's the smartest way, it's just a way.
lapis sequoia
@velvet thorn btw conda update did work (i just had to restart the notebook after), OHE() drop=first works like a charm since update
lapis sequoia
mhh... is there a way to check categories_ if multiple categorical variables are fed into a pipeline? when the pipeline has finished, i can't call X_prep.categories_
i know that it is possible if you do every feature separately, but with more categorical features and many values per category that's not very neat
lapis sequoia
has nobody ever had the same problem? that the dataframe was changed to an array by running it through your pipeline and as a result all the features are only unidentifiable numbers anymore? there has to be a trick of some sort... no?!?
because if different transformations are made to float, int, ordinal and dummy variables, that gets quite complicated and intransparent...
lapis sequoia
can anyone help with really high Omnibus and Prob(Omnibus)=0.000 values with a statsmodels - OLS model ?
 solar torrent
Hey guys - I'm trying to map a new column using panda's pd.map() - I posted in SO here (https://stackoverflow.com/questions/60085020/mapping-new-values-based-on-unique-values-in-a-dataframe) if anyone has a minute to take a look. Or feel free to answer here in Discord (just @ me)

Stack Overflow
After doing an analysis, I'm trying to simplify the number of values in a given field ("SRU") by mapping them from another field ("NewBook") to a new column in the data frame. I need to keep the ex...
velvet thorn
yeah...if it hadn’t I would have been scared
 odd ruin
guys, im kinda new here, and was wondering, must I be really good at math to be able to learn machine learning and data science? or a person with no math background can do it, just a little bit more effort than the one that does?
i need to know what imgoing to face later on
lapis sequoia
you can learn, but you won't get far without maths
velvet thorn
I didn't have a math background
it's not really that difficult, you just need to focus and be willing to learn
without math you'll probably be more suited to being a software engineer or, at most, an ML engineer (and even that will be difficult)
lapis sequoia
hey man
what do you do
looks like you write scala.. how long did that take you to learn..
velvet thorn
about a month to start writing production code...startup life
@ that time I was a data scientist, but now I'm an instructor @ a bootcamp
like I'm not a Scala expert or anything (I don't have experience with, say, Akka, or cats)
I just knew enough to be able to productionise our ML stuff (so mostly Spark and Hadoop)
jolly briar
@velvet thorn when you say "didn't have a math background" what do you mean? because when people say they have no math they often mean that they literally have no maths beyond basic addition. Whereas some people can respond assuming that no math is equivalent to high school maths, which in the UK translates to A-Level (A Level is the same as US HS I think), and that's not straightforward. I think the AP exams are similar in the US
velvet thorn
when I say "no math background" I mean nothing beyond compulsory education (though of course that varies from country to country)
in mine, that was basic calculus, linear algebra, statistics, etc.
jolly briar
ok fair - i would think that's more than a lot of people consider when they say no math background
velvet thorn
(also separated from me starting coding about 6-7 years)
jolly briar
a lot of people literally mean zero 😄 , well, beyond basic addition
velvet thorn
but I'm not really sure about the extent of compulsory education in other countries so
that didn't really occur to me
although I will say
for people from my country
on stuff like the SAT
the math section is a lot easier than the others
jolly briar
yeah - i know i'm being pedantic, but i kinda self taught (ended up going through uni later as a result) and it's something I found a lot of issues with online when learning
velvet thorn
like 5-6 years of experience difference
no, it is a good thing to bring up
I didn't really think about the different systems in other countries
jolly briar
like people would say "it's just basic HS math" to me, and I'd be sweating as I didn't have a clue about calc, or trig, etc 🙃
velvet thorn
yup, fair enough
I had that experience with programming stuff (computer science) too
it was nice though because at least I found something that I didn't know I didn't know before
jolly briar
@velvet thorn you did a cs degree then ?
lapis sequoia
Hey guys, has someone ever done a multilabel bidirectional text classification?
Can you help me there?
velvet thorn
nope, law degree
I only got into coding a bit over a year ago
@lapis sequoia what do you mean by "bidirectional classification"
do you mean "using a bidirectional network"?
jolly briar
@velvet thorn oh nice - have you ever looked at "legal technologist" stuff? I thought that seemed interesting, and there's loads of nlp in compliance as well
jolly briar
ha
velvet thorn
which is backend work, frontend work, ML engineering, data science, random programming.
touching law is slightly above working in Java in my book right now
jolly briar
you must have had a good opportunity for learning if you hadn't coded until a year ago
jolly briar
i mean that if you're proficient in a year that is unusual, so it was probably coupled with a good opportunity for learning
jolly briar
sure, you still need time and space
i would bet every single time that most people couldn't learn that in a year in employment etc
velvet thorn
probably the case
I think I just found it really fun
I was always exploring new stuff
jolly briar
sure, still - time and space
no amount of enthusiasm can be a sub for those as they're necessary
jolly briar
yea, which is why i find online suggestions often frustrating
telling people they can "if they try hard enough" is just lazy imo, because there's a good chance they can't
velvet thorn
yeah, I don't really say that
...or I kinda did
well.
🤷♂️
probably my perspective is pretty warped
but that's why I'm in education now
jolly briar
@velvet thorn no sorry - that's not directed at anyone here, though it's good to keep in mind
velvet thorn
hopefully I can bring good things to more people
jolly briar
just a backlog of personal frustrations from learning online 😛
"use spivak" is the gentoo of people learning calculus lol
or rudin
pff
velvet thorn
yeah, it’s definitely not easy
especially now that I’m learning frontend stuff there is a ton of things people take for granted that I don’t know because I’m learning from scratch without anyone to teach me
lapis sequoia
@velvet thorn me too :p it was tough getting into things without any idea how to approach the coding, where to start, how to structure, etc... but everything is starting to come together at some point
i gotta say though, this chat is lucky to have you.
velvet thorn
thank you 🙇♂️
 steady leaf
anyone have experience using facebook's prophet?
 kindred radish
anyone here know about the direct Monte Carlo method? I've got a problem in my very simple code and ive no idea wtf is wrong with it
 austere oar
Is there a way to count data from a csv in flask?
velvet thorn
@kindred radish just ask your question, it’s more efficient.
@austere oar elaborate?
jolly briar
i have a columns with data as
x. foo
y. bar
y. bar2
y. foo2
baz
foo3
x. bar3
i want to strip the x., y. but create a vector that classifies them, so i would have a vector as
x
y
neither
corresponding to the relevant prefixes.
stripping is fine, but i'm not sure how to classify without creating a separate function
velvet thorn
that’s text?
jolly briar
🤔 it's text yes
kindred radish
I think i actually managed to solve it ^^
jolly briar
that'll give me a list of lists, then i could maybe split that into two
jolly briar
def classify(col):
    x = pd.Series(["" for _ in col])
    x[~col.str.contains("^x\.|^y\.")] = "neither"
    x[col.str.contains("^x\.")] = "type_x"
    x[col.str.contains("^y\.")] = "type_y"
    return x
 bronze grove
So im having an issue with mpl and general python math
    @commands.command(name="datalimit", aliases=['datacap', 'cap', 'uploadlimit', 'uploadcap', 'data', 'free'])
    async def see_data(self, ctx):
        """Shows you your used and free data limit (banners). See https://docs.dragdev.xyz/bumpr/v2/datacap for more info"""
        stuff = free_used_data(ctx)
        if ctx.channel.permissions_for(ctx.me).attach_files:
            labels = ["used", "free", "max"]
            fig = plt.figure()
            ax = fig.add_axes([0, 0, 1, 1])
            ax.axis('equal')
            ax.pie(stuff, labels=labels, autopct='%1.2f%%')
            plt.savefig("./nerd.png", edgecolor='gray', facecolor='gray')
            file = discord.File("./nerd.png")
        else:
            file = None
        used_percent = percent(stuff[2], stuff[0])
        free_percent = percent(stuff[2], stuff[1])
        max_percent = percent(40, stuff[2])
        msg = f"**Used:** {stuff[0]}mb ({used_percent}%)\n**Free:** {stuff[1]}mb ({free_percent}%)\n**Max:** {stuff[2]}" \
              f"mb ({max_percent}%)"
        await ctx.send(msg, file=file)
        if file:
            # cleanup
            os.remove("./nerd.png")
stuff[0] is 5.39
stuff[1] is 39 (the anomoly)
stuff[2] is 10
As you can see, it should generate the percent out of 10 for stuff[0:1]. However, it still says stuff[1] is 39. Am i doing something wrong here?
velvet thorn
I mean there is a better way
bronze grove
https://i.imgur.com/Qh3nBXL.png this is the output
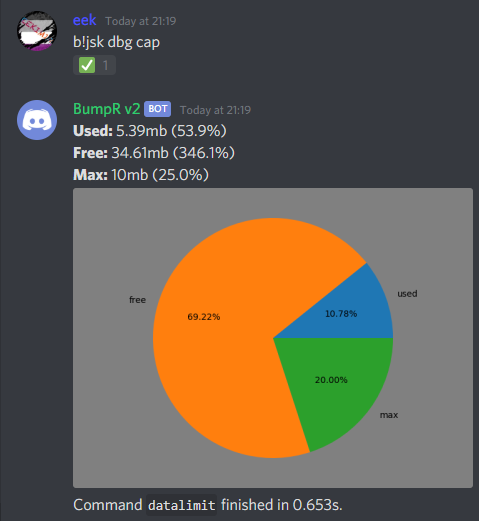

oh and param 1 of percent() is out of, so it should be out of 10
oh ignore me
im really fricking thick
didnt think to check if it was the free_used... func
bronze grove
not having a problem in the first place is even more helpful 
jolly briar
i don't think extractall will work here actually 🤔
In [217]: x
Out[217]:
0     x. this
1    tz. that
2       there
dtype: object

In [218]: x.str.extractall(r'^([a-z]+\.)')
Out[218]:
           0
  match
0 0       x.
1 0      tz.
for example
maybe it's just a naff regex
velvet thorn
well, you’re only extracting one group...
jolly briar
yea - naming and stuff still seems tricky
In [238]: v
Out[238]:
0     a. foo0
1        foo1
2     a. foo2
3    bc. foo3
4     a. foo4
dtype: object

In [239]: v.str.extractall(r'^(a\.)|^(bc\.)|(^[^bc\.])')
Out[239]:
           0    1    2
  match
0 0       a.  NaN  NaN
1 0      NaN  NaN    f
2 0       a.  NaN  NaN
3 0      NaN  bc.  NaN
4 0       a.  NaN  NaN
v.str.extractall(r'^(a\.)|^(bc\.)|(^[^bc\.])').fillna('').agg(''.join,axis=1)
idk if this is any better than the function at this point 🙃
i guess it's a bit more pandasish
actually that doesn't work
i don't think it can work - because how to make a regex group match on nothing?
see col 2 above, has 'f', don't want f tho
hrm, ok i just use the original function lol
velvet thorn
oh wait I forgot the optional
okay got it
>>> s
0     a. f0
1        f1
2     a. f2
3    bc. f3
4     a. f4
dtype: object
>>> s.str.extractall(r'(.+)?(?(1)\. )(.+)')
           0   1
  match
0 0        a  f0
1 0      NaN  f1
2 0        a  f2
3 0       bc  f3
4 0        a  f4
I must say I haven't done regexes in a while
that was harder than expected
jolly briar
@velvet thorn i'm not too sure what you've got here - how has this created a vector of classifications?
or am i missing something
 warped tangle
anyone have experience with GANs
austere oar
@velvet thorn Oh I was planning to use mongodb and chart.js and pass both to an index.html
but I'd probably need to count the number of times (condition on time that you read from a csv)
lapis sequoia
Is 100 gb/hrs much for a node server handling requests?
drowsy grove
@velvet thorn Just saw your messages above. You learned all these with just one year? Bravo! From what I have seen just based on the help you gave me, you are quite familiar with pandas. I thought you have a CS degree.
@velvet thorn Why did you totally pivot your career? You found that coding is much more fun than law? I came from geology.
But it's really easy to find things more interesting than geology IMO.
velvet thorn
@jolly briar maybe I misunderstood what you wanted
@drowsy grove money and fulfilment, basically
oh, and work-life balance
jolly briar
@velvet thorn classify
Idk how what you've done classifies them
I just use a function tho it's fine
 rocky maple
So, anybody know Keras well?
# Encoder and Decoder are other Models being used as Layers
encode_decode_in = Input(i_shape)
encode_decode_out = decoder(encoder(encode_decode_in))
encode_decode = Model(inputs=encode_decode_in, \
    outputs=[encode_decode_out, encode_decode_in], \
        name='Encode_Decode')

def encode_decode_loss(y_true, y_pred):
    return mean_squared_error(y_pred[0], y_pred[1])

encode_decode.add_loss(encode_decode_loss)

encode_decode.compile(optimizer='adam') # ERROR
I'm doing something fundamentally wrong here. What is it?
drowsy grove
@velvet thorn Good answer. I didn't know coding pays more than law
rocky maple
I'll actually just drag/drop my whole notebook
arctic wedgeBOT
Hey @rocky maple!
It looks like you tried to attach a file type that we do not allow. We currently allow the following file types: .3gp, .3g2, .avi, .bmp, .gif, .h264, .jpg, .jpeg, .m4v, .mkv, .mov, .mp4, .mpeg, .mpg, .png, .tiff, .wmv, .svg, .psd, .ai, .aep, .xcf, .mp3, .wav, .ogg, .md.
Feel free to ask in #community-meta if you think this is a mistake.
 kindred abyss
Hi guys, Is there anyone here knows a good pandas tutorial site? TIA
rocky maple
So, I finally got that problem resolved.
Now, onto the next issue. What should my fit() function end up looking like?
Here's everything I have so far.
# Now combine the encoder and the decoder models into one model.
from keras.layers import GaussianNoise

# combined_input_layer will branch automatically.
combined_input_layer = Input(shape=i_shape)
noised_input = GaussianNoise(0.1, name='noise')(combined_input_layer)

# Compress input and noised input to latent space, and hold on to a reference.
vec1 = encoder(combined_input_layer)
vec2 = encoder(noised_input)

# Decode the original image from the latent space
unencoded_original = decoder(vec1)

combined_model = Model( \
    inputs=combined_input_layer, \
    outputs=[vec1, vec2, combined_input_layer, unencoded_original])
# Define loss and compile

# y_true is what is passed to the fit() method, which we aren't actually using.
# Those quantities will be unknown, this is unsupervised.
# y_pred is the output of the model.
distance_weight = 1
mse_weight = 1
def total_loss(y_true, y_pred):
    dist = (K.sqrt(K.sum(K.square(y_pred[0] - y_pred[1]), axis=-1)))
    mse = (K.mean(K.square(y_pred[2] - y_pred[3]), axis=-1))
    return (distance_weight * dist) + (mse_weight*mse)

combined_model.compile(optimizer='adam', loss=total_loss)
# build dataset
from keras.datasets import cifar100
(x_train, y_train), (x_test, y_test) = cifar100.load_data(label_mode='coarse')
# Fit model
combined_model.fit(x_train, None, validation_data=(x_test, None), epochs=10, batch_size=32, shuffle=True)
And then when I try to fit the model this yeilds:
Train on 50000 samples, validate on 10000 samples
---------------------------------------------------------------------------
IndexError                                Traceback (most recent call last)
<ipython-input-69-5a72cae75cc7> in <module>
      1 # Fit model
----> 2 combined_model.fit(x_train, None, validation_data=(x_test, None), epochs=10, batch_size=32, shuffle=True)

~\Anaconda3\lib\site-packages\keras\engine\training.py in fit(self, x, y, batch_size, epochs, verbose, callbacks, validation_split, validation_data, shuffle, class_weight, sample_weight, initial_epoch, steps_per_epoch, validation_steps, validation_freq, max_queue_size, workers, use_multiprocessing, **kwargs)
   1237                                         steps_per_epoch=steps_per_epoch,
   1238                                         validation_steps=validation_steps,
-> 1239                                         validation_freq=validation_freq)
   1240
   1241     def evaluate(self,

~\Anaconda3\lib\site-packages\keras\engine\training_arrays.py in fit_loop(model, fit_function, fit_inputs, out_labels, batch_size, epochs, verbose, callbacks, val_function, val_inputs, shuffle, initial_epoch, steps_per_epoch, validation_steps, validation_freq)
    139     indices_for_conversion_to_dense = []
    140     for i in range(len(feed)):
--> 141         if issparse(fit_inputs[i]) and not K.is_sparse(feed[i]):
    142             indices_for_conversion_to_dense.append(i)
    143

IndexError: list index out of range
This is the absolute last error that I have to resolve before this thing starts working. I think. I hope.
lapis sequoia
why are you passing None in fit
kindred abyss
Hi guys, Is there anyone here knows a good pandas tutorial site? TIA
lapis sequoia
I can teach you pandas quick if you want
 alpine tiger
Is there any one here who is competent on h5py, or hdf5 in general, VDS?
 small ore
@kindred abyss Data School on YT
 wise cypress
Any good way to store tines series data?
wise cypress
Yeah i could have done that. Shit, i was just overthinking.
Thanks man
coral yoke
👌
rocky maple
I'm passing None in fit because there are no labels, it's unsupervised.
coral yoke
the error is because you're passing it None
found a decent article that may help you: https://www.dlology.com/blog/how-to-do-unsupervised-clustering-with-keras/
You will learn how to build a keras model to perform clustering analysis with unlabeled datasets. Pre-trained autoencoder in the dimensional reduction and parameter initialization, custom built clustering layer trained against a target distribution to refine the accuracy further.
seems as though you're not supposed to be using the model's fit
alpine tiger
Autoencoder? shouldnt it be model.fit(X, X, ... )?
jolly briar
pcn = pc.loc[:, pc.columns.str.contains("name")]
pcn = pcn.loc[~pcn.duplicated(), :]
i sometimes find myself using patterns like this, and though they work i feel as though there's a better way. Perhaps that's because I'm thinking about something like dplyrs piping system.
here i'm just creating a dataframe pcn based on pc using only columns with 'name', then i'm dropping duplicates. Having two assignments feels a bit much
for some reason
velvet thorn
.drop_duplicates()?
rocky maple
Huh.
So, what I really want to do is calculate loss completely internally.
Meaning that there are no labels to try to match up to outputs.
So I passed it None
For both the training and validation set
alpine tiger
For dimensionality reduction?
rocky maple
Huh?
alpine tiger
The network.. You say it's unsupervised
I'm not quite following. If it's a autoencoder, you want to put to fit X to X through layers smaller than X's shape.
you want to put fit... I am great at typing
you want to fit X to X*
rocky maple
Correct
But there are more things going on
Reflected in my loss function
I'm taking the MSE of the original and the output, but that's not all
The architecture also branches
I take the original, and I add noise to it, then I shove the noised one through as well
And I'm also computing loss between the two latent spaces. I'm trying to get the Euclidean distance between them to approach zero.
alpine tiger
Huh - not sure then.. though if your loss doesn't use the y_pred - cant it be any n length array with shape of output?
rocky maple
The elements of y_pred are a list of Tensors that are the outputs of the model
Keras Tensors, not necessarily TF Tensors
alpine tiger
y_true * sorry
alpine tiger
Then I don't know, sorry =/
rocky maple
This may indeed solve it though
This is sort of my first project, so I'm not familiar with TF/NumPy
At least to the degree I should be
rocky maple
But they could also be Theano Tensors
coral yoke
no, they're not. keras is part of tensorflow now
rocky maple
Ah, alright
coral yoke
and tensors are tensors
rocky maple
Then what should I pass to be y_true
 thin terrace
So I'm trying to run tensorflow-gpu 1.15 in a jupyter notebook. I made a clean conda environment, installed tensorflow-gpu==15, jupyter and my other dependencies. When I import tensorflow it somehow has version 2.0.0, even though the conda list shows tensorflow-gpu 1.15. Why the hell does this happen and how can I fix this?
alpine tiger
... did you install a new ipykernel for your new conda environment? =S
thin terrace
I did the following:
conda create -n TF-GPU python=3.6
conda activate TF-GPU
conda install tensorflow-gpu==1.15
conda install notebook
conda install -c conda-forge shap
conda install scikit-learn keras
alpine tiger
type "jupyter kernelspec list"
thin terrace
Available kernels:
python3 /home/anton/anaconda3/envs/TF-GPU/share/jupyter/kernels/python3
alpine tiger
seems your missing the kernelspec for your new conda env?
alpine tiger
Will that not overwrite tensorflow on your base environment?
After that, change kernel in your notebook - and try again
lapis sequoia
@alpine tiger Maybe you can help me too, i cannot find a fix for this problem:
from fast_bert.prediction import BertClassificationPredictor

predictor = BertClassificationPredictor(args.output_dir/'model_out', args.output_dir, LABEL_PATH,
                                        multi_label=True, model_type='xlnet', do_lower_case=False)
results in this lovely error smashed in my face:
---------------------------------------------------------------------------
TypeError                                 Traceback (most recent call last)
<ipython-input-78-e66259e09b96> in <module>
      1 predictor = BertClassificationPredictor(args.output_dir/'model_out', args.output_dir, LABEL_PATH,
----> 2                                         multi_label=True, model_type='xlnet', do_lower_case=False)

TypeError: __init__() got multiple values for argument 'multi_label'
The thing is, i dont use multi_label anywhere else..!
thin terrace
What output am I expecting @alpine tiger ? Don't I want the python3 kernel?
alpine tiger
.. what python are you using?
alpine tiger
Then you want the python3 kernel
@lapis sequoia - either args.output_dir or LABEL_PATH has got to go ...
The signature is BertClassificationPredictor(model_path, label_path, muli_label=False, ... )
thin terrace
So, then no ideas for my problem?
alpine tiger
Didn't work with the kernel?
thin terrace
I already had that kernel
alpine tiger
You need the kernel in your new environment.. and also install it.. i believe
lapis sequoia
@alpine tiger How did you figure that out?
It seems, it doesn't matter, which one goes, both result in this error:
02/07/2020 16:56:25 - INFO - transformers.tokenization_utils -   Model name 'model_out' not found in model shortcut name list (xlnet-base-cased, xlnet-large-cased). Assuming 'model_out' is a path, a model identifier, or url to a directory containing tokenizer files.
---------------------------------------------------------------------------
AttributeError                            Traceback (most recent call last)
<ipython-input-86-1f8246e58d77> in <module>
      1 predictor = BertClassificationPredictor(args.output_dir/'model_out/', args.output_dir,
----> 2                                         multi_label=True, model_type='xlnet')
      3
      4 #predictor = BertClassificationPredictor(model_path=MODEL_PATH, pretrained_path=BERT_PRETRAINED_PATH,
      5 #                                        label_path=LABEL_PATH, multi_label=False)

......


/opt/anaconda3/lib/python3.7/urllib/parse.py in <genexpr>(.0)
    105 def _decode_args(args, encoding=_implicit_encoding,
    106                        errors=_implicit_errors):
--> 107     return tuple(x.decode(encoding, errors) if x else '' for x in args)
    108
    109 def _coerce_args(*args):

AttributeError: 'PosixPath' object has no attribute 'decode'
Nah, didnt help installing another kernel, still uses tf-gpu 2.0.0 somehow
thin terrace
yes
alpine tiger
hm.. then I'm clueless =S
thin terrace
😢
gentle depot
Hello
I'm trying to plot this but it shows nothing, can anyone please help?
import pandas as pd
import hvplot, hvplot.pandas
import holoviews as hv
data=pd.DataFrame({'Replica':[1,1,1,1,1,2,2,2,2,2,3,3,3,3,3],
                   'Vol [ml]':[30,40,50,60,70,30,40,50,60,70,30,40,50,60,70],
                   'Masa [g]':[29.89,40,49.93,59.94,69.94,29.99,40.01,49.83,59.79,69.64,29.96,39.94,49.9,59.82,69.6]})
data['Densidad [g/ml]']=data['Masa [g]']/data['Vol [ml]']
# f1=data.hvplot.scatter(x='Vol [ml]', y='Densidad [g/ml]')
# f1
# hv.Scatter(data,kdims=['Vol [ml]'], vdims='Densidad [g/ml]')
I know the last lines are commented
the problem is that both methods try to give me an output but nothing shows up
i do this on jupiter and spyder, same results
lapis sequoia
I never used hvplot....if you don't need it, i suggest you use seaborn instead @gentle depot
gentle depot
may I ask the reason why?
i'm new to python so that's the first thing I found for interactive charts
gentle depot
I understand, and will check it later
however this is bugging me now, i've been fighting with this seemingly simple plot and can't get nothing out of it
I already did it with data.plot() but i want to know why %$#& it won't work with hvplot or holoviews
lapis sequoia
can someone help me changing the size on a seaborn violinplot without using rCparams?
I'm not even kidding you, it just does not show any chart in jupyter @gentle depot
This is ridiculous
lapis sequoia
@lapis sequoia Do you mean plt.figure(9,16) for example?
gentle depot
been fighting with it for at least half an hour
lapis sequoia
Put that in front and it changes the chart size
Why do you need hvplot?
@lapis sequoia exactly, but that command does not work for violinplots unfortunately 😦
@lapis sequoia Then i have no clue, sorry. 😦
gentle depot
it's not that I need it to be hvplot, like I said, i'm new to python and that's the first thing I stumbled upon when searching for interactive graphics @lapis sequoia
It's just my personality doesn't allow me to acept defeat by this rather stupid code not showing nothing
lapis sequoia
if i put in plt.figure(figsize=(10, 5)) then i'll get a whole new frame lol
hahaha
lapis sequoia
mhh?
what do you mean? plt.xlabel('Hour of the Day',fontsize=12) plt.ylabel('Avg. Delay in Minutes',fontsize=12) plt.title('Violin Plot',fontsize=16); these commands all work
@gentle depot Oh forget that attitude ^^ be more goal oriented. Whatever brings you the result is good. Give seaborn a try, its a great plotting tool. otherwise go standard matplotlib
it's just the size command that doesn't 🤔
hvplot also seems to be a matplotlib module
I've experienced that with some of the sns plots
gentle depot
when you summon the plot command you generate a plot object, so you can pass the size argument as well while generating the plot @lapis sequoia
lapis sequoia
@lapis sequoia I've never used hvplot, why are you focusing on that? I'm using a mix of plotly, matplotlib and seaborn... depending on what i'm plotting
gentle depot
@lapis sequoia yes, i know... but ughhh...
thank you for your advise
lapis sequoia
@lapis sequoia Was ment for alchemist 🙂
fair enough, just trying to help out 🙂
@gentle depot summon... could you give me an example? I'm not too strong with the computer science terms...
point is, title changes etc. all apply to the graph, but using exactly the same principle for the size command does not work on some seaborn charts. It works on others though... it's weird
gentle depot
I know nothing about seaborn but when you call plot with seaborn you may do something like this
Seaborn.plot(x='xdata, y='ydata', ...)
Here the ... Are optional arguments, maybe you can check the seaborn docs and see which one controls the figure size
small ore
Um. Under what circumstances/situations do you use plotly?
@lapis sequoia
Kraktus, that seems to be a question for one of the help channels. read the rules and find a unused help channel
small ore
geo charts? Ones with the globe?
lapis sequoia
@gentle depot that's exactly the problem. Most of the seaborn charts have an optional size argument, but some don't.
@small ore map in my case
using coordinates
rocky maple
I'm trying to create an empty numpy ndarray of size:
print(combined_model.output_shape)
[(None, 4), (None, 4), (None, 32, 32, 3), (None, 32, 32, 3)]
But mirrored across another initial dimension of size 50000
small ore
Hm. How much of map data is available open source? Like district level boundaries? Village level?
rocky maple
Or is that not allowed because different sizes
 somber hamlet
Sorry wrong channel ^^
lapis sequoia
@gentle depot sometimes you have to adjust height and an aspect ratio to get the size you want. sometimes it's just a size argument. sometimes it's plt.figsize... like i said, it's weird haha, but thanks anyway
gentle depot
No problem
lapis sequoia
@small ore pretty much all of it i guess... certainly enough resolution for me, working with inter-city coordinates. but it's only a bunch of mapstyles available for free i think
it's my first project too.. 😆
small ore
Thanks for the info!
lapis sequoia
     13 plt.xlabel('Hour of the Day',fontsize=12)
     14 plt.ylabel('Avg. Delay in Minutes',fontsize=12)

TypeError: 'Figure' object is not callable```the optional arguments height and width refer to the violin part of the violinplot, i probably need to make an extra frame and plot into that... if anyone can help, pls dm
or @ me
 plain ice
Hey guys I'm trying to use lemmatisation on very specific topics and some terms are not recognised by the dictionary in the basic WordNetLemmatizer. How can I add custom words based on the topics to improve lemmatisation?
gentle depot
@lapis sequoia for some reason the very same code now works. I didn't change a single digit or comma
lapis sequoia
so, @lapis sequoia your problem was that plots are not shown in jupyter lab? Looks like we have something in common now, lol. Seaborn and matplot work, but plotly doesn't anymore ;D
new problems every day, sheeesh
gentle depot
Actually the problem was mine
lapis sequoia
oh ok
gentle depot
I spent an hour trying to figure out why this code > Hello
I'm trying to plot this but it shows nothing, can anyone please help?
@gentle depot didn't woork
lapis sequoia
sry
gentle depot
Sorry wrokg quote
lapis sequoia
so now it just works?
gentle depot
Anyways, the code didn't run on his jupyter, but now works and i did nothing to change it. Just left the tab open and went to do lab tests
lapis sequoia
weird... in notebook the pyplots worked perfectly, but jupyter lab doesn't plot the exact same code. the output window extends but it stays empty
lapis sequoia
guess i'm not that lucky, because i had this problem already when i switched to jupyter lab some days ago, but i figured it's because i didn't re-run all the code
but now that i did, it's still not showing ^^ in none of my notebooks
gentle depot
Strange things happen
lapis sequoia
you didn't even restart the browser?
mh anyway, i'll re-run it in notebook and hope it works then
did you try jupyter notebook and jupyter lab separately?
gentle depot
No, the very same tab, minimized for like 3 hours
lapis sequoia
lol
how big did your notebook file become?
the geoplot is kinda crazy... my filesize jumped from 5mb to like 250
gentle depot
Just a few lines, 8 or 9 tops
lapis sequoia
oh ok
i have like 600k
or 1.1mil, depending on which of the set i plot
any matplotlib expert here right now?
I'm having trouble to identify why i can't get an overlay of 2 plots in one figure... i was about to change to plotly for it is more user-friendly, but given that it doesn't seem to work now i'm stuck with matplot
# Defining Hourly-bins
rainhourbins = Weather_interp.groupby(Weather_interp.TIMESTAMP.values.astype("<M8[h]"))["precip_avg"].mean()
raindaybinx = Weather_interp.groupby(Weather_interp.TIMESTAMP.values.astype("<M8[D]"))["precip_avg"].sum()
raindaybins = raindaybinx/60

# Set up the Plot
fig, ax1 = plt.subplots()

ax = Dailytemp.plot(ax=ax1, kind="line", color="red")    # plot the Avg. Temperature over Time

ax2 = ax.twinx()      # set up the 2nd axis
ax2 = raindaybins.plot(ax=ax2, kind="bar", alpha=0.5)

#ax2.bar(raindaybins, height=.9, alpha=0.7, color="#02d8e9")   # plot the Precipitation bars
ax2.grid(b=False) # turn off grid #2

ax1.set_title('Avg. Temperature (line) vs. Precipitation (bars)')
ax1.set_ylabel('Avg. Temperature in °C')
ax2.set_ylabel('Precipitation in mm/day')

plt.show()```if i comment out the ax2 part the plot prints the line-plot (ax1 temp).... otherwise it prints the bar-plot (ax2 precip)
however it doesn't print both
makes me mad
velvet thorn
@lapis sequoia can you elaborate a little
I'm not so sure what you want to do
seems like two plots on the same axis with different y scales?
lapis sequoia
i basically wanted to print line chart of daily temperature data
lapis sequoia
on top of a precipitation bar chart, both in terms of x-axis as datetime index
it's a column, i just translated it that way
velvet thorn
yes, that shouldn't be a problem
dt = datetime
I assume it is
judging from your code
right?
lapis sequoia
are you asking why i used ("<M8[h]") for the one chart and ("<M8[D]") for the other?
velvet thorn
no
I'm just saying that it looks like you want values by hour
pandas has builtin functionality for that
lapis sequoia
i know
I've used it plenty of times
but how does this help me? ^^ I'm sorry maybe it's too late for me
i'll rewrite it, i coded this part in the very beginning... that's probably why it's even uglier than my current code haha
the point though is, i made two callable series
using the same index
like so
both of the plots work as you can see here, but they just don't wanna mix 😄
what are you trying to do
what are the plots against
if i do .dt.day i don't get the dates, but i get like 1, 2, 3, .... 30
see the upper picture
@lapis sequoia upper picture shows how the data looks like... x-axis is the index, as in dates
the line chart (red) is also perfectly formatted with month and days actually
all i wanna do is put them together in one, so the line chart is on top of the gar chart. and then there is a y1 scale on the left, an y2 scale on the right, and a shared x-axis
basically I'm trying exactly this https://pythondata.com/visualizing-data-overlaying-charts/

Visualizing data is vital to analyzing data. If you can't see your data - and see it in multiple ways - you'll have a hard time analyzing that data
an adapted version though... but i don't get it to work as in the tutorial
it's just printing either one or the other
a simpler approach
How to design figures with multiple chart types in python.
    fig.add_trace(
      ^
SyntaxError: invalid syntax```😦
okay fixed that, but this kind of plot doesn't go with the groupby method unfortunately
i'd just like to know why it's not working, since i pretty much did everything exactly like in that more complicated tutorial
velvet thorn
sorry, I forgot I was replying
have you fixed the problem
(btw it was too early for me...think I should have recommended resample)
ignore what I said earlier
what environment are you plotting this in?
also, the way you're plotting looks kind of weird...
can I have some sample data (like something I can easily paste)?
lapis sequoia
@velvet thorn i think it might actually work using plotly as proposed by @lapis sequoia , but i'm experiencing the same problem as @gentle depot did earlier. I don't see any plotly graphics in jupyter lab. It worked fine on my jupyter notebook pre-update, never used the lab before
velvet thorn
don't have plotly experience so I can't help with that
but are you doing this in a notebook now or not
😕
lapis sequoia
in jupyter lab
velvet thorn
oh...
lapis sequoia
which is pretty much like notebook, but the newer version
lapis sequoia
the matplotlib part? no
i never got that to work as intended... i moved on with my project because there was so much other stuff to do
but i need to fix it now
velvet thorn
okay, I have 2 guesses
the first is that your x-axis is off, so one plot gets squashed so much it appears not to show
the second is that you're plotting on a dead Axes
meaning an Axes object that is not active, so it's not displayed
so if you could provide sample data I could maybe try
gentle depot
Oh i remember something i had pending, maybe now that the chat is active someone can help me
How can i plot with 2 y axis in hvplot? Not subplot, what i mean is having a right and left y axis
lapis sequoia
i don't know what hvplot even is
but look up the screenshots above
i used 2 y axes in matplotlib code
temp left, precip right
hybrid scroll
Hi guys.. I have a dataset with 4 labels: failed, late, on time, and succeeded. The features is: salary, city of birth, city of residence, province of residence, age, gender.
I want to see the characters of users who fail, late, on time and succeed.
What algorithm to solve it using?
lapis sequoia
@velvet thorn https://tmpfiles.org/download/38862/sample.csv does the link work for you?
sorry, i destroyed the datetime index lol
lapis sequoia
@lapis sequoia in notebook, plotly still works. I got it working with plotly. It's yet super ugly though, compared to the formatted matplotlib chart ^^
@velvet thorn I'd still be happy if you could identify the mistake in matplot... i tried everything i could think of
velvet thorn
will look at it
ah, sorry, by the way
I don't know what I was thinking earlier about .dt.hour
that's totally the wrong method (too sleepy)
the correct method is using pd.Grouper with freq
lapis sequoia
i saved it as a DataFrame
already processed
no need to do that anymore
its past 5am, need to sleep :[
read ya later, thanks for your help man
velvet thorn
well, anyway, next time you need to group by a specific frequency, look into pd.Grouper
lapis sequoia
thanks for the tip
i can't seem to be able to copy tutorials correctly anymore lol
 rose flame
Please can anyone recommend good resources or tutorials to LEARN WEB SCRAPING and DJANGO?
 strange stag
@rose flame i can most definitely help you with scraping, not django tho
@rose flame so depending on what you need... i would always recommend selenium as an absolute last resort period. requests to get started, requests-futures to speed up but not asyncio/aiohttp, not familiar with trio. Also, to parse, most likely bs4, lxml and pyquery can also be used, but i prefer bs4 as it is easy to work with. Also, dont really recommend scrapy, although i dont have a ton of experience with this framework, it generally hasnt suited my needs. Using splash can also be an alternative to selenium, but its a bit more complex
@rose flame django i would probably go with tutorials by prettyprinted
although you have to be careful out of date tuts when doing so, as version mismatch can be pain (in general)
rose flame
Thanks.
strange stag
@rose flame np
 analog schooner
Anyone who knows a lot about Fixed Effect Regressions? Need some advice
lapis sequoia
@velvet thorn yeah that looks great... a bit more opacity to it maybe. How did you do it?
if i enlarge that, i can't see the axes anymore... weird why is the frame so dark?
velvet thorn
opacity is like that because I just copied
you can tweak it
anyway, the reason you had that problem was...
matplotlib was interpreting the X-axis differently for both plots
fig, ax1 = plt.subplots(figsize=(6, 6))

airtemp = df.groupby('timestamp')['airtemp_avg'].mean()
precip = df.groupby('timestamp')['precip_avg'].sum()

ax2 = ax1.twinx()

ax1.xaxis_date()

ax1.plot(dates.date2num(airtemp.index), airtemp.values, color='red')
ax2.bar(dates.date2num(precip.index), precip.values)

ax1.set_ylabel('Average airtemp')
ax2.set_ylabel('Average precipitation')

fig.autofmt_xdate()
this is what I used
lapis sequoia
@velvet thorn firstly, thank you so much! I still don't really understand what my mistake was but anyway thank you!!
i just tried to copy it, but seems there is some definitions missing?
NameError                                 Traceback (most recent call last)
<ipython-input-56-8c3db7d28288> in <module>
      8 ax1.xaxis_date()
      9
---> 10 ax1.plot(dates.date2num(airtemp.index), airtemp.values, color='red')
     11 ax2.bar(dates.date2num(precip.index), precip.values)
     12

NameError: name 'dates' is not defined```from datetime import timedelta``` did you import something other than these?ah ok I added import matplotlib.dates as dates that seemed to fix that... but it is still not working lol 😭
AttributeError                            Traceback (most recent call last)
<ipython-input-57-3f7b3f762335> in <module>
      9 ax1.xaxis_date()
     10
---> 11 ax1.plot(dates.date2num(airtemp.index), airtemp.values, color='red')
     12 ax2.bar(dates.date2num(precip.index), precip.values)
     13

D:\Programme\Anaconda3Python\lib\site-packages\matplotlib\dates.py in date2num(d)
    421         if not d.size:
    422             return d
--> 423         return _to_ordinalf_np_vectorized(d)
    424
    425

D:\Programme\Anaconda3Python\lib\site-packages\numpy\lib\function_base.py in __call__(self, *args, **kwargs)
   2089             vargs.extend([kwargs[_n] for _n in names])
   2090
-> 2091         return self._vectorize_call(func=func, args=vargs)
   2092
   2093     def _get_ufunc_and_otypes(self, func, args):

D:\Programme\Anaconda3Python\lib\site-packages\numpy\lib\function_base.py in _vectorize_call(self, func, args)
   2159             res = func()
   2160         else:
-> 2161             ufunc, otypes = self._get_ufunc_and_otypes(func=func, args=args)
   2162
   2163             # Convert args to object arrays first

D:\Programme\Anaconda3Python\lib\site-packages\numpy\lib\function_base.py in _get_ufunc_and_otypes(self, func, args)
   2119
   2120             inputs = [arg.flat[0] for arg in args]
-> 2121             outputs = func(*inputs)
   2122
   2123             # Performance note: profiling indicates that -- for simple

D:\Programme\Anaconda3Python\lib\site-packages\matplotlib\dates.py in _to_ordinalf(dt)
    221         tzi = UTC
    222
--> 223     base = float(dt.toordinal())
    224
    225     # If it's sufficiently datetime-like, it will have a `date()` method

AttributeError: 'str' object has no attribute 'toordinal'```WTH, it works in jupyter lab, but not in the notebook O_O
so now i get all the matplot and sns plots in the jupyter lab, but have to switch to notebook for plotly.... lmao
velvet thorn
from matplotlib import dates
whoops, forgot about that
it works fine in notebook for me
lapis sequoia
i already did that
it works in lab
in notebook the same code spits out the error message above
makes no sense at all
i need a break from computers hahaha
i'd really like to understand why it doesn't work with my old code, as i did ax2=twinx() too
but i didn't know the commands ax.xaxis_date() and fig.autofmt_xdate() yet, so thanks for that
velvet thorn
see above
no tim to explain now
but
do get_xticks() on both and you will understand
 fast aurora
Hey guys, I am trying to train a classifier with 120 labels, however I only have about 148 images per class so the CNN doesnt work, can someone help me how I can achieve this, should I use something other than a CNN?
velvet thorn
pretraining?
alpine tiger
What is the easiest way to convert a 1D structured numpy array, with <f4, <f8 and <i4, to a 2D <f8?
fast aurora
any solution is fine @velvet thorn
gentle depot
Hello
I'm new (1 month) to python and data analysis, and I'm searching for tools to learn to maximise my efficiency and basically learn the state of the art of things. I'm right now getting the hang of it, daresay that i got the basics of pandas and now I'm looking for data exploration/visualization tools to learn. I started with hvplot because I'm interested in interactive charts and being able to export to web pages. Would you please recommend me what tools you experts use (and if possible, why)? I'm new to python, like I said, but have several years of experience with matlab so your recommendations not necessarily have to be something 'easy'
Thank you beforehand and please don't let this post drown, any suggestion is welcome.
lapis sequoia
what's the simple command to pip-update all packages again?
pip list --outdated shows a long list again already... i thought pip --upgrade all would update them, but it doesn't. There seems to be some confusion on the web too?!
velvet thorn
okay I wanna do sentiment analysis real quick
any suggestions
nothing too heavyweight
lapis sequoia
stock-sentiments?
 worthy meadow
Hello. I was told that this would be a good place to get an understanding of what resources I might need to be able to learn machine learning. I've been suggested two courses and am currently watching a6 hour youtube vid from simplilearn on the topic
feel free to ping me if someone sees this
oblique belfry
What is everyone's thoughts on MLFlow?
lapis sequoia
Bpsych you're probably watching Daniel Chen then? His presentations are like 2-3 hours or so and helped me a lot to get into it. Hands on approach seems to be the best IMO. I had my own data project, so I didn't do any tutorials... just learning by doing. There are lots of tutorials and datasets online to learn from though
another noob question here, what's the best way to save the charts from jupyter lab? I thought I'd just right-click and save as .PNG but apparently that's not an option 😄 (I'm already using plt.show())
worthy meadow
nice python_noob!
 jovial river
for KNN and one dimensional data.
To calculate the weight for the 1st neighbour of an unidentified data point x = 5.0,
where the list of data points = [0.5, 3.0, 4.5, 4.6, 4.9, 5.2, 5.3, 5.5, 7.0, 9.5]
it would be 1 / d(x, xi)^2 = 1 / (5.0 - 4.9)^2 = 1 / 0.1^2 = 1 / 0.01 = 100 correct?
And from there would you multiply the weight by their relative distance i.e (5.0 - 4.9) * 100?
jovial river
Are my calculations correct?
jolly briar
i'd like to have a df.glimpse() function that output something similar to df.head(3).T, I find i use this a fair bit
is there anything I'm missing?
tbf df.T would do most of the time i guess, i do use head a fair bit tho 🤔
oblique belfry
@lapis sequoia plt.savefig(“Test.png”)
lapis sequoia
@obsidian herald thanks, will try
lapis sequoia
plt.savefig(“Test.png”)does work, but it cuts off most of the titles or the labels at the top, bottom and left side... it's pretty much useless really
looks like i badly copied the charts from a website
@velvet thorn thanks, fig.savefig works much better!
i don't understand what you mean by explicit > implicit tho
looks like it does not work with all matplotlib plots, does it though?
velvet thorn
Google “object oriented vs stateful matplotlib”
I can explain more fully another time
lapis sequoia
thanks
oblique belfry
I’m not a matplotlib fan. I just googled that two days ago to save my plot.
The interface always confuses me.
lapis sequoia
it has powerful functions no doubt
but if you need to rework all your perfectly formatted plots because the shitty thing is not able to determine its own graphs' size and crops off important parts of it, that's just crap
it's like a HUGE timewaster. Also if you accidentally load a certain style like fivethirtyeight, it'll totally destroy your formats all over again, plotting every graph with COMPLETELY different plot sizes, label sizes, font sizes, etc.
and plotly doesn't even show graphs anymore since recent updates, even though i tried every troubleshoot i could find
i kinda feel like python developers have made it their personal agenda to destroy my life, getting me to waste time on absolutely unnecessary problems and failing my deadline
oblique belfry
Sorry. @lapis sequoia That does suck. I am not a fan of many Python visualization libraries for complex tasks. I routinely have to scour StackOverflow for decent help on complex topics.
lapis sequoia
it's absolute horror, for real
having invested uncountable hours in interactive plots that i now can't use, because notebook and jupyterlab decide to not show them anymore / render them empty ;D
jolly briar
ggplot > matplotlib
silent swan
matplotlib isn't amazing but it gets the job done
especially if you want complete control over what your plot looks like
lapis sequoia
Liblinear failed to converge, increase the number of iterations.```any idea what that's supposed to mean? I'm just re-running a support vector regression model and cross val, since updating my python packages... another surprise
have never seen this error before
silent swan
the optimization failed to converge, usually that implies there's an issue with your data that makes the model you're trying to fit illsuited to it
in rare cases it actually does just mean you need more iterations
lapis sequoia
mh, i guess it could come from dummy-trap
oblique belfry
Did you fix your random seed?
lapis sequoia
i've decided to not drop the first column with OHE() and instead drop it manually for some models, because some models like randomforest regressor should work fine without dropping those, right?
you mean when splitting into training and test set? yeah i did
velvet thorn
hm I personally find matplotlib quite okay to use
the main problem I have is that...somehow it just doesn't look that good a fair bit of the time.
 plain turret
the problem i have with matplotlib is that they're trying to have two syntax, with the heritage they have + the oop from python
making any post/tutorials mixed bags of approach
but usually once you get your graph good once, it's always good
jolly briar
@velvet thorn to be fair - i've never bothered with the OOP approach, and whenever I complain about matplotlib, this is what I'm told to use
so perhaps i'm missing the point a bit with it, initially gg is far better though imo
jolly briar
definitely what - i'm missing the point and should look at the OOP
velvet thorn
AND easy to use
jolly briar
oh, right, yeah ok... that's my impression
jolly briar
I'd move data from python to R to plot, because matplotlib is trash to me, but like i say - i haven't looked at the oop stuff :/
velvet thorn
unless you actually want to dive in and not come out for a while...just use Seaborn or something
using plt is disgusting though IMO
you can't do anything right...
okay I think the main problem is
plt is convenient, but in terms of entry-level ease of use and power
it's like
here
jolly briar
yeah it's horrendous, and i find myself googling loads of stuff and pasting like 13 lines to change a little thing
velvet thorn
and ggplot is all the way over THERE
but that's what you get when a languge is purpose-built for a thing, I guess
MPL has evolved a lot over time
and it's quite clear that it's evolution
jolly briar
surely you'd get something decent if it was purpose built 🤔
jolly briar
ah right, ok, yeah - dplyr pipes are also nice and v easy to add functions too
whereas pandas you're using lambda for that kinda thing
velvet thorn
such is life
jolly briar
having to leave . and use = for lines, etc
velvet thorn
general-purpose programming language
jolly briar
so it's messier
velvet thorn
🤷♂️
jolly briar
yeah - though pandas is pretty targeted
jolly briar
so really i feel as though the workflow should be as smooth, but python never beats R (to me) when it comes to filtering / looking at data and plotting it out
velvet thorn
although you can kind of use pipe in pandas
as a somewhat but not really substitute
jolly briar
how, by wrapping in ( ... ) ?
jolly briar
well yeah but nothing isn't the comparison 😄
velvet thorn
I'm sure if it really matters that much to enough people
someone will write something that will allow you to do it in Python
jolly briar
have you used pyjanitor?
i've not got around to it yet, bumped into it the other week tho
lapis sequoia
I am learning data science from Kaggle micro courses and then I would post questions on Stackoverflow for more advice. This is how I learned programming e.g. learned C from K&R2 and then posted my questions on comp.lang.c and also by researching and reading more on that newsgroup, comp.lang.c was goldmine of knowledge and I became really good at C. That was 10 years ago, I was wondering how can I become good at data science, where I can find such places to talk and read and research and hang on with like minded people. We have this channel here but it is real-time and one can't search like I did on a newsgroup. Any advice?
jolly briar
@lapis sequoia hackernews can be alright
not ds specifically, but can be alright - i think the machinelearning sub reddit is meant to be good as well
i don't really use it tho
lapis sequoia
@jolly briar which Hacker News?
https://duckduckgo.com/?q=hackernews&t=ffab&atb=v200-1&ia=web
lapis sequoia
Cool, Thanks
lapis sequoia
yeah it's horrendous, and i find myself googling loads of stuff and pasting like 13 lines to change a little thing
@jolly briar facts
does anyone have a decent source about interpreting statsmodels linear model regression (OLS) results to freshen up my rusty statistics abilities?
jolly briar
@lapis sequoia check islr - it uses R but iirc the output from statsmodels is v. similar to R's output (the same?) - i think chapter 3 of ISLR is based around OLS so might be of use (the text is free online)
(islr = introduction to statistical learning)
lapis sequoia
thank you!
thin terrace
Trying to interpret a keras sequential model on tabular data with skater but I run into a IndexError: index 1 is out of bounds for axis 1 with size 1. I have no idea what this means and I can't figure out what I'm doing wrong. Any ideas?
lapis sequoia
@thin terrace i had the same problem
or i think i had 🤔
i think the problem was that y showed the original row-index values from pre train/test-split, while X due to being transformed to an array didn't or something like that
i think making y a dataframe and resetting the index and dropping the old one solved it for me
bump:```ConvergenceWarning:
Liblinear failed to converge, increase the number of iterations.```
can anyone help with this? It's occurring with a linearSVR, and i have no idea why. I don't seem to have had the same problem before the recent update.
i tried changing dual=False as this was suggested somewhere in the web, didn't solve it though... just another error/warning then
does it have to do with configuration of epsilon, c, etc?
thin terrace
@lapis sequoia y isn't even used in these functions tho :/
nvm, it's used in the Interpretation object
lapis sequoia
exactly. so did the fix work?
thin terrace
nope :/
You mean both X_test and y_test should be DataFrames with indices reset to 0, 1, 2, ..., n
Right?
This is now my y_test
lapis sequoia
yeah i had that problem with a statsmodels model once
thin terrace
And this is X_test
lapis sequoia
while i didn't need to adjust anything for sklearn
if that's not it, i'm sorry to say i have no idea
thin terrace
shit :(
I changed two hard-coded indices in the skater source code and now it works lol.
 shrewd trellis
hi anyone use anaconda here?
and got this error when launching a jupyter notebook
 fringe cove
hello i'm trying to print a dataframe in my console but it doesnt print the columns in the right order
i'm building my df with 5 array i go through for i in range(len(player_list)):
df = df.append([{'player_name': player_list[i] , 'line': line_list[i],"avg_line" :avg_line_list[i],"moyenne player" : moyenne_player_list[i], "MARGIN" : margin_list[i] }])
@fringe cove
jolly briar
how to create weighted group means with groupby
x = {
    "n": [10, 15, 5, 3, 7, 15, 20],
    "code": [1, 2, 3, 4, 5, 6, 7],
    "G": ["a", "a", "a", "a", "b", "b", "b"],
    "X": [7, 3, 5, 10, 12, 8, 4],
}
df = pd.DataFrame(x)
In [78]: df
Out[78]:
    n  code  G   X
0  10     1  a   7
1  15     2  a   3
2   5     3  a   5
3   3     4  a  10
4   7     5  b  12
5  15     6  b   8
6  20     7  b   4
this for example
if i want to groupby('G'), and have the mean of X, but weighted by n which represents the counts that were in the original aggregations
i thought it might be like
df.groupby('G').apply(lambda x: (x*df.n)/df.n.sum())
that's not working tho
df.groupby("G").apply(lambda sub_df: sum(sub_df.X * sub_df.n) / sub_df.n.sum())
think that works actually
 bright hollow
Just a quick question. Is there an easy and fast way to correct typos that may be in the text in the panda dataframe? I only found python libraries that find the typo but don't correct them immediately
bright hollow
ok i used the autocorrect library now but it doesn't seem to able to correct simple typos like "chosoe" or "lisen"
coral yoke
i don't believe there's going to be an "easy" way for that and you'll have to deal with modules such as that
 urban silo
Pandas Question:
df_sentiment_value = df.loc[df.Id == source_Id, 'sentiment_sum_bracket'].values[0]
Is there a way to speed this up with .at? Need access by column name, not by index
jolly briar
how to convert the following so that what is spread across columns, meaning this data would be three rows instead of 12
data = {
    "a": [1, 2, 3, 4, 5, 6, 7, 8, 9, 10, 11, 12],
    "b": [1, 2, 3, 4, 5, 6, 7, 8, 9, 10, 11, 12],
    "what": ["a", "a", "a", "b", "b", "b", "c", "c", "c", "d", "d", "d"],
    "where": ["x", "y", "z", "x", "y", "z", "x", "y", "z", "x", "y", "z",],
}
tst = pd.DataFrame(data)
In [42]: tst
Out[42]:
     a   b what where
0    1   1    a     x
1    2   2    a     y
2    3   3    a     z
3    4   4    b     x
4    5   5    b     y
5    6   6    b     z
6    7   7    c     x
7    8   8    c     y
8    9   9    c     z
9   10  10    d     x
10  11  11    d     y
11  12  12    d     z
Can someone explain to me why I can't reproduce the loss on the test data?
https://hastebin.com/inarorexap.py
oblique belfry
How is Tensorflow/Pytorch support on MacOS? I use a Dell machine and Ubuntu at my current employer and my new employer is looking to get me a Mac.
 polar acorn
Tensorflow has always worked fine for me on a mac. Slower though due to no Nvidia GPU but fine for light training loads.
oblique belfry
I’d assume CPU mode would work. I’m more curious/concerned about GPU mode.
 still abyss
Hi guys, would the area under the ROC curve change if I change the traning split fraction?
 robust dome
Hey I keep using the function sns.lineplot() on a data set and I keep getting this error. Has anyone know how to resolve this?
oblique belfry
@robust dome
Seems like it can’t do int64. Any need for your data to by int64? An easy solution should be input_data.astype(np.int32). Where input_data is whatever your input to the plot func was.
 burnt wharf
hey guys I am trying to import demjson in jupyter notebook and it is throwing error ModuleNotFoundError: No module named 'demjson'
even though I have installed this package using pip
lapis sequoia
Problem statement :
I have 3 data frames one contains records which we need to update , insert and delete respectively.
Is there a way to create update, insert and delete queries and execute them in batches of 1500 records
Can some one help
 hardy radish
i want to learn data science from where do i start ?
lapis sequoia
does anyone know (from theory or experience) how much time it would take to gridsearch 20,000 rows of data on 3 kernels (poly, rbf and sigmoid) with 4 epsilons, 2 tolerances and 3 Cs? i take it without cross-validation thats about 20k^72 rows of data ?
robust dome
@oblique belfry thank you for the advice I don’t really know why, the tutorial I’m following on a git hub uses this data
 serene plume
I'm trying to import google.colab such as from google.colab import files, yet when I click on "Install package google" which Pycharm suggests, it just goes back to signaling it as an unresolved reference. What should I look into to fix this? 😕
robust dome
@hardy radish there’s a lot of tutorials to help you out. First learn the basics of doing python like loops, booleans, variables and conditionals. Then learn how to use matplotlib, pandas, numpy, seaborn and there’s probably more (I’m kinda starting off to so this is still new to me lol)
real wigeon
Anyone have experience with scrapy?
I successfully ran my scraper once, but then I tried to run it again and got a scrapy command doesn't exist googled it, saw that I need to update my bash profile. Did so and it still didn't work
 warm grail
hey, I'm watching an MIT course for Data Science and the professor showed this class, do you guys know why would it be preferable to make a method only to return an attribute instead of accessing the attribute directly?
class Food(object):
    def __init__(self, n, v, w):
        self.name = n
        self.value = v
        self.calories = w
    def getValue(self):
        return self.value
    def getCost(self):
        return self.calories
    def density(self):
        return self.getValue()/self.getCost()
    def __str__(self):
        return self.name + ': <' + str(self.value)\
                 + ', ' + str(self.calories) + '>'
 unkempt helm
it's not preferable, just creates unecessary code in this case
unkempt helm
nope
coral yoke
@warm grail it's common OOP practice to set getters and setters for attributes you do not intend a developer to change directly
it's far from unnecessary code however, especially when it comes to methods you would like to use yourself when further developing a large package as well as developers using the package in the future
unkempt helm
for attributes you do not intend a developer to change setter is just for that
coral yoke
?
if there's any formatting or preprocessing intended for retrieving or interacting with the attribute, you create a method to do so
unkempt helm
it's not pythonic, you have properties for that
coral yoke
debating over pep 8 does not mean it's unnecessary especially when someone's asking why the core concept exists
there's a reason MIT shows what it actually looks like in other languages and what you can still do without a decorator
unkempt helm
in the code he posted I would say it is unnecessary. And he asked "why is it prefferable" which it is not
coral yoke
you're going way over the purpose of that
do you guys know why would it be preferable to make a method only to return an attribute instead of accessing the attribute directly?
not why would it be preferable to do it this way
i get what you're trying to say and obviously it's not pythonic but the purpose of that class is to demonstrate the concept of private properties in OOP
that class is not to demonstrate best practice
unkempt helm
hm I see, I guess you could understand that the other way too
and ye I was confused if it was to demosntrate the private properties why not even bother with _ prefix
warm grail
thank you guys for the takes on it
 merry portal
Does numpy have builtin range function to create ndarray of (for example)shape (100,3)?
Currently I:
[[x,y,z] for x in np.arange(x_min, x_max, step_size) for y in np.arange(y_min, y_max, step_size) for z in np.arange(z_min, z_max, step_size)]
Similar to grid, but meshgrid doesn't do what I want
oblique belfry
What are the ranges for the input?
 crystal sluice
hey guys. little issue.
i'm going trough the IBM data science course and got stuck on a test
i have a function
def make_dashboard(x, gdp_change, unemployment, title, file_name):
    output_file(file_name)
    p = figure(title=title, x_axis_label='year', y_axis_label='%')
    p.line(x.squeeze(), gdp_change.squeeze(), color="firebrick", line_width=4, legend="% GDP change")
    p.line(x.squeeze(), unemployment.squeeze(), line_width=4, legend="% unemployed")
    show(p)
it's being asked to put the "x" as the date column of a dataframe
just a se c
oblique belfry
https://arxiv.org/abs/2002.04803
Good overview of Python and deep learning
 chrome flicker
I need help in my machine learning assignment. I am using CNN to classify the images placed in different folders by using training set and test set
But in assignment i have to classify the images data using json data file. How i can classify the images data using json file instead if images folders?
Help me please