#data-science-and-ml
1 messages · Page 216 of 1
 velvet thorn
this is assuming your hour_of_day column is stored as an int.
however
a better (but a bit less explicit, IMO) way to do it
 lapis sequoia
np.logical_and(hour_of_day>=6, hour_of_day<=9)
Thank you so much, this helps a lot! And thanks for the tip, I didn't do underscores as I wanted to save spaces (working with maaany columns), but I see your point... looks much better the way you're doing it
velvet thorn
why would you use logical_and over &
so, anyway, you can use between: df['new_column'] = df['hour_of_day'].between(6, 9)
lapis sequoia
even better
velvet thorn
yet another way to do it is with query:
lapis sequoia
awesome! thanks again... i thought it was much more complicated
velvet thorn
df.query('hour_of_day >= 6 & hour_of_day <= 9')
although in this specific case you have between so there's no need
in general, when combining multiple boolean conditions, there are three ways to do it:
velvet thorn
query doesn't create an intermediate result for each operation.
lapis sequoia
afaik np is a much faster way
velvet thorn
it should be faster than query
because query has a lot of associated machinery
however, IMO, it is also less idiomatic.
the point of pandas is an additional layer of abstraction over numpy, and in general I don't think the performance difference will matter.
lapis sequoia
thanks for the explanation, and giving alternatives as food for thought.
really appreciate the effort
which of the mentioned would be your personal go-to method?
and does the sklearn standardscaler always recognize booleans or is it better to convert it to 1s and 0s manually?
velvet thorn
about your last question: I honestly can't remember, just try it
personally, I don't actually like query/eval...
velvet thorn
using strings to represent operations just doesn't sit well with me
it is more memory-efficient, though.
lapis sequoia
@lapis sequoia no, never heard of it 😫
velvet thorn
Kubernetes is a container orchestration framework
lapis sequoia
I know what it is.. I had some questions lol
lapis sequoia
ok..
velvet thorn
was explaining what it was to @lapis sequoia
basically, you have lots of instances of some service you want to expose, and you use Kubernetes to make them look like one big monolithic thing that automatically routes requests and stuff for you
I think if you have multiple conditions, you can do this:
after_morning = df['hour'] >= 6
before_evening = df['hour'] <= 15
weekend = df['day'].isin({'Saturday', 'Sunday'})

df[after_morning & before_evening & weekend]
for example.
but ultimately, IMO, just go with whatever you find most readable
anyway, I have working knowledge of Kubernetes, but probably not enough to help you
probably the nice people in #414737889352744971 are much more proficient than I am
lapis sequoia
Woah that's smart! I might actually use that with saturday & sunday differentiation
velvet thorn
I don't know if pandas automatically converts the argument of isin, but my guess is it doesn't
if all your values are hashable, prefer using a set
because the time taken to check if something is in a set doesn't increase as the set gets bigger (not strictly true...but true enough.)
velvet thorn
a "hashing function" is a function that converts an arbitrary object to a number, which can be thought of as something like it's "id" (as distinct from the id function).
that's how sets and dicts store items - they hash each element they contain, and use the hash value to decide where in the allocated memory to store the object. this means that the time taken to determine where an object is located is always the same, regardless of how many objects there are.
however, there are two problems...
-
since there are more objects than hashes (in a loose sense), some objects may have the same hash. this is termed a "collision" (objects not equal, but their hashes are equal), and in such cases additional work has to be done to check for membership. this is what I meant when I said "not strictly true" above.
-
a hash must be deterministic, and to distinguish between objects of the same type, it should depend in some way on the immediate object's characteristics. therefore, if those characteristics can change, the hash should change too. however, there is no way for an object to know which containers actually use its hash, so if it changes and the container still uses the old hash, the object will appear not to be stored in the container, when in fact it is, just under a different hash. this is why mutable objects, in general, cannot be
dictkeys orsetelements - they are not hashable.
for completeness, graph of time taken to find a random number from 0 to 499 in a set vs a list, vs the size of the collection
lapis sequoia
A value is trying to be set on a copy of a slice from a DataFrame. Try using .loc[row_indexer,col_indexer] = value instead
this comes up so many times when creating a new column like that... the code works anyway, but it's kinda annoying. Can anyone explain?
is it only a Jupyter Notebook thing?
velvet thorn
@lapis sequoia I believe I explained this a few days ago in this channel
try searching, should turn up
might have been another channel, but I'm pretty sure it was this one
lapis sequoia
In matplotlib.pyplot.contourf what does the parameter alpha do?
Also what else can we put up in cmap argument of the same
i believe cmap is colourmap?
velvet thorn
alpha is transparency
 jolly briar
I need to carry out cross validation but my data has groups, so I don't want to put data from group g1 in both fold k1 and k2, it should all be together. I'm using sklearn - has anyone done this before?
 oblique belfry
I am doing a multiclassification project with Keras. I can currently calculate the True Positive, True Negative, False Positive, and False Negative as Keras metrics. However, I want to know the classification stats for each class individually, not in aggregate. How would I go about this? I am looking to avoid calling predict_generator in a Keras callback. Looking for a Keras/Tensorflow (preferably Keras) solution as a Keras metric.
oblique belfry
Yep
I have 5 classes. I wanna know the numbers for each class. I currently just have total accuracy. I would like to know how the model is doing label each class. It might just be better at some classes than others.
 strange stag
was hoping someone could help me turn this data https://imgur.com/2SGbLXr into this https://imgur.com/swjUpfo
I've attempted to use .fillna(method='ffill') however, this gives inaccurate data

 lapis sequoia
@velvet thorn I just read what you've written. Yeah you said that it was because he had indexed before. But I didn't index?! I know the code still works, so it's not much of a problem really.... but I would just like to know, how to do it correctly, so that that kind of warning won't pop up when the someone is running my code
@velvet thorn about that indexing error...
 paper niche
you must have. check the cells that you ran before the current one. the SettingWithCopy warning in jupyter notebooks usually confuses people because the offending line (i.e., the actual reason for the warning) isn't from the current cell, typically.
Instead, it's usually from some cell (say, cell [1]) that you ran above, and the warning only appeared later down the line when you wanted to reassign some value in that dataframe (say, cell [20]). At this point, using .loc or not makes no difference. The fix must be applied to the original dataframe in cell [1].
the SO qna on settingwithcopy is quite comprehensive about the reasons why this happens, and what to do about it. have you alr gone through that? https://stackoverflow.com/q/20625582

Stack Overflow
Background
I just upgraded my Pandas from 0.11 to 0.13.0rc1. Now, the application is popping out many new warnings. One of them like this:
E:\FinReporter\FM_EXT.py:449: SettingWithCopyWarning: A ...
@lapis sequoia
lapis sequoia
@paper niche thanks for the link & explanation. Yes, it always happens with when making a new column on a existing dataset that already has been cleaned and messed with. But how else would you do that.... sounds to me like I'd need to write the changed and cleaned dataset to_csv, then read it again "as original" to make the error go away? Very weird. When working on a dataset isn't it obvious that you'll make changes sometime later when you realize there is still things to optimize?
paper niche
that’s not necessary. the point is to be aware of when this warning occurs (I mean the offending line: where you indexed, not when the line where the warning pops up: when you try to set a value on it). I’ld usually just call .copy() on the offending line.
lapis sequoia
Ok
paper niche
if it really bothers you and don’t want to worry abt fixing it then just switch off the warning in your first cell..
lapis sequoia
It doesn't really bother me too much, I just thought it was "unprofessional" ^^ and since someone will probably be reviewing my code... you know
I thought I'd save RAM by overwriting the existing df with itself when making changes... that was kind of the point why I did it this way
The df is huge and I experienced some problems with particular plots or regression calculations
or even with the browser crashing occasionally.
strange stag
how do i convert this to .loc?
df['max'] = df.groupby('upc')['price'].max()
lapis sequoia
is that even possible o_O? sry I'm not proficient enough to answer.. if you wanted to do it for a specific price or upc I could help, but not with a general groupby
strange stag
so i have multiple prices for each upc, location differing, and im trying to get the max price based upon a location name
also need to filter to drop all but the highest price for each upc at the same location
df.groupby('upc')['price'].max() this gives me the answer im looking for, but i cant seem to assign the values to a column
o its cause i have upc, price as columns hmm
@lapis sequoia if you look at my previous post, thats what im trying to do
 remote gust
So I’m having problems imputing dataframes with sklearn
Basically the imputer is dropping colums that it determines are all nan, even though I already used dropna() on the whole dataframe
All the values are float64
lapis sequoia
@strange stag sounds to me you need to use the command transform not groupby
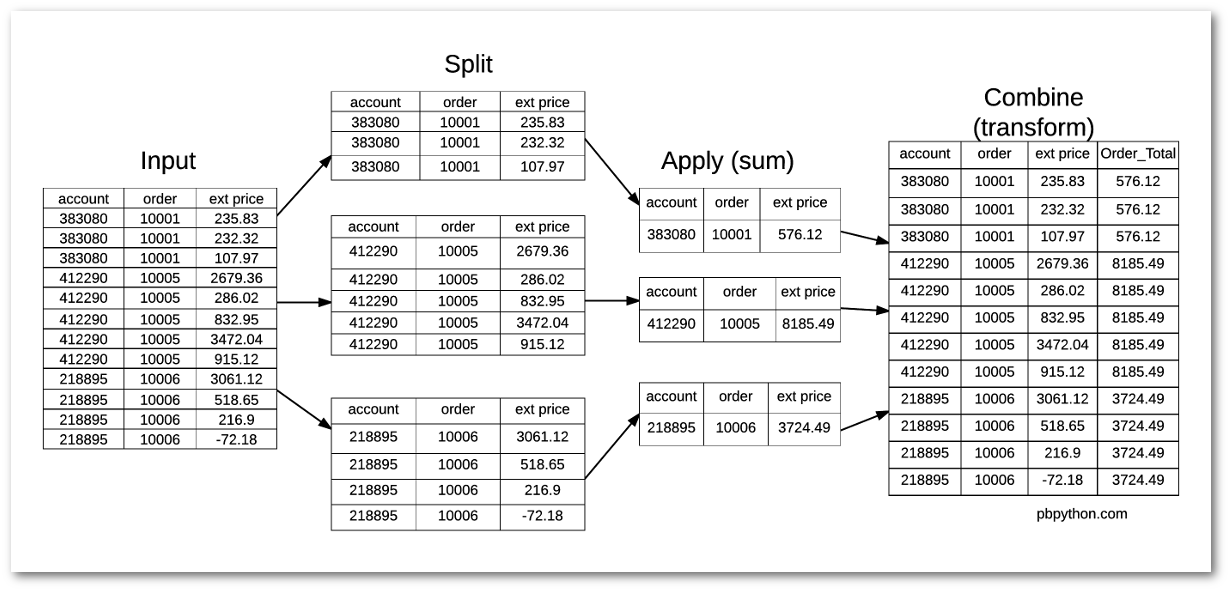
The transform function in pandas can be a useful tool for combining and analyzing data.
check this out
lapis sequoia
transform is just easier (less work) and more elegant i guess... but you can do it without it for sure
strange stag
right, but how i can i transform while filtering for a column value
lapis sequoia
@remote gust have you checked for NaNs in all columns/rows? .isnull().any()
paper niche
you can use transform on a groupby df.groupby('upc').price.transform(np.max) @strange stag
paper niche
it's equivalent to window functions in sql
strange stag
df['max'] = df2.groupby('upc')['price'].transform('max')
how do i erm...
df.loc[df['price'] > df['min'] and df['price'] < df['max']]
basically selecting all rows that are greater than the min price and less than the max
cause ive already created the max i need using a specific location
or should i just drop without using the and
velvet thorn
df[df['price'].between(df['min'], df['max'])]
paper niche
yeah what gm said
velvet thorn
yes
strange stag
hmm i guess i messed up somewhere
@velvet thorn was it you that gave me the erm
aggs = df.groupby([(df['location'] == 'Amazon'), 'upc']).agg(['min', 'max'])
df2k = pd.concat([
    aggs.xs(False, level=0)[[('location', 'min'), ('price', 'min')]],
    aggs.xs(True, level=0)[[('location', 'max'), ('price', 'max')]]
])
@velvet thorn i'm still fiddling with that damn directional index for commuter trains ^^ I managed to get all the other dummy variables i wanted thanks to you though
say... if i write something to a list using to_list, then i get a list with a number index and corresponding values
strange stag
cause this is nice, but idk how to filter this...
well, merge by upc
.stack() helps, but still kinda weird
lapis sequoia
does that mean the corresponding values have ordinal ranking?
remote gust
@lapis sequoia I will try that, I thought that dropna would do the trick already but maybe there’s some weird shit afoot
lapis sequoia
i mean if the values are string or object obviously
strange stag
how do i pivot the min/max of...
velvet thorn
yes
strange stag
nvm
think im almost there!
rofl
got the right prices for min/max it seems, but locations are whacked...
when im appending to a dataframe, how can i keep leading zeros?
velvet thorn
what?
strange stag
so im reading from a jsonl file, and i have to append the data to the dataframe instead of reading it, and im getting 13964765816 as a upc instead of 013964765816
strange stag
ah okay
ah, there we go 🙂
Okay, where is the error here
aggs = df.groupby([(df['location'] == 'Amazon'), 'upc']).agg(['min', 'max'])
df2k = pd.concat([
    aggs.xs(False, level=0)[[('location', 'min'), ('price', 'min')]],
    aggs.xs(True, level=0)[[('location', 'max'), ('price', 'max')]]
])

df3k = df2k.groupby('upc').head(len(df2k)).sort_values(by='upc')
reason i believe there is an error is because
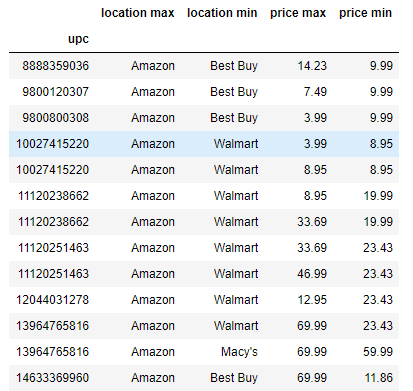
upc, location, price
min location should not be homedepot, but rather, walmart
as seen here
hmm
converted to a csv, trying to find if it changed the results...
na...nvm
remote gust
@lapis sequoia training_set.isnull().all(axis=0) returns false for every column
lapis sequoia
try training_set.isnull().any() to see in which columns there are missing values
velvet thorn
is that a JSON?
if it is, price is the wrong type.
it's being stored as a string.
strange stag
jsonl, not json
okay i found the error
its with aggs
aggs = df.groupby([(df['location'] == 'Amazon'), 'upc']).agg(['min', 'max'])
df2k = pd.concat([
    aggs.xs(False, level=0)[[('location', 'min'), ('price', 'min')]],
    aggs.xs(True, level=0)[[('location', 'max'), ('price', 'max')]]
])
@lapis sequoia so basically as soon as the dataframe is passed as an argument it loses the columns
strange stag
@velvet thorn so, when filtering by amazon within aggs, this is throwing off the min location
remote gust
after I used dropna training_set.isnull().any() returned false for everything
strange stag
when i have both set to false, location is reversed for max/min
remote gust
it's fucking mystifying
strange stag
@remote gust make sure your dtypes are correct
aka if its an object, nothing will work properly
velvet thorn
I'm not sure what you mean
strange stag
@velvet thorn so when i do this
df2k = pd.concat([
    aggs.xs(False, level=0)[[('location', 'min'), ('price', 'min')]],
    aggs.xs(False, level=0)[[('location', 'max'), ('price', 'max')]]
])
(ignore df100, its actually df2k)
macys price is actually 127.00, and walmarts price is 59.99
strange stag
however, when i do this
df2k = pd.concat([
    aggs.xs(False, level=0)[[('location', 'min'), ('price', 'min')]],
    aggs.xs(True, level=0)[[('location', 'max'), ('price', 'max')]]
])
to try and understand why i getting the wrong location min
velvet thorn
like in that case what I think you want is df[df['location'] != 'Amazon'].groupby(['location', 'upc']).agg(['min', 'max'])...?
strange stag
no, what i have previously is correct, cause its grabbing the highest amazon price and the lowest other price, except its just not giving me a matching location to the lowest price (but the lowest price is correct)
(for each upc)
so simplistic view is im buying from other suppliers and selling on amazon, find me the best profits for these products/upc
your previous code is cool, but not what im looking for
remote gust
ok basically
@strange stag all columns are float64, no nans are present
I then got an error about a column with no observed values, I had it print the column in question before imputation and it had all the relevant values
then I check the shape of the output of the imputer and it dropped the colums
I have no clue what is going on
velvet thorn
can you share your code/data
strange stag
ofc
 arctic wedgeBOT
Hey @strange stag!
It looks like you tried to attach a file type that we do not allow. We currently allow the following file types: .3gp, .3g2, .avi, .bmp, .gif, .h264, .jpg, .jpeg, .m4v, .mkv, .mov, .mp4, .mpeg, .mpg, .png, .tiff, .wmv, .svg, .psd, .ai, .aep, .xcf, .mp3, .wav, .ogg.
Feel free to ask in #community-meta if you think this is a mistake.
strange stag
gemme a min ill repo it
velvet thorn
yeah like so
was this right or wrong
https://cdn.discordapp.com/attachments/366673247892275221/669717174083911690/unknown.png

@remote gust can you share your data
and code
remote gust
my data is from a quantopian pipeline
velvet thorn
p sure there's some easily overlooked simple mistake
strange stag
 remote gust
lemme see about it
velvet thorn
@strange stag what was wrong with the image I posted above
velvet thorn
yeah...did you do the ffill/bfill that I suggested
strange stag
yeah
velvet thorn
and what happened
strange stag
didnt work
velvet thorn
what do you mean didn't work
remote gust
what's the best way of sharing it?
velvet thorn
how did you do it?
strange stag
.fillna(method='ffill')
.fillna(method='ffill', axis=1)
.fillna(method='ffill', limit=1)
df.groupby('upc').apply(lambda g: g.ffill().bfill().drop_duplicates())
arctic wedgeBOT
Hey @remote gust!
It looks like you tried to attach a file type that we do not allow. We currently allow the following file types: .3gp, .3g2, .avi, .bmp, .gif, .h264, .jpg, .jpeg, .m4v, .mkv, .mov, .mp4, .mpeg, .mpg, .png, .tiff, .wmv, .svg, .psd, .ai, .aep, .xcf, .mp3, .wav, .ogg.
Feel free to ask in #community-meta if you think this is a mistake.
remote gust
how do I share the thing?
strange stag
pastebin or github repo
@velvet thorn, right, still have the problem of location mismatching tho
upc 890598081013 for e.g
snippet to find the upc
df.loc[df['upc'] == "890598081013"]
taking a look at the real data, this is not true tho
jolly briar
i thought there was a flag in order to shuffle with cross validation in sklearn, seems that i have to use this tho : https://scikit-learn.org/stable/modules/cross_validation.html#random-permutations-cross-validation-a-k-a-shuffle-split
basically i just wanted to repeat model_selection.cross_val_score a few times with shuffling
remote gust

GitHub
Contribute to MostExcellent/pretty-garbage-ngl development by creating an account on GitHub.
it's such a mess it's embarrassing
but this is what I got @velvet thorn
admittedly this is built on really old code out of laziness
strange stag
@velvet thorn happen to have a chance to look at the repo?
@velvet thorn hmm, after starting a new notebook, does look more promising
remote gust
any luck?
strange stag
@velvet thorn ok, please check out my new push https://github.com/nubonics/df
specifically focus_on_filtering.ipynb
or anyone else that would like to help me with pandas 🙂
velvet thorn
sorry kinda busy now
@remote gust you need to upload data too by the way...
it feels like it should work though...
probably I am missing something basic or misunderstanding you, but it doesn't feel that way
remote gust
I realized there is a mistake in ml_inputs_pipeline
I can't just upload data since it's through Quantopian
unless I could maybe output them to a file or something
not sure if I can
unfortunately I can't
jolly briar
Passing list-likes to .loc or [] with any missing label will raise
KeyError in the future, you can use .reindex() as an alternative.
i'm not sure why i'd get that warning here
as in - why would there be a missing label when I've just shuffled on the index 🤔
velvet thorn
@strange stag did you upload data?
@jolly briar print(y.index)
and also print(all(i in y.index for i in selection))
jolly briar
@velvet thorn i think the indexes had gaps... which might be why none of the cv worked earlier 😩
velvet thorn
well, X is accessed with iloc, so that can't be it
had to be y
it is dodgy to use iloc for one and not the other...
and why aren't you using KFold, anyway
jolly briar
i have groups
wanted them in different folds
i mean the same - so the groups are in the same fold rather than split across
idk if that made sense, but that's the reason
it doesn't work with resetting index anyway so phuq it
oh this seems to be working now ... no idea why iloc is needed, it's not in the docs
strange stag
@velvet thorn still busy or?
lapis sequoia
convert it.. import datetime
jolly briar
i want to merge data 1 and data 2 to get data 3
how is this done?
actually i need to change that example
jolly briar
this is what i'm trying to do
note that in the data the Rty isn't so consistent... i thought i might be able to create a merge-id with Rty and P and that it would just handle the duplicates, but this isn't what happened
paper niche
hmm can’t you deduplicate data2 first before doing what you said?
jolly briar
@paper niche yes - i have the same issue though
ok i thought i had done that already but it seems that might be ok 🤔
paper niche
hm if it’s still an issue, I cant quite see it from ur mini example
jolly briar
yeah, maybe there's something else going on , damn
jolly briar
i want to divide group elements in a dataframe by the sum of the group, how can i do this?
i can't think of a nice way to go about it, or to search for it
just so that they sum to 1
lapis sequoia
What does it mean when we say that linear regression only works on continuous data. They can predict only a continuous variable. What do we mean by this?
velvet thorn
@jolly briar df.groupby('col_1').transform(lambda g: g / g.sum())
p sure I answered this before...?
lapis sequoia
Hi everyone, can someone tell me what the advantages are of using R over Python for regression analysis ?
 deft harbor
@lapis sequoia look up the difference between continuous and discrete random variables
jolly briar
I've a dataframe with mixed types, i want to convert the columns with strings to lowercase, is there a simple approach to this?
i just grabbed the columns and selected with loc[ ], could have looped with a try except i guess
velvet thorn
select_dtypes
jolly briar
@velvet thorn ah, nice... though if i want to have the original data kept i'll have to separate and concat back together i expect
i wanted to keep the other dataframe, just lowercase the columns within it which were strings
velvet thorn
str_cols = [col for col, dtype in df.dtypes if dtype == 'object']

df[str_cols] = df[str_cols].apply(lambda s: s.str.lower())
might need to set axis, or might have minor errors, this is from memory
also will only work if you have no non-str object columns
lapis sequoia
I dont get how contour graph works. Is there any link where i can read it up or can someone explain it to me how it works
lapis sequoia
I just finished Python, Pandas and Intro to Machine Learning Kaggle courses. Most Kaggle datasets are already cleaned, so they use less of Pandas and more of ML. I was wondering how to practice the Pandas and Data Analysis skill I learned
I think I found something: https://github.com/guipsamora/pandas_exercises

GitHub
Practice your pandas skills! Contribute to guipsamora/pandas_exercises development by creating an account on GitHub.
 hasty maple
what was covered in the intro to ML course?
lapis sequoia
@lapis sequoia Thx dude! I’m saving that
is there something like a stop-marker you can set in the jupyter notebook to make it run all the whole notebook but only up to that mark?
i don't want to run every line, but the code is also not ready yet to run the complete thing after restarting the kernel
ah there is a "run all cells above" function... awesome ^^
lapis sequoia
Learn the core ideas in machine learning, and build your first models.
hasty maple
ah so decision trees and random forests regressions
You can try https://www.kaggle.com/rtatman/datasets-for-regression-analysis these datasets

Explore and run machine learning code with Kaggle Notebooks | Using data from no data sources
lapis sequoia
rookie question here
L1 = seg.loc[(seg.LINE == 1) & ((seg.EVENT_TYPE==10) | (seg.EVENT_TYPE==50))]
i guess the last two filtering options can be consolidated to something like =={10, 50} or [10, 50]
i'm always confusing when to use which brackets... does someone have a catchy memory hook or something?
lapis sequoia
is there any way to ffill with strings instead of integers ?
 proper coyote
@strange stag dont ask if anyone can help, just ask the question and wait for someone to respond ; you'll probably get a response
lapis sequoia
Let's assume this does what I want it to do:
df.loc[(30064857037, 7177), :].sort_index() where "30064857037" represents one single service_id and "7177" represents one single train_id.
Now I would like a function that does exactly the same for every number "i" in service_id and every number "j" in train_id
can anyone help me to code such a loop? if it is called a loop.. i don't know?!
oblique belfry
It is easy to create visualizations in python for data science projects. However, I need to create these same visualizations for a web app. I specifically need to create a confusion matrix.
Do you know of any good implementations of this in JavaScript? Or are there other ways you create you visualizations for web apps?
 chrome cliff
Would this be best place to ask for help with Pandas or would it be better in one of the help channels?
strange stag
@chrome cliff no, this is the place
chrome cliff
I posted in #help-grapes as I wasn't sure. Should I move it here and delete that post?
chrome cliff
Hi new to programming.
Trying to use Pandas to process a Excel spreadsheet sheet.
Imported to a dataframe.
I can use a dataframe.query() to extract all row df = df.query(('column.str.contains("text") ) & (colum2 != "some text i put here" )')
I have a column called Version which data type is an object which holds version numbers.
I cannot do & (~colum.Version.str.contains("5.123"). To say
And not where version = "5.123"
Everywhere says to use ~ as not.
I tried lots of different ways to achieve this but I am now confused as to how it works and pandas documentation is not very easy for me to understand
The != Doesn't work on the column like it worked for another column
I tried to cast the coloumn to a int64 but now as I write this that failed becuase its a float type I think
Nope so dataframe['Version'] = dataframe['Version'].astype(float)
results in a valueerror: could not convert string to float: 'Applicnce'
chrome cliff
Hallalua I think I solved it.
df['version'] = pd.to_numeric(df['version'], errors='coerce')
this convets the column to a numeric type which I can then say
.query('version >= 3.123')
Ah man so I was missing the pd.to_nuric I done df.to_numeric when I tried before. So happy I solved it. 3 days I been trying this
lapis sequoia
congrats :p I've been dealing with one problem for weeks now
a beginner myself, but i found that most of the times you work with integers you need to leave out the quotation marks
i.e. if you filter by specific value
chrome cliff
Yeah now I just realized it's not what I need I don't think. Will have to speak to a colleague.
There are some string values in that column I wasn't aware off.
I was told ignore anything below version 5.
I learned something at least so not a total bust
lapis sequoia
bump
Let's assume this does what I want it to do:
df.loc[(30064857037, 7177), :].sort_index() where "30064857037" represents one single service_id and "7177" represents one single train_id.
Now I would like a function that does exactly the same for every number "i" in service_id and every number "j" in train_id
can anyone help me coding such a loop?
trying to apply fillna(method="ffill") by grouping the data together by both ID types
if anyone has an easier/smarter way, I'm thankful for any advice
 real wigeon
hey so
i have a bit of a pandas question
usecols
currently i am having people fill out an excel file, which I run through a script.
I use the usecols argument
it was suggested that I find a way to use header names instead, in case someone messes with the excel file and adds columns
I can't seem to find a useheaders call
I did find index_col
lapis sequoia
Anyone know MySQL here?
chrome cliff
@lapis sequoia I done a little bit of it before. I can give it go
@real wigeon in the read_excel() you can spesifiy the usecols paramater.
read_csv('file.xlsx', usecols='A:E' ) use columns a,b,s,d,e.
You could also pass it a list of strings usecols=['col1' , 'col4',]
then
df = pd.read_csv('file', usecols=['col1' ,'col4',])
df.head()
real wigeon
I didn't try to make a list out of it. Maybe I'll try that
chrome cliff
I got this from the docs. I havn't done it myself
but i am failry confident it should be like that
chrome cliff
any joy @real wigeon
 jovial river
Can anyone explain to me what is the difference between using PCA vs data cube aggregation for dimensionality reduction?
jovial river
Would it be right to say that PCA is more for feature projection compared to aggregation by data cubes which is more about feature selection?
lapis sequoia
I want to find the maximum value in a coulmn. Trouble is coulmn is made of lists, not integers
df.column_name.max() does not work
 pearl kiln
any projects to understand basic of sklearn
lapis sequoia
@pearl kiln I think any Kaggle Project wil do that
 merry wind
Recommendations on a book about machine learning in python for someone new to machine learning? I was suggested The 100 page machine learning book already and was wondering if that is a good place to start or if there is a better suggestion that uses python mainly in examples and an easier read not too dense
deft harbor
This is the book I started with: https://faculty.marshall.usc.edu/gareth-james/ISL/
The labs are in R, but you can pick up a bunch of oreilly books to learn the libraries.
 vital cipher
@merry wind i use oreilly machine learning with keras and sklearn book...kind of helpful 🙂
deft harbor
How deep does it go in terms of math and stats?
 jaunty vortex
Hello there. I am looking for some feedback on worldmap graphics libraries. I am looking for an lib that would be easy to implement and yet mordern looking. As of now, I am looking at pygal and plotlib. Any advice would be welcome.
I am not looking into any GIS capabilities like rasters or whatnot at the moment.
lapis sequoia
@jaunty vortex try plotly it's the absolute best in terms of plotting with maps. Much simpler than matplotlib, too (IMO)
I need to do a complex merge as in merging two datasets on their timestamps, like for example 23:50 and 23:50. However, if the second dataset does not feature any column value of 23:50, it's supposed to take a row with timestamp column value 23:49, or 48, 47, 46, 45, ... 40 whatever the next closest value is.
Does anyone have an idea how to realize that? Pleeeeeeeeeeaaaase
and if there isn't any near timestamp to merge on, it should just assume 0 for the column that is to be merged (instead of using the value of the nearest timestamp)
lapis sequoia
Like so:
The column-value that I'm trying to join my first dataset is marked with red color. It is supposed to merge the 23:50 timestamp. However, since there is no 23:50 timestamp it is supposed to take the row that features the nearest earlier timestamp-value which is 23:47 in this case.
If that again wasn't there, it should take 23:46 and so on.... Help is much appreciated!
 dense shard
Hello everyone! Anyone willing to help me in my problem about Unet? The output seems buggy, cause prediction results are always grey.
 supple ferry
Hey there!
I am working on choice modeling with consumer electronics. I am willing to use a two-stage modeling approach where in fist stage I aim to find the brand of the product and in the second stage I want to find the product model the customer is likely to purchase. My initial idea is to have two types of probabilities for each stage and then just multiply them which is used in literature too.
Setps:
1. Get brand probabilities
2. Get product probabilities within every brand
3. Combine those two probabilities simply by multiplication
For the first stage I plan to use brand meta characteristics and for the second one I plan to use device characteristics.
Is there any other way of combining those two stages except the one that I mentioned? Thanks!
 uncut shadow
Hey! Do you know any good resources/tutorials etc. for implementing your own ML models from scratch in Python? (Just in-built libs and numpy)
lapis sequoia
Hey, anyone here with pytorch experience? More specifically regarding torchtext?
my LABEL.vocab.stoi seems to be empty and i cannot figure out how to fix this defaultdict(None, {})
I am following this tutorial (https://github.com/bentrevett/pytorch-sentiment-analysis/blob/master/5 - Multi-class Sentiment Analysis.ipynb) with my own dataset and i noticed that his Out[2]: {'text': ['What', 'is', 'a', 'Cartesian', 'Diver', '?'], 'label': 'DESC'} shows 'DESC' without paranthesis, while in my code it shows: label': ['nnnny'] with paranthesis
@uncut shadow sentdex is working on a book/video series called Neural Networks from scratch
lapis sequoia
ok, so i tried a different code, but now i have this issue and don't know how to change the kernel size:
Calculated padded input size per channel: (1 x 300). Kernel size: (3 x 300). Kernel size can't be greater than actual input size
Anyone knows how to fix this?
These kernel sizes are put into the kernel size: [3, 4, 5]
But: When i change them to [1, 1, 1], i get CUDA error: device-side assert triggered
deft harbor
Haven't started with pytorch yet
lapis sequoia
Can someone help me? https://stackoverflow.com/questions/59952019/how-to-parse-more-data-with-tweepy-after-getting-first-50-pages
Stack Overflow
this is my current code and everything is working:
tweepy.Cursor(api.search, q='Miami -filter:retweets', wait_on_rate_limit=True,count=200, tweet_mode="extended", include_rts=False, since=start_da...
hasty maple
@lapis sequoia did you use the correct pretrained embedding matrix? cell 3 has vectors = "glove.6B.100d" and you're using 300d embeddings in the error message you showed
lapis sequoia
Hey, I want to create a new column in my dataset that takes the row value of column2 if there is NaN in column1.
This should be the appropriate code.
df["combined"] = df.where(~df["column1"].isna(), df["column2"], axis=0) --- /edit: bracket typo corrected
But I'm experiencing an error:
ValueError: Wrong number of items passed 40, placement implies 1
any suggestions?
I'm also getting a positive warning, probably because of datetime format in the corresponding columns
wait... there is a mistake in the command
 feral lodge
Wrong bracket type after "where"
lapis sequoia
true, I used in fact ()
@feral lodge brackets are correct in my code. Getting the error anyway... could datetime format be the reason?
i tried switching the axis, but 0 is correct
feral lodge
I'd do it like this:
df['c3'] = df['c1'].where(~df['c1'].isna(), df['c2'])
lapis sequoia
right
feral lodge
Sorry about the formating, discord is blocked at work, so I'm on my phone 👴📱 that code works as intended for me
feral lodge
Happy to help 👴
 steel roost
guys
how would i export the text values from selenium to then add it to a list?
driver.get(user_link)
username_field= driver.find_element_by_name('USERNAME').send_keys(users[3])
search = driver.find_element_by_name('SUBMITVALUE').click()
# table = driver.find_element_by_id('itemtable-table')
driver.find_element_by_xpath('//*[@id="itemtable-table"]/tbody/tr/td[1]/span/span/a').click()
##################
#after clicking update
driver.find_element_by_name("EMAIL")
i want to export the email to EMAIL =[]
 buoyant vine
i've done a project just like this but im not on my pc atm so i cant tell you the exact code
maybe try email_driver = driver.find_element_by_name("EMAIL")
EMAIL.append(email_driver)
oh and if you want to get the text values then before the email append part you do driver.getAttribute('innerHTML')
supple ferry
@uncut shadow , there is a github repo which has most of them written in numpy. Yet, if you want to do it on your own, it is possible too. Find the math formulas and implement yourself
uncut shadow
@supple ferry Do you have a link for that repo?
supple ferry
@uncut shadow https://github.com/eriklindernoren/ML-From-Scratch

GitHub
Machine Learning From Scratch. Bare bones NumPy implementations of machine learning models and algorithms with a focus on accessibility. Aims to cover everything from linear regression to deep lear...
lapis sequoia
Guys, is it possible to set up 2 columns as a multi index, to sort by them and fill missing values (so virtually a groupby, just without fiddling with the length of the dataset) and remove the Multi-index at a later point again?
supple ferry
yes it is 🙂
you can do it all in one command with chaining the functions
this might give you ideas
(df
  .setmultiindex
  .sort
  .fillna
  .reset index
  .some other function
)
it is a pseudo code, will look like this 🙂
lapis sequoia
thanks
the problem with groupby is, that it requires any aggregate command like .sum or .mean etc does it not?
I need to keep the dataset in full length, to fill all the missing values and in a best case, go back to the initial format/sort sequence
i can groupby 2 or 3 columns, but the length of the dataset will then be reduced by 95% (from 1.136million rows to 54k rows)
if i try to unstack the grouping df.unstack() then i'll get an error: ValueError: Index contains duplicate entries, cannot reshape
@supple ferry
jolly briar
@lapis sequoia might need some data as i'm not sure i follow, maybe others don't either
lapis sequoia
@jolly briar this is just an extract of a few columns to make it easier to follow. But this is how the ungrouped dataset looks like
as you can see in the start_station column is NaNs everywhere
now, what I need to get to is looking like this (I was using groupby)
if it was ordered like that, I'd be able to forward-fill the missing values
however, I don't seem to get back to original form then.... as the length of the dataframe is shortened and basically screwed?!
namely, if I use df_g.unstack() I get the error: ValueError: Index contains duplicate entries, cannot reshape
🤔 🥴
filling the values is no problem in that format, but unstack() doesn't work and with reset_index() i end up with only 53,000 rows instead of the original 1.136million
jolly briar
@lapis sequoia meant data people could run.... if it's like that someone will probably have a punt.
you might be able to do this with a merge or something though, it seems that <service_id>-<train_id> represent a particular value of start station
so you might be able to create another dataset from the drop, drop the NA's, then merge back in on <serv>-<train> for the start stations
paper niche
@lapis sequoia df.groupby(..).transform('nth', [0,1]) ? not quite sure what you want to do, but transform allows you to perform groupby/agg and retain the original df shape.
lapis sequoia
@jolly briar sounds complicated, but will look into it
@paper niche thanks, how come you suggest nth [0,1] ?
lapis sequoia
I used 0, 100 but that's bad practice i reckon
i know there are less than 100 events in every instance, so that seemed to work to show how i would like the result to look like
i tried using the transform command before, but it didn't work as intended
i'f i'm doing as you suggest, i only get a list, nothing is filled though
and all other columns are gone
regarding the question what I want to do:
I've managed to get the first station for every train and every train-line into the column start_station . However, that's literally only for the first train-event. I need to fill the whole column for each service_id and each train_id with the code for its first station (like the second screenshot suggests)
jolly briar
why not make an example people can run, might be easier
lapis sequoia
why i need that? because ultimately I'll need both columns, start_station and end_station to "feature-engineer" a directional index
so, to cut a long story short, my ultimate goal is to make a column [DI] which is +1or -1 for any instance, to indicate whether a train on LINE X goes from station A to station Z or from station Z to station A.
paper niche
@lapis sequoia in short you just want the start station to be filled with the first row‘s value in every partition of (service_id,train_id)?
lapis sequoia
obviously that information could be deducted much easier, BUT the problem is, not every train on line X goes from A to Z.... some have a later start_station and an earlier end_station. So basically on some days or some hours of the day, the train would start from C instead of A, and only go to U instead of Z.
@paper niche EXACTLY!
paper niche
hmm then what’s the 100 for? o.o
lapis sequoia
i want that for every service_id, let's say 34687534578, and every train_id, let's say 7070, to have it's first station filled throughout all stop_sequences... 1, 2, 3, .... , n
paper niche
df.groupby(...).transform(‘nth’,0)?
lapis sequoia
that didn't work for me, but i have to check what the problem was
paper niche
what does that give you? (it’ll be much simpler if you can just provide a small example as rie siggested tbh)
u’re gna have to be more specific abt what doesnt work means
jolly briar
we went over how to create a small example using json the other day
lapis sequoia
obviously... but I'll have to check in the code what the problem was... give me a second
jolly briar
just a little dict that can be uploaded... or maybe there's a better way, i usually use a dict to pass around df's tho
paper niche
we don’t even need your real data. just df with columns A, B, with data filled in using np.random.rand() would be sufficient... ur question is essentially: how to get first row in groupby partitions and fill it in the rest of the rows
lapis sequoia
basically, yes
jolly briar
what i sometimes find easy is something along the lines of df.head(n).to_csv('blah.csv') and then edit what's needed to remain in excel, n is large enough to be representative... but make sure the final result contains the smallest possible amount of data to represent the problem
lapis sequoia
ok, so yeah the transform('nth', 0) basically gives exactly the same column i already have... but the rest of the NANs become not filled. I think the point there is, that it only groups STOPSEQUENCE_NO "1", and disregards 2, 3, ...., n
see
see there is the problem
paper niche
why are u grouping by stopsequence again?
lapis sequoia
give me a second
jolly briar
i'm too tired to read all this 😛 if there was data i would have run it tho
lapis sequoia
@jolly briar i just made a csv
jolly briar
it also seems like this has been going on for ~ 5 hours? Honestly, if you create a mwe there's more chance people will try, and that they'll understand better
well yeah - it's gone 1 am here tho, so maybe tomorrow
lapis sequoia
but i think it might actually work.... I can't seem to identify the problem i found earlier
maybe i made a mistake
jolly briar
point is that if you'd made a csv 4 hours ago it'd probably be ok now that's all
paper niche
i’m reaching work soon, so i wont be able to help for much longer too
 unique forge
hello i am looking for some help with sqlite
paper niche
@lapis sequoia i’ld really recommend deeply thinking abt what your problem really is and filtering to the most simple question/mwe. like i said earlier, ur question doesnt need all the complications of start/stop id etc..
gotta go 🙂 good luck
lapis sequoia
thanks man, appreciate it
jolly briar
@lapis sequoia does it really need to be 300 rows?
lapis sequoia
well, i wanted to make sure that several service_IDs and train_ids with full sequence number and different dates are incorporated in the dataset... because that is the actual tricky part
jolly briar
The important feature of a minimal working example is that it is as small and as simple as possible, such that it is just sufficient to demonstrate the problem, but without any additional complexity or dependencies which will make resolution harder
do you need several? Or would two be enough? Do you need more then two rows for each of the service_id and train_id combinations? do you need all of the columns?
lapis sequoia
you have to consider that neither service_id nor train_id are unique values.... they appear repeatedly
the same line, same train id, same service id can pretty much ran every day.... the data is very complex and it's hard to explain
jolly briar
they're repeated yes so why wouldn't two rows be enough
why do you need 30 rows of the same service id / train id combo
lapis sequoia
ultimately, i need all of the columns and all of the rows, yes. in fact, the actual dataset has more than 30 columns... at least 15-20 of them i'll have to use
jolly briar
why do you need 30 to represent the example though
lapis sequoia
i already condensed it to a small part here
jolly briar
of the same service id and train id combo
again, why 30 instead of 2
i see no reason
lapis sequoia
what are we debating about here?
jolly briar
ultimately, i need all of the columns and all of the rows
ultimately yes, that's not the point for a mwe
what are we debating about here?
i'm not sure you understand the point of a mwe / what it entails
lapis sequoia
well i wanted for you to experience that the problem was complicated.... you could just define a new dataframe with head(40) or whatever you please.... so what's the point in arguing here?
jolly briar
part of the point of a mwe is that unnecessary complication is removed, and you've still not answered my question about 30 rows of the same id combination
lapis sequoia
you can reduce it in less than 5 seconds, but if you'd need more data, I'd need to recut and reupload it again... i don't see a problem
jolly briar
you can reduce it in less than 5 seconds
no - this is not the point - the point is that you deliver the smallest possible example. And again, why 30
but if you'd need more data
the point of a mwe is that the smallest necessary amount of data is provided
lapis sequoia
i told you, to show the complexity of the dataframe... it's hard to gauge if all of the filled values are correct with too small of a cut
jolly briar
python can as easily fill 2 as 2000 rows, they're not as easy to pass around and get a quick handle on though
it's hard to gauge if all of the filled values are correct with too small of a cut
in what sense? seems that if 2 are done it would extend to 20, 200, 2000, etc
lapis sequoia
well, i didn't say it was a problem for python. i said it sometimes was a problem to see if everything worked out as it was supposed to
but this discussion doesn't help anyone
jolly briar
it'll work out if the data is representative
it will help you if you understand, as it'll save you half a day
that's up to you though really
lapis sequoia
well, the discussed method filled about 70,000 rows
but 1million are still missing
i don't know why. maybe it is because in some occasions the event of the train starting is missing (but I can't believe that problem would occur so frequently)
@jolly briar for some IDs just everything is still 100% filled with NaNs... if I only used a minimum amount of data, I'd probably not even meet that problem. Point is, i still haven't identified why it works for some part and not for the other.
 misty lake
Im lookig for an answer to this question
https://datascience.stackexchange.com/questions/67095/building-search-engine-using-vector-space-model-using-a-private-database

Data Science Stack Exchange
Im trying to build a search engine for a private dataset using vector space model and have encountered following problem.
Dataset
Dataset is private. It is a collection of unstructed pdf .
I have
@lapis sequoia here you go 🙂
lapis sequoia
so essentially you want a QA system
there's a lot of unnecessary details here..
- Your model is not your area of focus, solving the problem is. 2. Split it up into meaningful chunks; for example the info that it's coming from a pdf has nothing to do with making a QA system.. 3. Assuming that the method you're using is the way to do this
now.. let me see what's a possible way to tackle this better
misty lake
@lapis sequoia Not really a QA system. What im trying to do is a search engine that gives the answers from a private dataset.
But the dataset is kind of complex
I hope you have read it from stackexchange
lapis sequoia
give me an example of what's in one row of the dataset, tell me whether it's uniform and give me an example of a query
if XYZ test is part of the query, I'm guessing it's part of the list of fields in your dataset too.. so that's a filter.
that will make things easier to compute distances and find the most similar result from the rest of the search space
uncut shadow
Hey. What math skills do you think are required to be able to build your own ML algorithms and stuff like that?
Also do you know any good courses for this required math?
misty lake
Hey @lapis sequoia Sorry for the late reply , I was busy at work.
A row in the dataset might look as follows
https://jsonblob.com/4ba76936-429e-11ea-bdd3-316e38de44c5
And the user will be querying something like as follows
design pressure 6 barG and molecular weight used is 16.68 when Mothiram Pandidhurai is used This should result ABC Project with some query matchiing percentage . ie Rank some near documents with some order
lapis sequoia
@lapis sequoia my question still stands, if you're bored ^^
buoyant vine
hey guys
I'm training a model based on random forest and i have this line
features = ["Pclass", "Sex", "SibSp", "Parch", "Embarked", "Fare"]
i cant simply use because some values in the "Fare" column contain NaN values
how do i drop those values so this would work?
 worn stratus
Assuming you have pandas, I think theres a .dropna() method that can drop rows with empty NaN values
If not, SKLearn as imputation support, so there's probably something that can remove values as well
 coral yoke
though i would suggest rather deciding on if you would like to replace those empty values with something that can be useful to the algorithm
and yes, pandas has a simple dropna method
buoyant vine
it still doesnt work somewhy
coral yoke
pass inplace=True
buoyant vine
train_data.dropna() still returns Input contains NaN, infinity or a value too large for dtype
coral yoke
99% of pandas methods returns a new dataframe
buoyant vine
ok will try
buoyant vine
still throws the same error and i dont know why
df = train_data.dropna() my code should be this right?
lapis sequoia
Quick question:
when dealing with predictive regression, how do you handle dummy variables?
Is it better to just leave them as "int64" or format them as "category"?
Hey guys, i am trying to install torchtext on my google cloud server (IT WORKED PERFECTLY FINE YESTERDAY -.-) with this: !pip install https://github.com/pytorch/text/archive/master.zip --user and now i get ```---------------------------------------------------------------------------
ModuleNotFoundError Traceback (most recent call last)
<ipython-input-16-45fb92b58e62> in <module>
5 from numpy.random import RandomState
6
----> 7 import torchtext
8 from torchtext import data
9 from torchtext.data import Field
ModuleNotFoundError: No module named 'torchtext'```
Anyone an idea how to fix this?
vital cipher
@lapis sequoia check the version of python and pytorch version....rest dm me if still u have that issue 🙂
oblique belfry
https://github.com/explosion/thinc
Interesting project. I like the type sytem for ML. Python types hints save my butt a lot. However, I wonder how much overhead this library brings on top of TF or Pytorch.

GitHub
🔮 A refreshing functional take on deep learning, compatible with your favorite libraries - explosion/thinc
lapis sequoia
bump
Quick question:
when dealing with predictive regression, how do you handle dummy variables?
Is it better to just leave them as "int64" or format them as "category"?
when X are my independent variables, i'm going to divide them into X_num and X_cat with sklearn preprocessing... whereas X_num will be scaled by sklearns standardscaler... I reckon since there are only 0 and 1s in my Dummy variable columns, it should work to leave them in the X_num part, right?!
X_cat will be stuff like weekdays, that have to be encoded with sklearns One_hot_encoder
vital cipher
@lapis sequoia keeping it categorised would be better choice
lapis sequoia
ok
makes sense
is there a trick to integrate the one_hot_encoded variables into a full overview of the X-dataframe?
because I reckon that would make it much easier to explain the model later
@vital cipher
i mean, since one_hot_encoder only gives a sparse matrix... which I then can transform to an array
 lusty cairn
trying to pull large amount of data from a large number of sources of different file types and import them into a single database with a singular format
anyone here worked with this?
 jade chasm
I have a DS related question, this channel seems busy. Should I refer to help?
Guess not, here it goes.
Im trying to predict the chance of a binary variable being 1 or 0. The problem I'm having is that my prediction isnt the actual chance, but the prediction itself so to say..
for instance:
def salary_predictions3():
    df = pd.DataFrame(index=G.nodes())
    df['ManagementSalary'] = pd.Series(nx.get_node_attributes(G, 'ManagementSalary'))
    df['Department'] = pd.Series(nx.get_node_attributes(G, 'Department'))
    df['clustering'] = pd.Series(nx.clustering(G))
    df['degree'] = pd.Series(G.degree())
    dfnoNA = df.dropna()
    Y = dfnoNA.iloc[:,0]
    X = dfnoNA.iloc[:,1:4] #predictor
    from sklearn.neighbors import KNeighborsClassifier
    knn = KNeighborsClassifier()
    knn.fit(X, Y)
    dfpredictthis = df[df.isnull().iloc[:,0]]
    dfpredictthis = dfpredictthis.drop(['ManagementSalary'],axis=1)
    dfpredictthis['ManagementSalary'] = knn.predict(dfpredictthis)
return dfpredictthis.iloc[:,3]```this gives:
which is great, but thats the actual prediction. How can I find the chance of the prediction being 'valid'?
I dont really care if I need to use another type of classification model such as randomforest, just looking to get 0-1 percentages.
dense shard
Hello guys! Can anyone help me in turning this model
def get_unet(input_img, n_filters=16, dropout=0.5, batchnorm=True):
    # nandito yung contracting path
    c1 = conv2d_block(input_img, n_filters=n_filters*1, kernel_size=3, batchnorm=batchnorm)
    p1 = MaxPooling2D((2, 2)) (c1)
    p1 = Dropout(dropout*0.5)(p1)

    c2 = conv2d_block(p1, n_filters=n_filters*2, kernel_size=3, batchnorm=batchnorm)
    p2 = MaxPooling2D((2, 2)) (c2)
    p2 = Dropout(dropout)(p2)

    c3 = conv2d_block(p2, n_filters=n_filters*4, kernel_size=3, batchnorm=batchnorm)
    p3 = MaxPooling2D((2, 2)) (c3)
    p3 = Dropout(dropout)(p3)

    c4 = conv2d_block(p3, n_filters=n_filters*8, kernel_size=3, batchnorm=batchnorm)
    p4 = MaxPooling2D(pool_size=(2, 2)) (c4)
    p4 = Dropout(dropout)(p4)

    c5 = conv2d_block(p4, n_filters=n_filters*16, kernel_size=3, batchnorm=batchnorm)

    # nandito naman yung expansive path
    u6 = Conv2DTranspose(n_filters*8, (3, 3), strides=(2, 2), padding='same') (c5)
    u6 = concatenate([u6, c4])
    u6 = Dropout(dropout)(u6)
    c6 = conv2d_block(u6, n_filters=n_filters*8, kernel_size=3, batchnorm=batchnorm)

    u7 = Conv2DTranspose(n_filters*4, (3, 3), strides=(2, 2), padding='same') (c6)
    u7 = concatenate([u7, c3])
    u7 = Dropout(dropout)(u7)
    c7 = conv2d_block(u7, n_filters=n_filters*4, kernel_size=3, batchnorm=batchnorm)

    u8 = Conv2DTranspose(n_filters*2, (3, 3), strides=(2, 2), padding='same') (c7)
    u8 = concatenate([u8, c2])
    u8 = Dropout(dropout)(u8)
    c8 = conv2d_block(u8, n_filters=n_filters*2, kernel_size=3, batchnorm=batchnorm)

    u9 = Conv2DTranspose(n_filters*1, (3, 3), strides=(2, 2), padding='same') (c8)
    u9 = concatenate([u9, c1], axis=3)
    u9 = Dropout(dropout)(u9)
    c9 = conv2d_block(u9, n_filters=n_filters*1, kernel_size=3, batchnorm=batchnorm)

    outputs = Conv2D(1, (1, 1), activation='sigmoid') (c9)
    model = Model(inputs=[input_img], outputs=[outputs])
    return model
into a build_model, something like this
def build_model():
        model = Sequential()
        model.add(Conv2D(32, kernel_size=(3, 3),
                     activation='relu',
                     input_shape=(192, 9, 1)))
        model.add(Conv2D(64, (3, 3), activation='relu'))
        model.add(Conv2D(64, (3, 3), activation='relu'))
        model.add(MaxPooling2D(pool_size=(2, 2)))
        model.add(Dropout(0.25))
        model.add(Flatten())
        model.add(Dense(128, activation='relu'))
        model.add(Dropout(0.5))
        model.add(Dense(21 * 6))  # no activation
        model.add(Reshape((6, 21)))
        model.add(Activation(softmax_by_string))

        model.compile(loss=catcross_by_string,
                  optimizer='Adadelta',
                  metrics=[avg_acc])

        return model
@dense shard i would highly advise, if you're having trouble transferring that, to get more used to python and keras before jumping into that
lapis sequoia
@vital cipher Thank you! I fixed it.
For all the others: The trick is not to import torchtext but to use from torchtext import data
jolly briar
is it possible to have side by side plots using df.var.plot() rather than the standard plt.( .. ) ? I can find info on the latter, but not the former.
jolly briar
plt.subplot(1,2,1)
this works fine
 silent swan
I usually create subplots and give the desired axis to the relevant df.plot function
jolly briar
@silent swan oh ok, i didn't realise this was a thing, it's not in the doc 😦
thanks 🙂
 random hound
any numpy experts on right now? roll = numpy.random.choice([0, 1], size=(1,), p=[19./20, 1./20]) returns an array in the terminal but the very same line of code in my function which is literally just that one line + a return roll returns an int. why is that happening? have I gone nuts or something?
def rollme():
    roll = numpy.random.choice([0, 1], size=(1,), p=[19./20, 1./20])
    return roll
 slim lance
Hey so pandas is probably overkill for my little hobby project, but since I needed a library that could deal with CSV and XLS, AND pandas has a rep for being hard to learn, I decided it was the right approach for me. (Plus it doesn't hurt that it has rep as a great tool to know.)
So my use is that I have three files:
- CSV with a full list of all video games every published for consoles. (with some pricing data) (51878 rows)
- CSV with an inventory of all the games I own. (3139 rows)
- XLS with a list of a store's full inventory of games they have for sale (7849 rows)
My project is to take a subset of #2 limiting it to a single console, and finding the list of game for that same console in #3 that I currently do not own and generating the list of games I want to buy. The next step would be to cross reference that against #1 to get a fair market value.
So far I've figured out how to load three data frames with just the data for the console I want., using read_*(), loc() and copy(). I've also figured out how to somewhat clean the data from #3 as it had weird embedded strings in the game titles, that I used str.replace to remove. My next thing I want to do is to generate the list of games #3 that aren't in #2, bearing in mind that the column names are different in both data frames ('Title' vs 'product-name'), and also bearing in mind that there may be subtle differences in how the names are represented. 'The Awesome Game', might be 'Awesome Game' or 'Awesome Game, The'. (Think movie databases, and you'd have the same kind of issues.)
misty lake
Does anyone have any clue to solve my question ? Any approch suggestion would be appreciated
https://discordapp.com/channels/267624335836053506/366673247892275221/672077465631588362
slim lance
I guess for the next step I need to merge #3 with #1 to get a list of IDs? IE: Everything in #3 should have a corresponding entry in #1, and #1 and #2 are from the same data source, so once I have a key, I should be good to do the comparison between #2 and the matched set.
So yeah. I want to compare #3 with #1 and have two resulting sets. things in #3 that exist in #1 (this is clean data) and things in #3 that don't exist in #1. (This is dirty data that will require manual intervention)
if it turns out there is a lot of dirty data, maybe I should use fuzzywuzzy?
misty lake
Someone please tag me when asnwers my question
 random bolt
I'm not familiar with pandas, but I can vouch for fuzzywuzzy for string matching.
slim lance
Yeah, I think I want to use fuzzywuzzy with pandas, to just compare the list of things I have against the list of things that are available.
 plain turret
@slim lance there might be some manual cleaning of the dataset before merging but pandas seems the right choice for merging like you describe. I don't think it's particularly overkill, what you try is complex enough.
buoyant vine
Hey guys
this is my current code, which doesn't seem to work, because numpy.AxisError: axis 1 is out of bounds for array of dimension 1 I don't insist using this same code, so how do I save my test results to a .csv file?
regress = RandomForestRegressor(n_estimators=20, random_state=0)
regress.fit(x_train, y_train)
results = regress.predict(test)
results = np.argmax(results, axis=1)
results = pd.Series(results, name="Label")
submission = pd.concat([pd.Series(range(1, 28001), name="ImageId"), results], axis=1)

submission.to_csv("submission.csv", index=False)
 lyric kernel
How to do i not fit one value but a whole row of a pd.dataframe into a machine learning algorithm ?
I have logs of events that i try to classify, but i don't know how to pass the whole event as 1 instance. Tutorials always have some x & y values which are single integers. I need it to be np.arrays i guess
plain turret
it's hard to answer because "into a machine learning algorithm" is kinda vague
i think most of the libs handle dataframe and numpy as input
at least scikit learn does
you should look into the documentation of your choice
there is always ways to convert df into series or np arrays i believe
example : linear model https://scikit-learn.org/stable/modules/generated/sklearn.linear_model.LinearRegression.html
lapis sequoia
Can someone quickly help me understand this sklearn documentation?
https://scikit-learn.org/stable/modules/generated/sklearn.compose.ColumnTransformer.html
I have a pipeline process set up for numerical variables and ordinal or 1hot-dummy variables that need to be transformed.
However, I have a certain list of finished dummy variables that don't need to be transformed at all.... would I need to just set remainder="passtrough" to keep them or is there a way to explicitly list them to passthrough?
The part that I don't fully understand is this:
By specifying remainder='passthrough', all remaining columns that were not specified in transformers will be automatically passed through. This subset of columns is concatenated with the output of the transformers. By setting remainder to be an estimator, the remaining non-specified columns will use the remainder estimator.
Hi, I'm working on this dataset: https://www.kaggle.com/roccoli/gpx-hike-tracks
I've sent image of my correlation matrix.
Does anyone think I can do anything more with this dataset before actually training and what would you thoughts be how to proceed later on?
My goal is to predict where the person will be located if she started at point X after period of time Y depending on the terrain the person is hiking.
Thanks in advance 🙂

~12000 GPX files and associated meta data of mountain hikes
I guess in my case I would need to set remainder=estimator?
@lapis sequoia cool project. is that for a website or hiking app? can't comment on how to proceed.. i'm a beginner myself. But why not just train the model and see how it performs
i imagine the fitness of the hiker would be an interesting feature for accurate prediction, as the variety is probably rather high. if there is no data, maybe age of the hiker could function as a predictor for fitness.
 dire copper
jolly briar
dire copper
jolly briar
is there a nicer approach than the following :
df.x = df.x * 0.01
 silk acorn
df.x *= 0.01?
jolly briar
yeah fair, i was wondering if there was something that was more typically pandas or something, but using apply( ) didn't really seem to make anything better
lapis sequoia
bumping
https://scikit-learn.org/stable/modules/generated/sklearn.compose.ColumnTransformer.html
anyone able to help with that "passthrough" / estimator thing?
remainder="passthrough", ^ SyntaxError: invalid syntax
neither one, nor the other option seems to work for me NameError: name 'estimator' is not defined
 obtuse skiff
Would a k80 or a 1080ti be better for gpu processing for pytorch. (The k80 is on google collab)
oblique belfry
So...looks like OpenAI is migrating to Pytorch.
 dawn kayak
4992 NVIDIA CUDA cores
Up to 2.91 teraflops double-precision performance with NVIDIA GPU Boost
Up to 8.73 teraflops single-precision performance with NVIDIA GPU Boost
24 GB of GDDR5 memory
480 GB/s aggregate memory bandwidth
ECC protection for increased reliability
vs
3584 NVIDIA CUDA Cores
1582 Boost Clock (MHz)
11 Gbps Memory Speed 11 GB GDDR5X
352-bit Memory Interface Width
484 GB/sec Memory Bandwidth
i assume double precision means degree of floating number precision, which geforce cards aren't designed for, and that ECC memory is critical for enterprise level
silent swan
k80 is pretty old
dawn kayak
i assume amd is out of the question for any choices out there
k80 then is still better price wise than tesla V100 -> ~$1000 vs ~$4000
silent swan
it's also 3 architecture generations older
obtuse skiff
I have the 1080ti existing for gaming, but have acess to the k80 via google collab. Just curious if it was worth setting up that account for it or not. Id perfer to just use mine otherwise. @dawn kayak
@silent swan
silent swan
1080ti is pretty good for NN training
unless you're using a particularly large model
dawn kayak
then the question price wise is which one is better, ~$1K vs free
or byway of gcollab = free(?) vs free, which means it's about hardware spec
the answer is always relative to specifics, but comparing the two just on hw = k80
silent swan
I'm confused what you're comparing between now
dawn kayak
but yea it's older arch, though i suspect there's not much difference in actual perf
silent swan
no, k80 is pretty slow
faster than no GPU, of course
but much slower than the new ones
unless you are memory constrained, 1080ti is far better
obtuse skiff
ok, cool ill use my gpu then , ty
velvet thorn
@lapis sequoia no.
that is not what the documentation means.
you pass transformers and lists of columns in the first argument, right
remainder controls what happens to the columns which were not so passed.
'drop' (the default) drops them
'passthrough' means that they will be passed through to the output unmodified
when it says or estimator, the fact that it's not 'estimator' should have suggested something
basically, it's not asking for estimator (which would be an undefined name), or 'estimator' (which wouldn't make sense)
it's actually saying...if you don't want to drop or leave those columns unmodified, then provide another object of type Estimator here, which will be applied to those columns.
@jolly briar NO MODIFYING DATAFRAMES!!!! (unless you have efficiency concerns)
velvet thorn
is there a nicer approach than the following :
df.x = df.x * 0.01
jolly briar
oh right, presumably there is?
velvet thorn
well, I would say that df['x'] *= 0.01 is pretty okay
for an imperative approach
as discussed above
jolly briar
what are you on about then with the caps etc
velvet thorn
but personally I would not modify
jolly briar
it's late here so be explicit
jolly briar
well that's a waste imo
velvet thorn
if you want to take a functional approach (which IMO pandas already does)
jolly briar
yeah you're just doing it so your approach is consistent
velvet thorn
then that would be more appropriate
velvet thorn
you can run stuff out of order
or multiple times
and you won't have problems
(a lot more relevant in notebooks)
velvet thorn
there are clear efficiency benefits to inplace modification of a single Series
I believe
so there's that
jolly briar
unless there's a really obvious reason here I'm not interested in changing it tbh, and I can't see one other than hte notebook thing
velvet thorn
but, yeah, up to you
jolly briar
just seems for the sake of it
 dense valve
 lapis sequoia
@velvet thorn thank you for the explanation! glad you're back. Could you maybe comment on this methodological approach:
(1) I'm using a pipeline to fetch float64 variables (=delays) from the dataframe and apply sklearns StandardScaler(), as those values are not necessarily range-bound and standardization is less affected by outliers.
(2) I'm doing the same with int64 values (which are hour_of_day and stopsequence_no) except I apply MinMaxScaler() here, because those values will never be out of range (24hr day; and each train-line only has a specific number of maximum stops ---however, there are differences between shorter and longer train-lines).
(3) categorical variables like weekdays or train-line are processed with OneHotEncoder() to create dummy variables for each line or weekday.
(4) there is one ordinal variable, which is precipitation categorized into classes (none, light, medium -- the dataset doesn't provide more extreme events), which is processed by OrdinalEncoder()
(5) and here is the actual question: there are 10 other variables left, which are all formatted as dtype category and are all dummy variables. Would it be better to pass those through as remainder, or does it make sense to use a minmaxscaler here, too, as all the variables are either 0 or 1 anyway? Thank you very much for your time
jolly briar
@Trixey-Chan#4224 what
lapis sequoia
it's probably a question of good practice
jolly briar
@Trixey-Chan#4224 ?
 deep mist
they aren't in the server anymore
velvet thorn
looks fine
you can scale, or not
generally won’t make much difference
in that regard
strange stag
hey so im working with pandas... and heres the code...
maybe2['tax'] = (maybe2['price min'] * 0.084)
However, code stops here and returns the error
Try using .loc[row_indexer,col_indexer] = value instead
However, when i try using .loc on maybe2.loc['price min']
I receive another error
KeyError: 'price min'
o.O?
velvet thorn
long story
but it's a false positive
do maybe3 = maybe2.copy() and work on maybe3
strange stag
@velvet thorn heres what i have atm maybe2 = maybe[["upc","price max","price min"]]
so i need a .copy of maybe[[blah,blah,blah]]
hmm, maybe not
o, was still trying to use .loc after .copy() >.>
ah there we go 🙂 tyvm
@velvet thorn
uncut shadow
Hey. Do you know any good tutorials for backpropagation and gradient descent?
I just want to understand why something is multiplied or divided by something to get what you need to upgrade weights
 gilded surge
@uncut shadow You just want to know more about the mathematical concept?
lapis sequoia
@velvet thorn thank you! Can you suggest some of your preferred ways to compare scores between different predictive models? RMSE with bar charts? Actual delays, schedule time and predicted delays in one multiple line chart?
velvet thorn
^
lapis sequoia
@void anvil thanks. Okay, so my goal is to predict traindelays and do so as precisely as possible. Obviously the target is, to beat the train carriers' very own predictions at that. I'm using "real time" information of the train-carrier (still working on an older dataset, but for the given time I'm using "real time" information) as well as variables for weather conditions, time of the day, day of the week, for city center vs periphery, for rush hour vs normal hours, holidays, festivals, etc.
Of course there are outliers, that's why I decided on RMSE as performance measure, as that doesn't put too much emphasis on outliers vs MAE.
velvet thorn
RMSE for all cases is like shooting 1m to the left and right of a rabbit and expecting to have it for dinner
Of course there are outliers, that's why I decided on RMSE as performance measure, as that doesn't put too much emphasis on outliers vs MAE.
?? why do you think so
lapis sequoia
I think that came out differently than what I actually wanted to say. I actually meant the RMSE is more sensible to outliers. As a rule of thumb, the RMSE is preferred with most regression tasks. If there were many outliers, it would make sense to use the MAE.
However, since the norm index is very high for the observed delays, the RMSE makes more sense.
The observed outliers are relatively very rare and some of them are rather extreme. I cut the really extreme ones, but cutting all delays greater than 10minutes would totally miss the point of predicting delays. After all, that's where it actually starts to get interesting... maybe identifying singular factors or a combination of them, which increases delays significantly.
lapis sequoia
could you elaborate?
and whats your take my ideas to visualize/compare? it might be just me, but i feel like it's not much to show if I only compare RMSE values and prediction performance in a line chart
significance of the variables (linear regression) and R2 will also be discussed, obviously
by classification problem you mean instead of predicting an actual delay in minutes i could do predictions of confidence intervals?
strange stag
python code:
df = df.drop(df[df['unsellable_reason'] is not None])
Traceback:
KeyError: True
Erm, what?
lapis sequoia
nubonix what are you trying to do?
strange stag
drop the rows that the value for unsellable_reason is None
lapis sequoia
just select the data that is not null
df2 = df.loc[~df.unsellable_reason.isnull()]
@velvet thorn @void anvil outliers are exponentially rare
strange stag
weird...worked in my other file...w/e
not using loc
even copied the df b4hand
o...cause i didnt specify type
@lapis sequoia erm... what about
df['np'] = df['np'].astype(float64)
df = df.drop(df[df['np'] <= 1.00])
raise KeyError(f"{labels[mask]} not found in axis")
KeyError: "['blah','blah2',etc...]
weird....
axis=1 fixes it
dono why i have to specify >.>
rofllllllllllll
figured out why it wasnt working >.> wasnt dropping by index
Solved with this code...
df = df.drop(df[df['unsellable_reason'] == None].index)
how i figured this out is seeing i had a key error, and figuring out what my keys were at each line operation
lapis sequoia
you used axis=1 to drop rows?
that's weird...
but i guess a problem solved is a problem solved ^^
strange stag
erm, dont think i actually dropped them, i think i just thought i dropped them
however, the above code works..so
velvet thorn
notna is better than ~...isna() IMO
but anyway I don't see why df.dropna(subset=['unsellable_reason'], inplace=True) wouldn't work in that case
never mind I'm too sleepy ignore that
uncut shadow
@gilded surge Yes. I want to know why do I need to use this specific equasion to achieve something so I'll be able to make it myself.
lapis sequoia
@velvet thorn did I understand you correctly above? I agree, notna sounds even simpler. I've just never used it before... after all I'm on my first python project ever.
question refers to your suggestion of making a "classification problem"
When a decision tree kernel gives 0.7 RMSE on a training set, but 1.4+ on the same set after cross-validation (10folds), what would your interpretation be?
I reckon bad generalization due to overfitting, correct? Using linear regression or svm linear kernel, the RMSE is constant for cross-val btw.
(I wasn't planning to use decision tree, I don't know much about it and it was simply a test, but I find the result interesting)
uncut shadow
Hey. I have another question. Is there anybody who is able (or knows a good tutorial) to show How does it work or why you have to use those equasions (from scratch)?
I mean, I understand the equasions I need to do, but I don't understand why do I need to do them
Why should I take the derivative etc.
 harsh sapphire
So with Gradient Descent you are looking for the global minimum on the hyperplane. This global minimum is going to be the weight values that results in the best fitting model. When you calculate the derivative you are learning the rate of change at whatever particular values you are assessing at the moment. You can then use that value to determine which direction each value needs to be adjusted in order to improve the model.
@lapis sequoia The RMSE is probably higher due to less training data. When you crossval you are spliting your training data to evaluate against. DecisionTrees chronically overfit. But they are easy to interpret. If you are looking accuracy in predictions. I would recomend RandomForests, SupportVectors, or XGBoost Classifier.
strange stag
mk, was hoping someone could help me with pandas again
my df has the columns
upc, url_max, url_min, location, price_max, price_min
for each upc, i am trying to find a url_max, or url_min that has amazon in the url, and extract some data from this (using split, i have already done this), i also need place NaNs on every url_max, url_min that does not have amazon in the url, so that i can use these NaNs, by using .fillna to fill in the missing values for each groupby('upc')
dawn kayak
where's the code
strange stag
@dawn kayak what do you need to know? i prefer to keep the data confidential
dawn kayak
obsfucate the data, it's not easy to suggest which code to solve program problem without code
velvet thorn
@strange stag if I understand you correctly...
df.loc[~df['upc'].str.contains('amazon'), ['url_max', 'url_min']] = np.nan
(don't tag me please)
velvet thorn
isn't that what I did
strange stag
oh okay
did not know about that, soz
mk, so heres the jsonlines file
https://bpaste.net/AYQA
velvet thorn
should work fine
strange stag
working on the code now
(pasting)
what im trying to acheive
https://bpaste.net/AKVQ
url parsing made easier .split('https://www.amazon.com/gp/offer-listing/')[1].split('?')[0]
this solves half the problem
df3k[('buy_url', 'min')].str.contains('amazon')
df3k[('buy_url', 'max')].str.contains('amazon')
Now i just need to get the urls of the two lines above, and use the split operation on these urls
~ NaN fill the rows that arent contain within those two lines
~ fillna the NaNs
~ should be done
strange stag
how do i do this for each row and add to a column?
df3k['buy_url']['max'][4].split('https://www.amazon.com/gp/offer-listing/')[1].split('?')[0]
0,1,2,3 have an IndexError
y does this not really work?
for x in range(len(df3k['buy_url']['max'])):
    try:
        df3k['asin'][x] = df3k['buy_url']['max'][x].split('https://www.amazon.com/gp/offer-listing/')[1].split('?')[0]
    except IndexError:
        pass
why don't you remove the amazon's url strings before putting them into df?
strange stag
this shouldnt be a difficult operation in pandas
dawn kayak
it's not about difficult or not, it's just unnecessary complication
strange stag
im downloading html files, so that if i need more data later on i have it, and can just parse from there, instead of tcp calls
that and i want to get more comfortable with pandas
cause these seems to be by far the most difficultly im facing in programming lately
dawn kayak
str operations in pandas is derived from pure python, nothing different between the two afaik
strange stag
syntax is completely different
didnt even know you could do what i did when working with pandas
even tho it doesnt work
and the df3k['buy_url']['max'][x].split('https://www.amazon.com/gp/offer-listing/')[1].split('?')[0]
is correct
however, df3k shows all blank asin after this code is ran
which doesnt make sense to me because im assigning via df3k['asin'][x]
emphasis on the [x]
oh, unless i gotta do a .index again
na, just for dropping nvm
that code should be valid... and i cant figure out why it isnt
even using a df3k = df3k.copy() as jupyter notebook suggests still renders blank asins
dawn kayak
you're not making sense, so i guess you'll solve it on your own later
strange stag
wdym
for each column asin in the dataframe, i want to split the url that contains amazon so that i can find the asin, and add that to the column value
dawn kayak
what i mean is you pick the unnecessary convoluted way to solve a problem that can be prevented way before, for unknown reason
strange stag
for example, extracting from a few urls, ill get
B000IZ99SQ
B004323NQ4
B01CG97GR2
B06XYCNR68
B06XYLYR8M
as i said, id have to do basically the same exact thing, and as you said yourself, pandas is python is it not?
however, if you would like this debate or w/e then ill move on for some1 else to help if they wish
df3k['buy_url']['max'][0].split('https://www.amazon.com/gp/offer-listing/')[1].split('?')[0] gets me B000IZ99SQ
df3k['buy_url']['max'][1].split('https://www.amazon.com/gp/offer-listing/')[1].split('?')[0] gets me B004323NQ4
and so on
however, it makes no sense to me why pandas isnt assigning the column value of these
ik i initialized the column with
df['asin'] = ''
however, this shouldnt block the column value from being re-assigned
indeed you are right, solved myself
was b/c of multindex
half solved
strange stag
solution
for x in range(len(maybe2)):
    try:
        if "amazon" in maybe2['url max'][x]:
            maybe2[('asin', '')][x] = maybe2['url max'][x].split('https://www.amazon.com/gp/offer-listing/')[1].split('?')[0]
    except:
        pass
    try:
        if "amazon" in maybe2['url min'][x]:
            maybe2[('asin', '')][x] = maybe2['url min'][x].split('https://www.amazon.com/gp/offer-listing/')[1].split('?')[0]
    except:
        pass
the solution was maybe2[('asin', '')][x] and this was because it was a multi-index, i had to specify ('column_name', 'blank')
if this doesnt make sense to you (and you want it to) feel free to ping me, and ill get back to you when i can
velvet thorn
that looks...complicated
strange stag
not really, but it is kinda annoying
velvet thorn
why is there a multi-index?
strange stag
cause aggs
velvet thorn
hm
not really complicated
more chunky and unidiomatic, but if it works, that's good
strange stag
well id prefer to use pandas instead of python, but idkh
velvet thorn
if you're not using 1.0 it doesn't matter that much either I think
you probably want some chain of .str.split and .str[1]
strange stag
if you have a better solution im all ears
strange stag
ye...was for me2
velvet thorn
as in I can't formulate proper code without knowing what it looks like but
offer_listing = 'https://www.amazon.com/gp/offer-listing/'

condition = maybe2['url_max'].str.contains('amazon'), 'url_max'

maybe2.loc[condition] = maybe2.loc[condition].str.split(offer_listing).str[1].str.split('?').str[0]
hmm
offer_listing = 'https://www.amazon.com/gp/offer-listing/'

condition1 = maybe2[('url max', '')].str.contains('amazon'), ('url max', '')
maybe2.loc[condition1] = maybe2.loc[condition1].str.split(offer_listing).str[1].str.split('?').str[0]

condition2 = maybe2[('url min', '')].str.contains('amazon'), ('url min', '')
maybe2.loc[condition2] = maybe2.loc[condition2].str.split(offer_listing).str[1].str.split('?').str[0]
that does look nice tho
cept the DNR
velvet thorn
url_min
strange stag
thx
ValueError: Must have equal len keys and value when setting with an ndarray
ohh right
cause the multi-index
erm..maybe not
also, i corrected the _ to
hmm, something to do with condition2
pearl kiln
Hi... I want to make a tic tac toe ML bot....I have been working with sklearn past few days...can I make a tic tac toe bot with sklearn and what do I need to know before making it ...
strange stag
github.com might help
others might be able to give you a more defined answer @pearl kiln however, your question is still vague
@velvet thorn ye... was multi-index thing >.> updating now
and ye, much prettier looking code 😄
good for learning
think that actually works better
o.O not sure tho
 analog schooner
I want to remove the content of column "B" from column "A", can someone help?
only strings
 vagrant cypress
hi i am having a problem extracting a .gz file
i tried using winrar but i am not sure that it is working
i was told on #help-croissant to come here for help
hasty maple
@vagrant cypress did you try deleting the .gz file from your system and trying to run the code again?
velvet thorn
@analog schooner will what is in B always appear at the end of A?
vagrant cypress
@hasty maple it is the same error
velvet thorn
if not, I actually don't know if there's any method other than iteration
hasty maple
Not deleting it via the command line but manually deleting it by browsing to the folder and removing it?
vagrant cypress
now i get this error
what does it mean?
i did delete the python file "fashion_mnist"
hasty maple
no idea, code looks fine, I checked the docs too, it looks fine. Maybe try running the code in colab or find some pytorch tutorial instead >.>
hasty maple
👍
vagrant cypress
@velvet thorn
import tensorflow as tf
from tensorflow import keras
import numpy as np
import matplotlib.pyplot as plts

data = keras.datasets.fashion_mnist #fashion_mnist name of data set

(trainImages, trainLabels), (testImages, testLabels) = data.load_data()

print(trainLabel[0])
just to be sure
open a prompt
and from tensorflow import keras
does that fail?
judging from what I see
there are 2 things that you can try
- check if
keras_applicationsandkeras_preprocessingare installed - check that your
PATHfor CUDA/cuDNN is set up properly
lapis sequoia
@gusty karma only read your comment now. Thanks! I was actually planning to do linear regression, support vector regression and an ANN, but i don't have time to go into the ANN topic anymore. My problem with SVR is hardware intensity. Anything above linear kernel SVM is taking days. I just tried to use the RBF kernel and since then, my process has been running for 30 hours straight.
@velvet thorn what would be the advantage of binning delays into small/large delays?
harsh sapphire
@lapis sequoia How many cores do you have? You can set the n_jobs parameter to parallelize calculations. I would also recommend looking at XGBOOST you have to run pip install XBOOST but the xgbregressor is really powerful and much more efficient in my opinion.
lapis sequoia
I'm on an old i5 2500k sandybridge... so only 4 cores unfortunately ^^
i'll try xgboost... i've to admit i've never heard of it before.... but i'm also very new to this
i guess it is not possible to pip install while python process is running, is it?
harsh sapphire
You should be able to install while processes are running.
In my experience with jupyter notebook I can install and import into the next cell without needing to restart my server or anything. Just run the pip install run the import.
The XGBoost is formatted similarly to sklearn. So if you import xgboost as xgb Your models will be callable by as methods. So you would type xgb.XGBRegressor() Save that as your model and fit as normal. Hopefully this runs a little quicker and better for you
Don't forget to pass n_jobs=... as a parameter. If you want to utilize all of your cores you can pass -1 but that will make your computer run slowly for all other process. Since you have 4 cores the maximum number you can put is 8. So you can assign as much of your pc to this process as you like by working with numbers between 1 and 8.
They also have GPU support so if you have a decent GPU you can try messing with the GPU settings to further boost performance speeed.

Medium
Since the last decade, the amount of data generated has grown faster than our capability to process it
Has some good information on the subject.
lapis sequoia
i have a gtx 970, should be powerful enough to help quite a bit... but can the process run both cpu and gpu parallely?
thanks for all the tips!
harsh sapphire
Yes. If you use the gpu parallelization it works in conjunction with CPU
Of course!
lapis sequoia
hello i am programming an ai for discord could someone help me with the remembering and algorythm of it?
 fading plume
I have a starter question about MOOCs
I major in CS but before applying to data analyst jobs I wanna go ahead and learn all about SQLs, impala, spark, Hadoop,teradata, lambda, ec2. Is there a free course in udemy or Edx that can help me out?
 slow steppe
I think the free courses are usually just introductory level so probably not
uncut shadow
Well
Free courses are mostly introductory
But you can search for "Udemy coupons" and you might find some interesting courses for free
fading plume
hmm I'll try that.
uncut shadow
What is bias in ML and how can I calculate this? Does anybody know any good articles or anything?
lapis sequoia
lol
lapis sequoia
Does anyone know how to make a live-update chart where every x seconds the graph update itself based on the new data input? Can Matplotlib do that or do i have to try another module?
oblique belfry

Simple practical examples to give you a good understanding of how all this NN/AI things really work
dawn kayak
python5?
oblique belfry
I stumbled upon this on Reddit. I know many have asked about implementing backprop by hand, figured I'd reshare.
Also, it isn't "Python 5". Seems like the article slug is just weird.
dawn kayak
haha i know jk
velvet thorn
@lapis sequoia yes it can, look up interactive plotting and the animation module
lapis sequoia
@velvet thorn Thank you so much for the response! I'm a newbie in DS so forgive me for my stupid questions 😦
velvet thorn
no worries
lapis sequoia
oh my god those matplotlib animations are freaking savage!! i'm soo going to learn this man

Medium
Animations are an interesting way of demonstrating a phenomenon. We as humans are always enthralled by animated and interactive charts…
silent swan
lol the last time I made animations in matplotlib, I just individually generated each frame of animation and PNGs and stitched them together with some other program
velvet thorn
that sounds tedious.
oblique belfry
What is an ADFuller Test?
uncut shadow
Hey. Does the whole layer has bias? Or only some neurons?
 gentle depot
Hello, i'm having trouble to filter some data out of a dataframe with a datetime index. I'm relatively new to python/pandas and any help will be deeply appreciated.
I have a time series dataframe imported from excel and successfully managed to set the index to the parsed datetime column. The data has a lot of NaN I want to filter out by using a point in time where I know I have 'good' data (in short, I want to filter out any data below for example 11:30 am) but I just can't because I'm still confused about datetime objects, classes, methods, etc so I can't really explain what am I doing wrong. Please take a look at my code and the errors I have.
Line 15 should read
data.loc[data.index > time.strptime('12:30','%I:%M')]
lapis sequoia
@velvet thorn can you tell me how i properly drop the redundant column with OneHotEncoder() in my pipeline? I think i stepped into the typical dummy trap
but adding (drop="first") will lead to following error
TypeError: __init__() got an unexpected keyword argument 'drop'
i was experiencing extreme multicollinearity in my prediction models, so i checked the number of columns and obviously it was one too many for every categorical variable...
i thought the benefit of using onehotencoder was that it does it by default ^^
TypeError                                 Traceback (most recent call last)
<ipython-input-1328-2cab51bf7628> in <module>
      1 from sklearn.preprocessing import OneHotEncoder
----> 2 cat_encoder = OneHotEncoder(drop="first")

TypeError: __init__() got an unexpected keyword argument 'drop'```
i don't get it.... (drop="first") is exactly the command given in the sklearn documentation WTF?!print(sklearn.__version__)?
my best guess is that you’re using an outdated version
<= 0.19
also in general you shouldn’t tag users who are not currently conversing with you
because you shouldn’t be approaching specific people for help, I think it’s in the rules somewhere
lapis sequoia
0.20.3
oh... okay, didn't know that. I tagged you because i could see you're online and i knew you'd probably know how to deal with it
i've googled and found quite a few people experiencing similar problems just recently... like <30 days ago
do you suggest I should update my version?
i kinda go with never change a running system, but this is killing me right now.... all my models are trash because of multicollinearity lol
velvet thorn
yes
latest is 0.22
hm, that's weird, because I was not online
doppelganger again
lapis sequoia
weird... there was the green point when typing @ gm
velvet thorn
anyway
just do
help(OneHotEncoder)
if the arguments don't look like the documentation
you have a way-too-old version.
lapis sequoia
i kinda fear that some other stuff will change that i have to address in my code, but yeah, will update it then
do you use OHE though?
or are you sticking with the get_dummies ?
velvet thorn
hm.
the best answer is "it depends".
there is a fair bit of overlap in terms of scope
between pandas and sklearn
for data preprocessing
it's more about conceptual neatness
than performance