#data-science-and-ml
1 messages · Page 214 of 1
 drowsy grove
 jolly briar
it's not as though gg doesn't offer customisation tho
drowsy grove
A grid of plot? Like many subplots?
 silent swan
when I worked (admittedly briefly) with gg, it seemed like a lot of what you wanted to do needed to fit within their abstraction
I think that's the benefit of seaborn, which gives you sensible defaults, then you can fall back to matplotlib to customize
silent swan
like drawing arbitrary lines through things for visual emphasis, adding arbitrary points/shapes, super weird multiplot layouts of different kinds of plots that still line up with the same axes
jolly briar
not too sure on the latter there 🤔
not had to do that with gg
oh you can use gg_arrange iirc
silent swan
"hey look at this very important row in this grid-based heatmap"
jolly briar
yeah... i think it's hard not to be v biased based on what one's used the most 🙃 I've used gg, it's v good, so the initial clunks of matplotlib are amplified to me
silent swan
absolutely. I mean, I only like matplotlib because I've fought with it so much over the years that I know how to make it bend to my will :p
jolly briar
i've heard people talk about how it's nice with the oo stuff, so i feel i should probably give it more time... maybe
silent swan
though that still doesn't stop me from having to google every time "how do I put my legend outside my plot"
jolly briar
the screenshot was from this link https://www.reddit.com/r/learnpython/comments/74r36d/do_data_analsts_use_matplotlib_as_much_as_ggplot2/ on the off chance it's of interest
 velvet thorn
MPL is my favourite
I used to screw around with it a lot
make country flags, random animations, etc.
drowsy grove
Is it just me, or does matplotlib doesn't look good aesthetically?
I concede to its ability to be totally controlled of course.
silent swan
the defaults are very plain
velvet thorn
it looks horrible
silent swan
I think they used to be even plainer
velvet thorn
by default
silent swan
seaborn+mpl = goodtimes
velvet thorn
if you don't have a reasonable sense of what looks nice
pure MPL will not go well
also the API is p complicated...
...but with great difficulty, in this case, comes great power
drowsy grove
I guess I don't then. It's really hard for me to adjust the color and layout in MPL to make it look nice.
Just looks...ugh, raw
If I have to pick one word.
velvet thorn
apart from a reasonable sense of what looks nice, you also need to be quite familiar with the API
I would say it's not really worth it
unless you love tinkering
drowsy grove
Any good Pycon talks on how to use seaborn? I hope it's not as complex as pandas.
velvet thorn
it's probably more likely that you lack the latter, actually
hm
what about pandas do you find complex?
could it just be unfamiliarity?
drowsy grove
Well, complex may be inadequate.
I concede to your judgement.
Yes, unfamilarity. I've only used a very small portion of what is available in pandas.
velvet thorn
it is chunky, and under the hood it is complex, but I personally find it quite simple/logical, unless you venture into esoteric data wrangling operations that most of us will not need on a daily basis
I will say, however, that it is not that Pythonic
drowsy grove
Hardly so.
velvet thorn
which is a large source of friction for people who start using it
drowsy grove
I agree. But I still love Pandas.
The learning curve was steep for me, but once I get used to it, I can't use anything else.
velvet thorn
when I had to use Spark I missed it a lot
drowsy grove
@velvet thorn Speaking of which, I've been trying to figure one very small thing for a while.
Is there a easy way, basically one line, to return a new row in a dataframe, that sums numeric columns only, and does not ignore index
I think I found a way to do it before but I had to ignore index. Could be wrong tho. It's been a while.
velvet thorn
what do you mean "does not ignore index"?
velvet thorn
do you expect the output to be the original DataFrame with one extra row?
or just a single row?
drowsy grove
That was my next question
drowsy grove
Then what shall I do?
velvet thorn
SettingWithCopyWarning: Everything you need to know about the most common (and most misunderstood) warning in pandas and how to fix it!
read this, it's good for health
feel free to ask me if you have questions
drowsy grove
Finally
velvet thorn

Stack Overflow
Background
I just upgraded my Pandas from 0.11 to 0.13.0rc1. Now, the application is popping out many new warnings. One of them like this:
E:\FinReporter\FM_EXT.py:449: SettingWithCopyWarning: A ...
this is a little more concise
actually I'll just summarise for you
drowsy grove
@velvet thorn If I want to insert what you just created, that one row, probably a series to the dataframe, making the index corresponding to the column name, is that possible?
velvet thorn
uh
velvet thorn
making the index corresponding to the column name
what do you mean?
there will be only one index
value
e.g. in your example above
"SUM" is the index
drowsy grove
Basically I want a sum row in the df without any NaN values.
But hold that thought for a second, could you proceed with the warning thing?
velvet thorn
and since each row must have the same number of values
there must be some way to mark the missing values, right?
which is nan
drowsy grove
I see now.
velvet thorn
anyway, long story short, when you index a DataFrame, sometimes you get a view (a subset of the original) and sometimes you get a copy.
because of limitations in the language, it is not always possible to tell which.
accordingly, pandas raises a warning when it detects this might be happening.
drowsy grove
Okay, finally I got an explanation on the view vs copy. Please go on.
velvet thorn
this warning also tends to crop up when you modify a DataFrame that has earlier been sliced in such a way.
in this case it is a false positive
but IN GENERAL unless you have performance concerns I prefer always creating copies with operations
drowsy grove
" sliced in such a way"
Sorry I want to make sure I am following. Sliced in what way? Indexed?
velvet thorn
minimal example
>>> import pandas as pd
>>> df = pd.DataFrame([[1, 2], [3, 4]])
>>> sub_df = df[1:]
>>> sub_df[1] = 6
__main__:1: SettingWithCopyWarning
hmm. I see
drowsy grove
so the slice doesn't trigger the warning. It's doing whatever after the slicing will trigger the warning?
velvet thorn
yes.
drowsy grove
Thanks.
velvet thorn
if you never modify the slice
nothing bad will happen
or rather
no warnings will happen
drowsy grove
But what if you slice a df, and you don't do anything with slice, instead, you go back to modify or perform function on the df, would that trigger any warning?
velvet thorn
see "if you never modify the slice"
drowsy grove
Just as we speak, I did what I just did again. Only to fail to recreate the warning.
Gotcha.
I sometimes feel it came out of nowhere.
And when I tried to reimport the data, repeat the same action, it won't pop up?
Is that possible?
This time, no warning.
velvet thorn
indeed
you're working in a notebook
which probably means
your output reflected earlier code
drowsy grove
So if I keep on running on the same df, it will be triggered.
The only thing I can find in previous cells that is slicing is this:
df = df[(df.SIDE != 'X')]
This is considered slicing right?
And like you said, it happens if I modify the slice
And the slice here shall be df itself?
OMG, I recreated it. Finally! I got to understand it.
Thank you so much. So what is a good practice to avoid it?
In your code sub_df = df[1:] this is not considered as a copy?
velvet thorn
it might be a slice, and it might be a copy
okay, long story short
it's fine to create slices like that
as long as you don't modify them
that is the golden rule
(which is actually more like a tarnished silver rule...)
drowsy grove
Why is it tarnished? Thanks by the way.
You did mention that you have a habit of creating copies to avoid these warnings.
Under what circumstances do you do that? I assume when you know you are going to modify the slice?
I've always been a little confounded at that: so when you usepy df_sub = df.loc[df['COLUMN_A'] > 100]
Are you not creating an individual object and saving the object in the variable df_sub?
Even if you modify df_sub, it wouldn't really change the original df would it?
Thanks @velvet thorn
velvet thorn
yes, that's what I'm saying
sometimes it creates a slice, sometimes it creates a copy
anyway I almost never modify
 lapis sequoia
it's not good practice to modify because you can't predict how it's going to behave or if it's actually going to overwrite
velvet thorn
only in the case of chained indexing
 olive pilot
hi,i need some help regarding this https://stackoverflow.com/questions/59629927/how-do-i-trace-an-exact-or-find-a-specific-value-in-a-matplotlib-graph?noredirect=1#comment105424003_59629927
Stack Overflow
The code below plots a 2d axis graph. How can I find a specific point on the graph?Specifically the x value when y= -0.99. Apologies for the simple question as I'm new to this and am not sure how to
lapis sequoia
question is not clear
you mean you want an interactive graph so when you hover around a value you get the x?
or do you mean you want to store x, y and want to retrieve x for y input
olive pilot
not an interactive graph,just need to find out what x is at a specific y value
would that be possible?
 late gull
Hi there, I just got a case study which is due tomorrow for a job that I really want to get in. However the case study is an optimization problem which I've never done. Is there anyone kind enough to help me out our guide me through it. Won't take more than 15-30 minutes of your time.
lapis sequoia
@olive pilot then evaluate the values and store in array instead of trying to get from the plot
!ask
 arctic wedgeBOT
ask
Asking good questions will yield a much higher chance of a quick response:
• Don't ask to ask your question, just go ahead and tell us your problem.
• Don't ask if anyone is knowledgeable in some area, filtering serves no purpose.
• Try to solve the problem on your own first, we're not going to write code for you.
• Show us the code you've tried and any errors or unexpected results it's giving.
• Be patient while we're helping you.
You can find a much more detailed explanation on our website.
lapis sequoia
@late gull
jolly briar
what are the most common pandas functions for working with timeseries? I'm aware of merge_asof.... that's about it 🤔
lapis sequoia
a weird question but thanks to that you showed me resample which i happened to need rn. Ty both
all the info i was getting when i researched was using dropna() but my skimmed data didnt have NA values
 quartz stream
@lapis sequoia https://github.com/mm-mansour/Fast-Pandas

GitHub
Benchmark for different operations in pandas against various dataframe sizes. - mm-mansour/Fast-Pandas
This will help a lot
lapis sequoia
danke
quartz stream
Bitte schön
lapis sequoia
gesundheit
 olive willow
Guys any ideas of which projects to do, to display your data science abilities? Is it good if I like ask a question and then answer it with data that I manipulated etc?
lapis sequoia
Hello, what does it mean non-linear methods. I know what it refers but, what is the point behind that, if it consist of nonlinearly dependent variables such as x1,x2, do I need to use non-linear algorithms to get a best performance?
@lapis sequoia What are you trying to do?
lapis sequoia
does anyone have an extensive experience with Censys API and filters? My query occasionally returns false data that does not match my filter
jolly briar
@velvet thorn 🤔 maybe, maybe not... when working with series of time there's probably a subset of functions that are more commonly used? Such as those you've mentioned and merge_asof, so thanks 🙂
 uncut shadow
I have a asked before If making machine learning models from scratch makes sense. Now I have another question. Do you think sticking with the models I have made is usefull? By this I mean, do you think using my models instead of Keras or tensorflow's models is a good idea?
drowsy grove
@velvet thorn Would you mind showing me how you modify please?
Do you use something like df_slice_copy = df_slice.copy()? Thanks.
 hardy crag
@uncut shadow depends. So for Deep learning probably not unless you're implementation does something that the big frameworks cant. But they are usually way better in terms of error handling and optimization than your code is, so I'd suggests using them instead. If your doing a simple regression or something, you might aswell use a simple numpy implementation. SKLearn will still probably be faster but it doesnt really matter if the code only rus for a couple of seconds or minutes.
uncut shadow
Well, I wanted to learn implementing and using machine learning so I thought only using my own models will be the best option to do it. I mean, many learn machine learning for "usage" so if they know How to use a framework they are happy, but for me knowledge is more important than usage. So I was trying to do as many things without any frameworks with only NumPy, matplotlib and pandas
jolly briar
@uncut shadow using your own models instead does not make sense to me
hardy crag
@uncut shadow there is a lot to be learned from building the algorithms once, but after you understood them better by building them yourself you should probably still use the once that are optimized and part of a larger ecosystem 🙂
e.g. it helps a lot to understand what gradient descent is when you program one yourself, but it will be many times slower than the one implemented in tensorflow
velvet thorn
@drowsy grove I don't.
but if I did, then something like that.
@uncut shadow no, you build them for the sake of learning, but other than benchmarking accuracy I don't think you should use them in production
 sand gyro
Tried another solution using numpy and now I am getting a syntax error
r1 = df[np.isfinite(df['Firstname'])] & df[np.isfinite(df['Lastname'])] & ((df[np.isfinite(df['work_phones'])] | df[np.isfinite(df['mobile_phones'])] & ((df[np.isfinite(df['Work_Street'])] & df[np.isfinite(df['Work_City'])] & df[np.isfinite(df['Work_State'])] & df[np.isfinite(df['Work_Zip'])]) | (df[np.isfinite(df['Personal_Street'])] & df[np.isfinite(df['Personal_City'])] & df[np.isfinite(df['Personal_State'])] & df[np.isfinite(df['Personal_Zip'])])) & (df[np.isfinite(df['Work_email'])]) | (df[np.isfinite(df['Personal_email'])]))

r2 = df[np.isinf(df['Firstname'])] & df[np.isinf(df['Lastname'])] & ((df[np.isinf(df['work_phones'])] | df[np.isinf(df['mobile_phones'])] & ((df[np.isinf(df['Work_Street'])] & df[np.isinf(df['Work_City'])] & df[np.isinf(df['Work_State'])] & df[np.isinf(df['Work_Zip'])]) | (df[np.isinf(df['Personal_Street'])] & df[np.isinf(df['Personal_City'])] & df[np.isinf(df['Personal_State'])] & df[np.isinf(df['Personal_Zip'])])) & (df[np.isinf(df['Work_email'])]) | (df[np.isinf(df['Personal_email'])]))

for r in dataframe_to_rows(df, index=False, header=False):
       ws.append(r1)

for r in dataframe_to_rows(df, index=False, header=False):
       ws2.append(r2)


wb.save("Accepted Contacts.xlsx")
wb2.save("Rejected Contacts.xlsx")
It is numpy with pandas dataframe rows
velvet thorn
what I mean to say is...perhaps you might want to consider doing all that a different way...?
you probably have unclosed brackets/parentheses somewhere
which is causing a syntax error
sand gyro
solved the syntax error but now I have a TypeError: ufunc 'isfinite' not supported for the input types, and the inputs could not be safely coerced to any supported types according to the casting rule ''safe''
velvet thorn
you have object columns
lapis sequoia
wow.. that's some spaghetti
lapis sequoia
@velvet thorn 😂
 languid warren
Hey, i want to load a video with skvideo.io.vread to convert it as a tensor rank 4(3 RGB 1 time ) and save it in .txt or .csv. The only way i find is to split the video by frame and create for each image a rank 3 tensor (RGB) which i save on .txt
lapis sequoia
"My arms feel weak looking at that" lmao
 granite sierra
Hey Guys, my softmax is returning ridiculously low numbers, like they dont even add up to 1. Anyone hav any idea what might be happening?
 timid vortex
Hello,
I'm having difficulty getting a required output from using pandas on a particular dataset that I was given as a coding challenge.
This is the output I'm supposed to get:
This is the code that I have
this is my output
I'm not sure how to remove those warnings, or that I'm doing something particularly wrong.
the data is from a csv file
hopefully this is clear for help
languid warren
it s a ram problem , normalize the data first , do the calculation and renormalize at the end
granite sierra
was that aimed at me gol?
jolly briar
anyone used xlwings much? only just heard about it
 upper oxide
someone know how to make a vocal assistant like jarvis (NO IF - ELSE) with machine learning? i'm a beginner in machine learning . if someone can help me , i will be happy. Thanks!
 surreal willow
How much should I know about Python and programming to start learning Machine learning
 oblique belfry
I think one can pick up programming quickly. I'd make sure you understand the theoritical foundations of ML and stats first.
 frail flower
Pandas question in two parts:
- Has anyone tried modin-pandas, and is it as good as the Readme claims?
- Are there any alternatives to
pandas.DataFrame.to_json()?
velvet thorn
what do you mean by "alternative":?
@surreal willow no...learning from docs is like reading a dictionary to get good @ English
lapis sequoia
@frail flower modin-pandas is still new.. lot of compatibility issues
why do you want to convert a pandas df to json..
surreal willow
@velvet thorn Ok
 eager heath
Hello everyone, I'd like to use ML in my next project, which would be an AI built to remove seams from textures. When you design a texture, and put it in a 2x2 square, you can see the border of the original texture, because it isn't built to kind of loop around. The goal of the AI would be to modify the border of the texture, so no seam would appear when you put them next to each other. Although, I never worked with ML (I know the basics, but I never used it), so if you have any pointer for me, that would be huge! Thanks you guys
velvet thorn
can you give me an example @eager heath
I think I get what you mean but I'd like to be clearer
eager heath
@velvet thorn
This is a seamless texture https://plusspec.com/wp-content/uploads/2017/08/seamless-texture-example.jpg
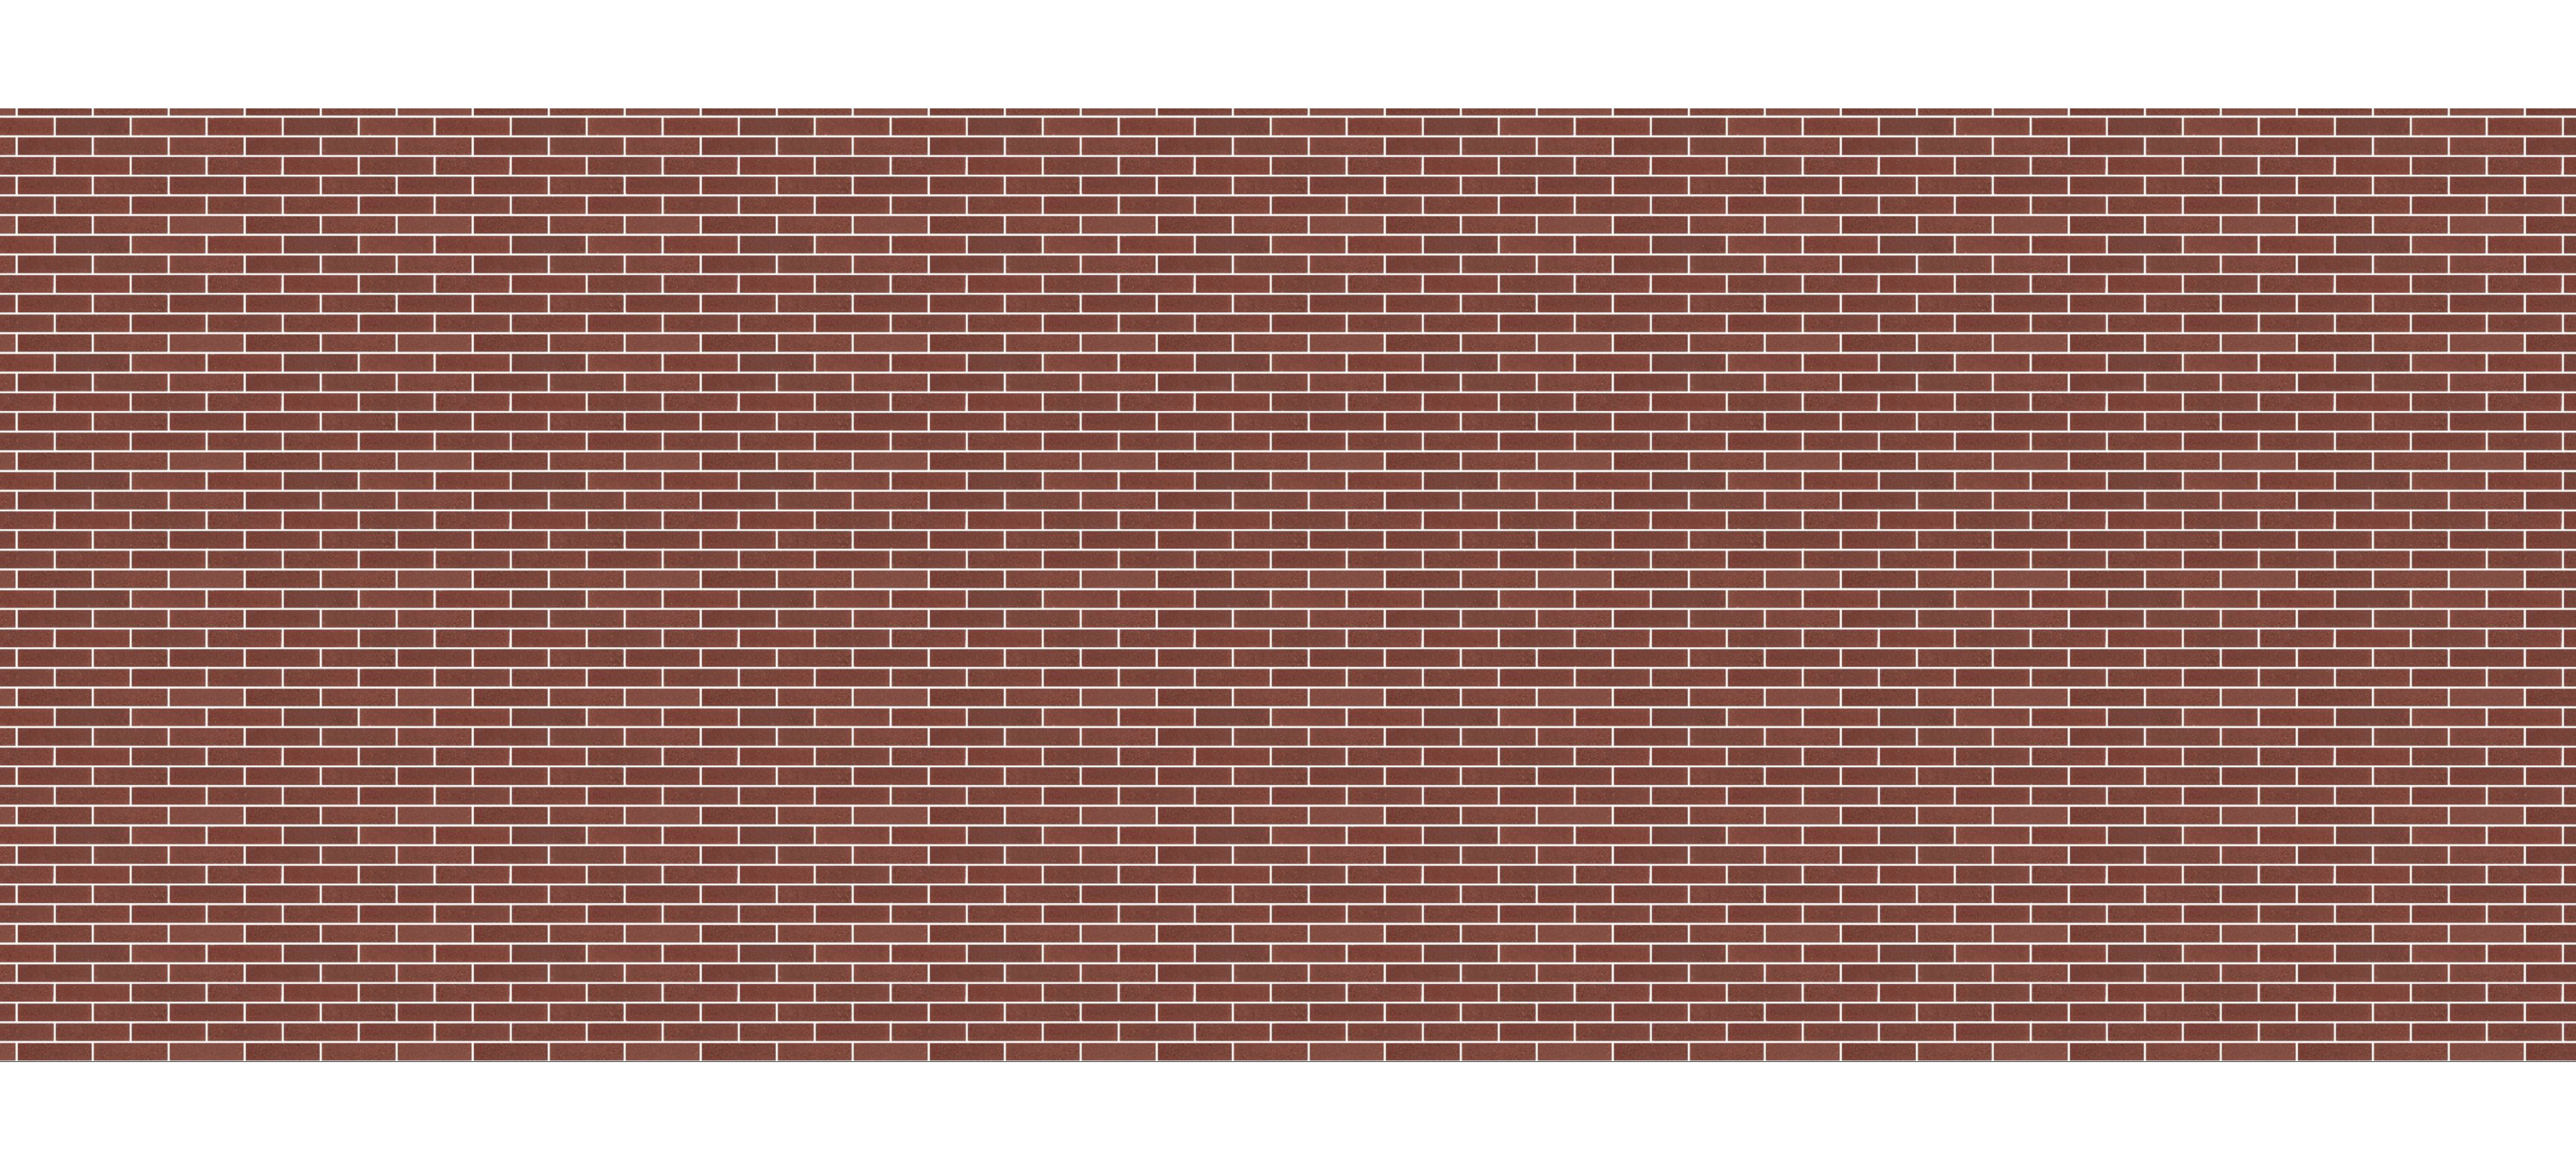
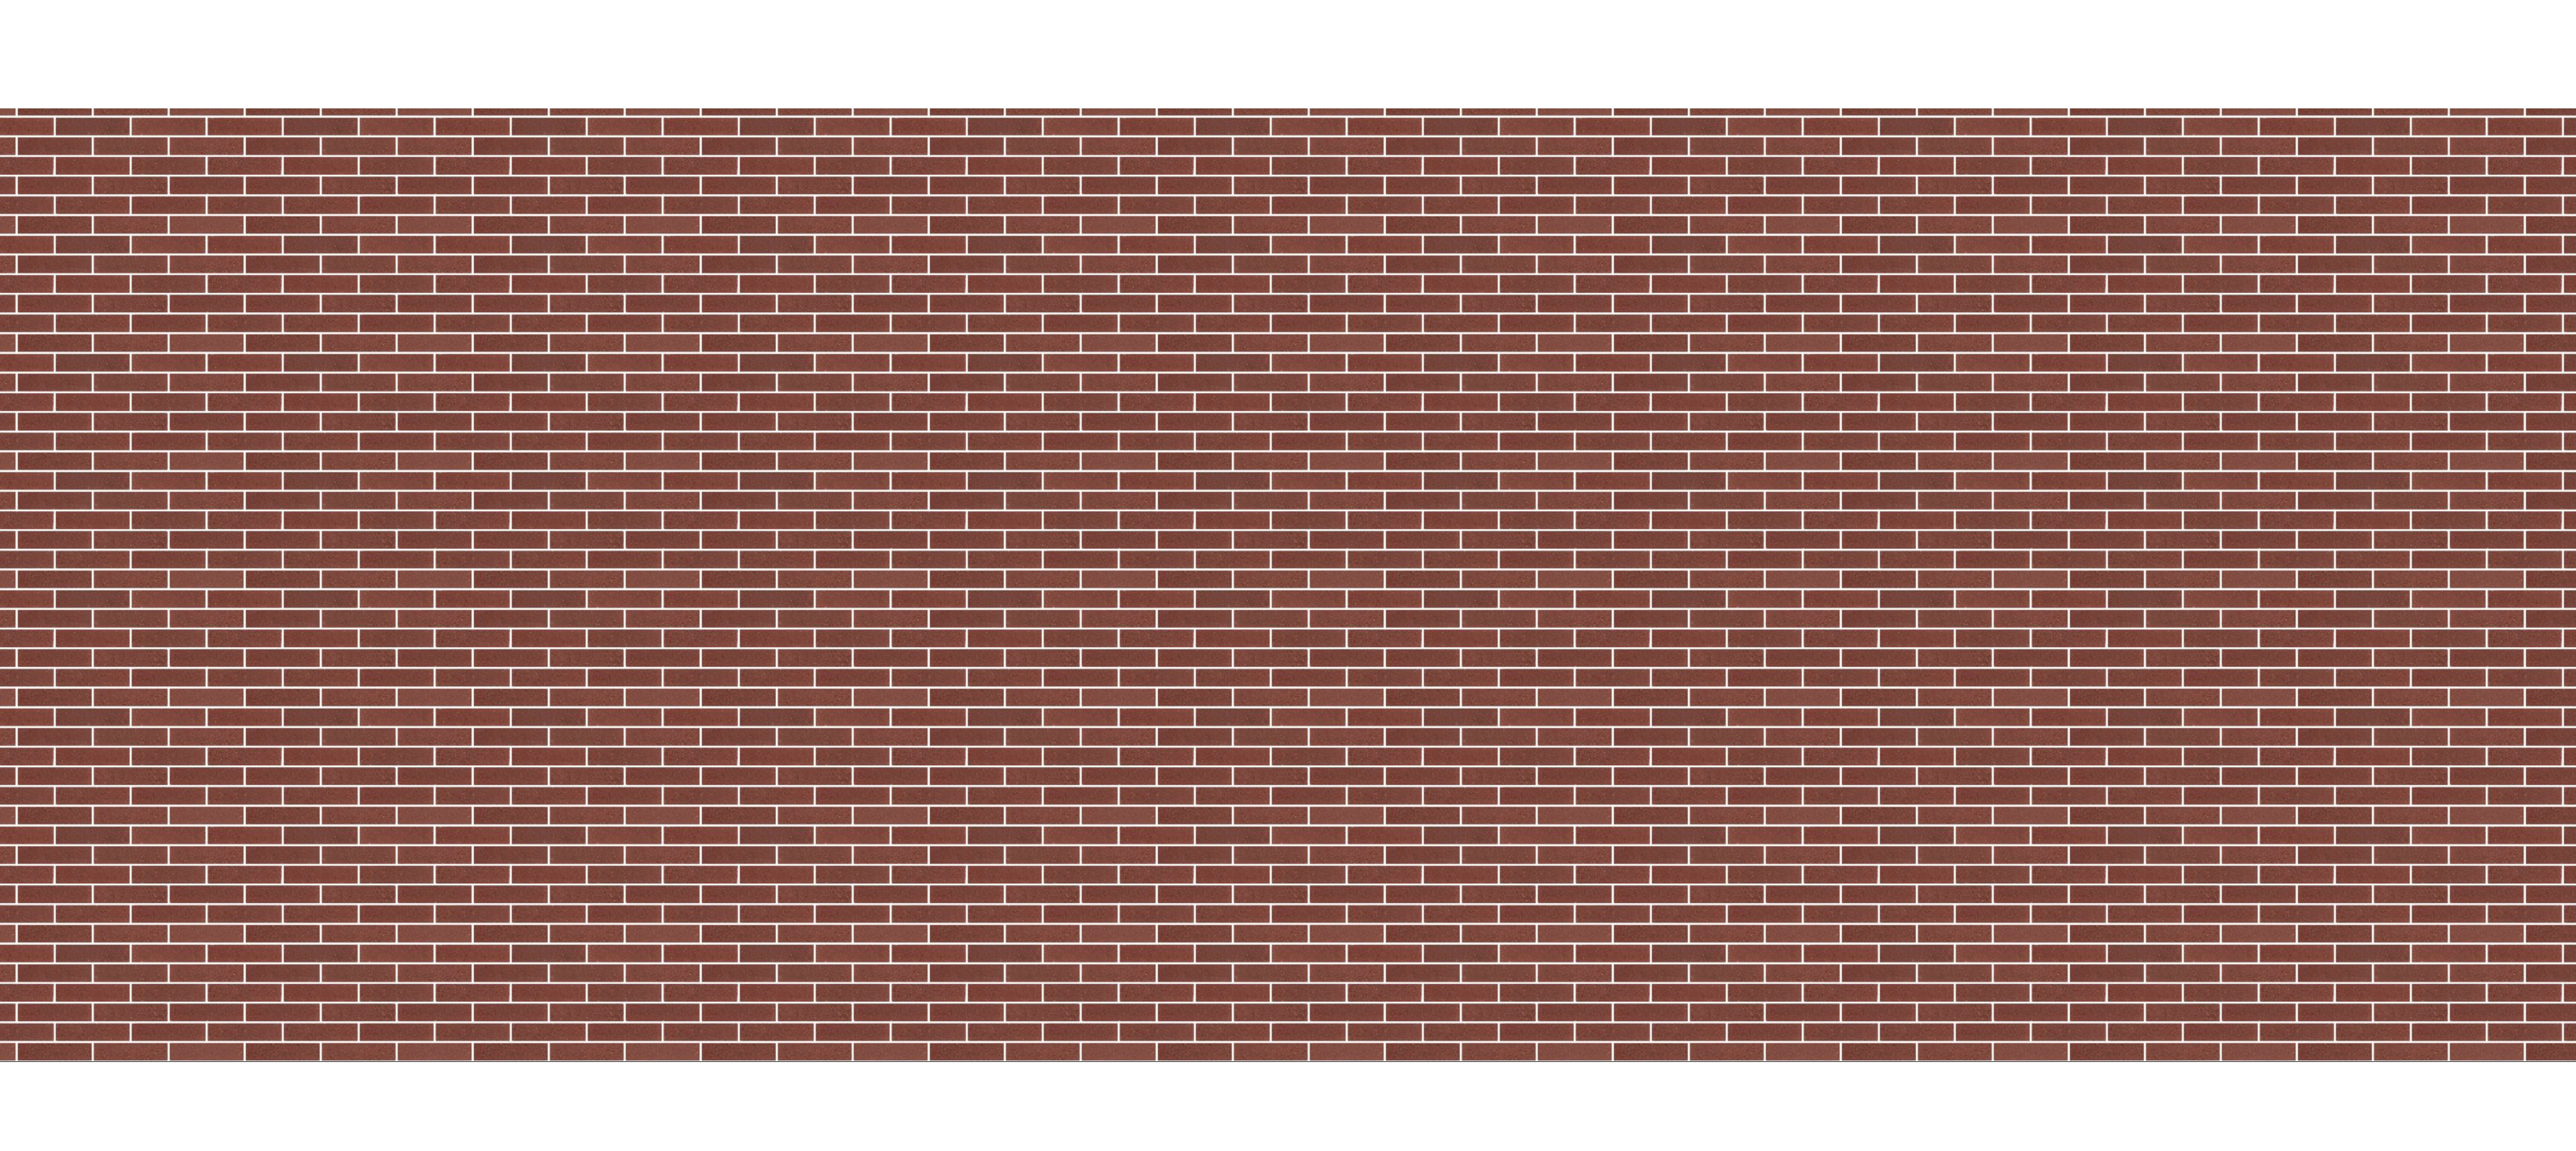
And this is a non seamless texture https://plusspec.com/wp-content/uploads/2017/08/Non-seamless-texture-example.jpg
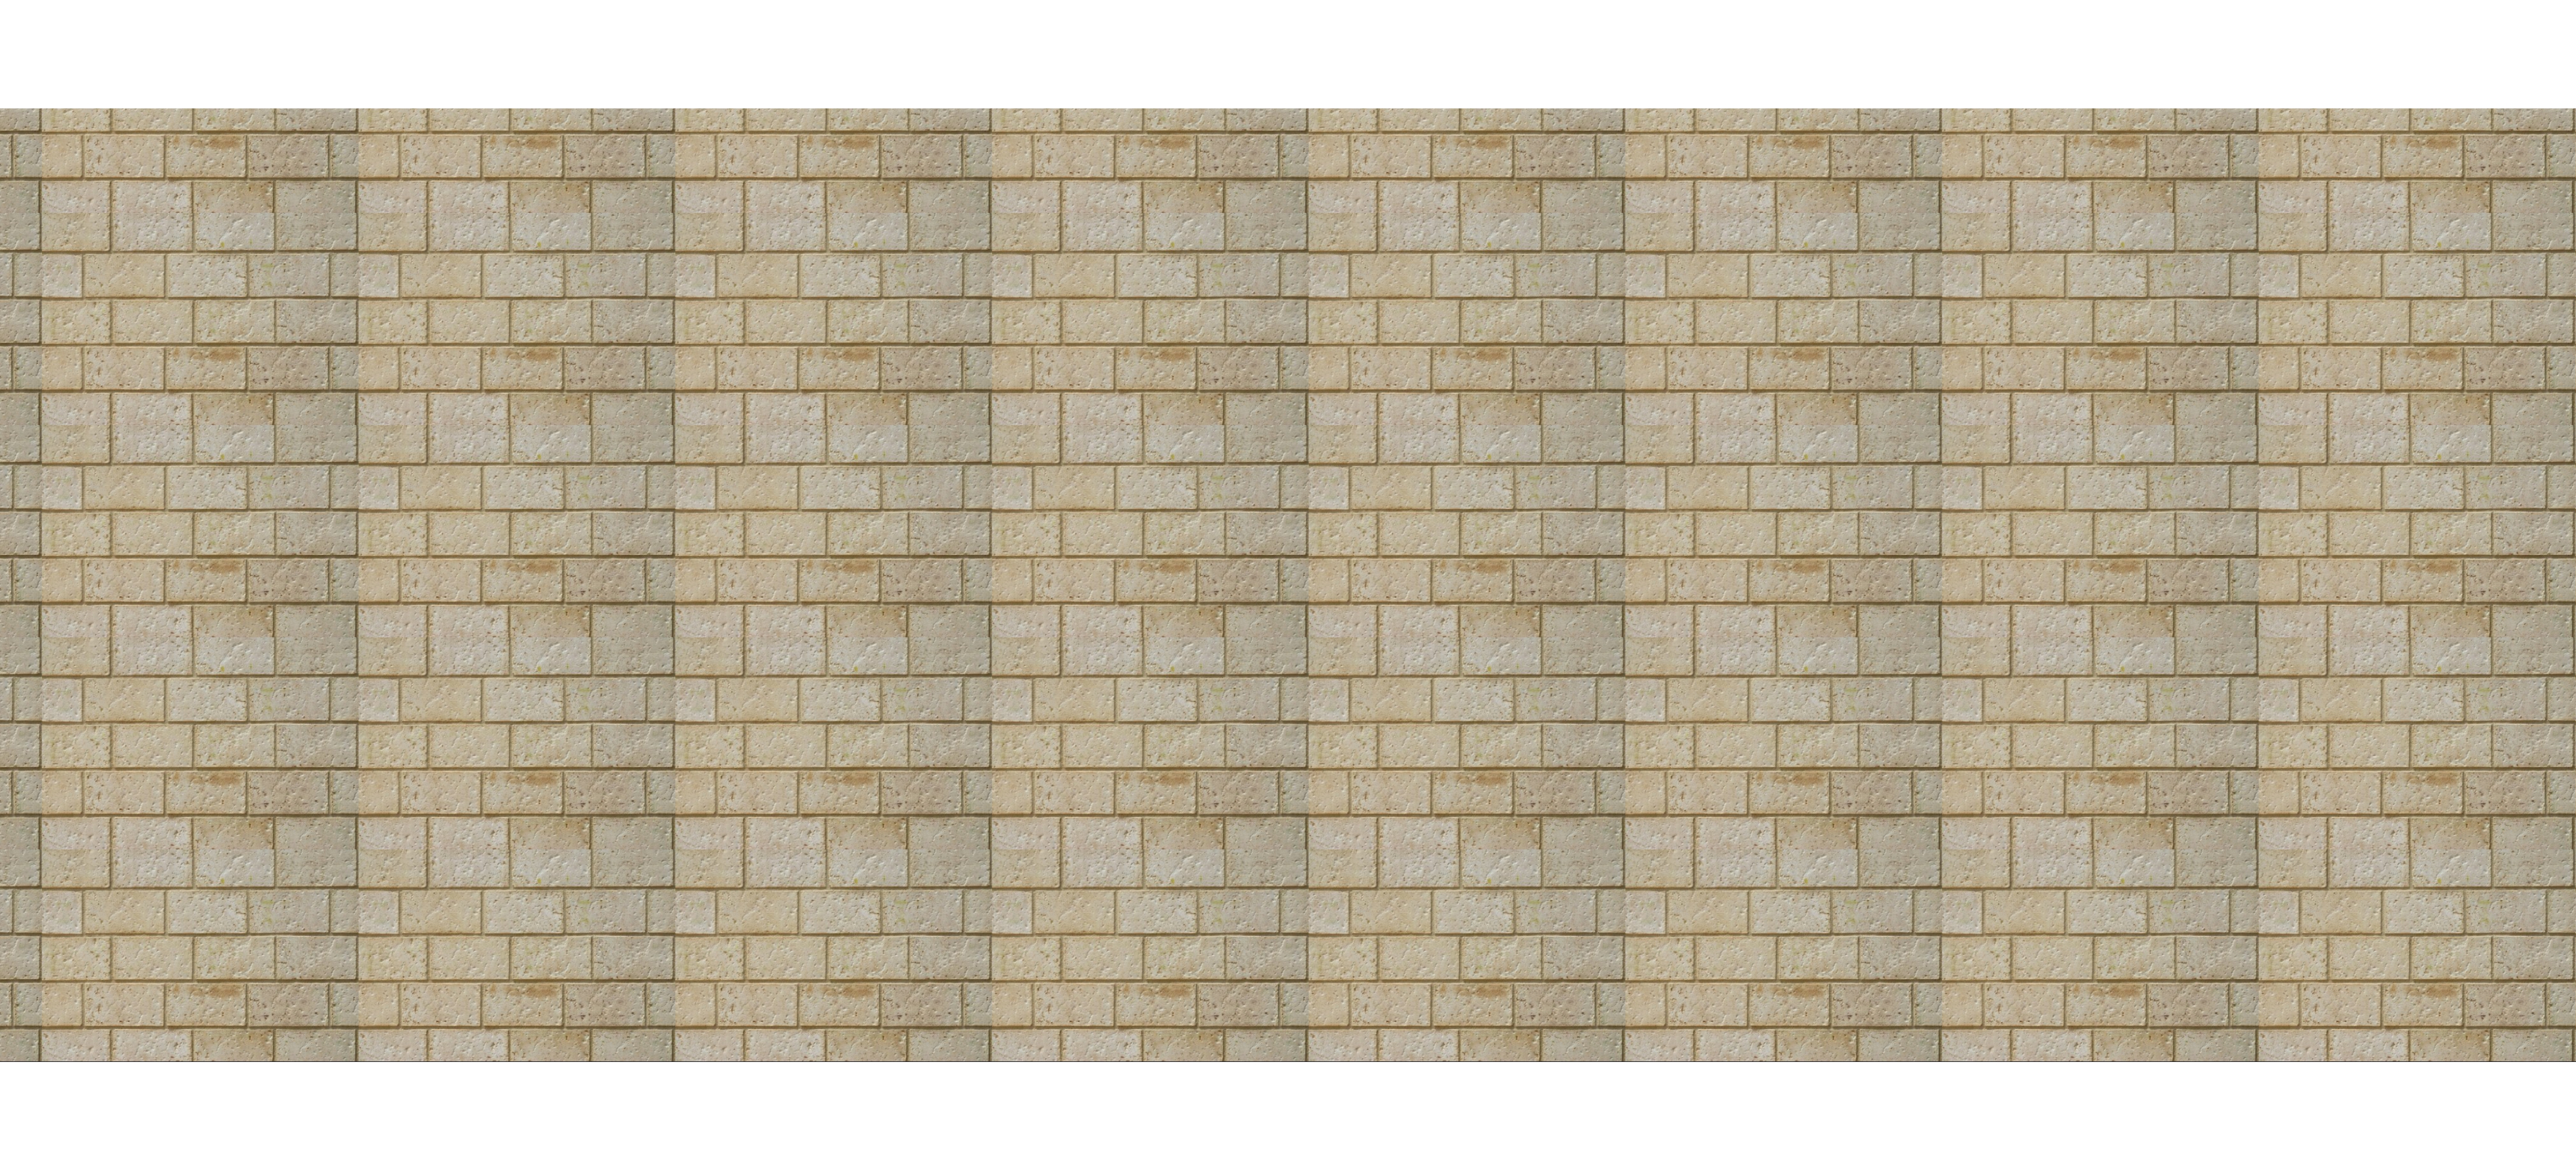
Although that's maybe not the greatest example of a non seamless texture
eager heath
This is a better example http://www.earthenrecords.com/bumpmaptut/badtile.jpg


You clearly see where the texture stops
eager heath
They aren't the same texture
velvet thorn
my gut feel, based on my CV experience, is that this is not a trivial problem
to solve generally
eager heath
Hmm, I was thinking to use things like image rebuilt AI like you can see in photoshop
Maybe I can generate a dataset with non seamless textures and seamless ones
And put them in a 2x2 square
Can the AI learn if you says that there is good textures and bad textures?
 fast pelican
teaching it how to fix the problem will be the bigger issue
surreal willow
dataset.plot(kind='box', subplots=True, layout=(2,2), sharex=False, sharey=False)

pyplot.show()```
Does this give the avarage of all of them? hasty maple
by seam do you mean the edges? like the lines bounding the individual blocks?
eager heath
Yes
hasty maple
so you want it to remove the boundings? like give image with bounds and then get an image without the bounds
eager heath
Depending on what is on the edge of the texture, seams will appear or not when you put when you put them next to one another
More or less yeah
Some technique involve, like in case or rocks, creating individual rocks and pasting a part on one side, and another on the opposite side
hasty maple
I didn't get the rocks example
 lyric canopy
@surreal willow There are no averages in that plots.
eager heath
Let me draw you some stupid examples
lyric canopy
The line in the center of the box is the median, the box itself is Q1-Q3, the whiskers go out to the minimum/maximum, but exclude outliers (usually defined as 1.5*IQR ,the interquartile range/the distance between Q1-Q3, outside of the box)
eager heath
_(I'm on phone I don't guarantee the quality) _
fast pelican
as if my examples are master pieces.
surreal willow
Whiskers are the black lines on the top and bottom?
lyric canopy
yes
surreal willow
Oh so it shows min, max and median?
I guess I gotta learn more about statistics before going to machine learning
lyric canopy
hasty maple
Imma just give an example on how I'd tackle the simple case that we have already understood for now
surreal willow
Ok thank you for your help @lyric canopy
eager heath
So, imagine that you have a texture made of randomly generated geometry object on top of each other (I draw only 3 here, but imagine there is dozens of them on top of each other). To make it seamless, I manually create some geometry objects (in green and red here, but they would look the same in a real world case), and manually place them, so they span over the seam
lyric canopy
One side note: There are different rules for calculating Q1, Q3, and the outliers. Different software implementations of boxplots will therefore create slightly different plots from the same data.
eager heath
Top is before, bottom is after
fast pelican
okay so intelligent content replacement is totally a method to create tessellated textuers
if you could identify the seam lines and crop to the seams
you could probably use some mirroring to make it tile
rather than having to generate objects to intelligently obscure items to make it tile
if that makes sense
as an example.
then you could use the smartness to make the two halves look different inside a certain distance of the seam
as a straight mirror is going to look weird when tiled.
some kind of "skew" parameters etc
hasty maple
so you'd need to give it training examples of images and the (boundings co ordinates for pairs of the vertex of the lines, center pixel/ average pixel in a region), these are the target labels, the output of the CNN model should be these labels. Once the model detects these you'd have to run a program to replace the pixels along the points joining the bounding vertices with the center/average pixel the model provides
fast pelican
reading that made my solution feel lazy.
hasty maple
lol
I don't quite understand the other example he gave after re reading it multiple times >.>
fast pelican
making it tessellate by obscuring artifacts
i used to do this stuff by hand in photoshop in the 00's when doing level design
take photos, do some mirroring, play with the mirrored sections
but correcting a seamed already "tiled" texture to seamless is a different game
eager heath
But with your solution bisk you can't really scale it indefinitely, but at least there is no recurrent pattern 🤔
hasty maple
How exactly did the red and green thingy's make that image/pattern seamless?
eager heath
Because when you put the image in a grid, you can't tell where the texture stops and starts
fast pelican
are you trying to create a massive texture file from a small texture through machine learning?
i'm not sure what sort of resolution images you're trying to produce here but if it tiles...
eager heath
No, just make it seamless
 worn stratus
There are already AIs that tile images into seamless textures
hasty maple
so if I put that block at each pixel blocks(nxn) in a NxN image and a human views it there won't be gaps?
eager heath
Yes ichimaru
fast pelican
just keep mirroring and distorting elements
or modifying each mirror slightly
outside of the tiling boundry
eager heath
The first one would look like this
worn stratus
The paper "Single-Image SVBRDF Capture with a Rendering-Aware Deep Network" is available here:
https://team.inria.fr/graphdeco/fr/projects/deep-materials/
Recommended for you - Neural Material Synthesis: https://www.youtube.com/watch?v=XpwW3glj2T8
Pick up cool perks on our ...
eager heath
As the second would look like this
fast pelican
i do not see how this is better than the mirroring solution
eager heath
Hmm yeah true
But in case of like snow, you won't be able to notice the repeating patern
eager heath
Your solution would be a kinda different solution, but it would be more usable/useful, I think I'm going to go for it :D
fast pelican
plus you can scale that how ever large you want
eager heath
_And make your project x10 times bigger yay! _
fast pelican
if the original is image A, you'd just have to make something that uses some image manipulation to make sure image B (the mirror) is different enough to the original except around the seams
before mirroring
repeat this on horiz / vert mirroring and you've scaled up the size of the texture and it should tile
eager heath
Oh yeah, if I scale it x2, it will became seamless too
Yeah, my brain is slow
So.. How do you think I should tackle the texture deformation? Using pure maths, or using a bit of ML too?
fast pelican
that part i'm not sure about tbh.
as i said before i did this task as a puny human in photoshop in the 00's
you definitely want to use a range of deformations beyond just shapes
alterations in colour tone / light etc
surreal willow
Can someone tell me where I could find information about statistics?
eager heath
Sounds like a good idea, thanks you very much bisk!
fast pelican
no problem.
hasty maple
@surreal willow You can try The Elements of Statistical Learning or An Introduction to Statistical Learning by Hastie & co.
 analog schooner
hey, I'm looking for a dataset where the observational units are companies with information about sales, revenue and management practices, a panel dataset would be perfect, I spent days and couldnt find anything usefull for my project
 deft harbor
How detailed?
oblique belfry
I am wanting to deploy a model on an embedded device (like a Jetson Nano or Raspberry Pi) for a client, and I want to use their existing architecure. What I mean is, I want to be able to run inferences on the devices that they have and not by an external GPU. The client has a demo box with a GPU, but the ones already in production to do not have this attachment. It would cost a lot of money and time to replace all these devices with this external GPU. The units are custom devices and there is little room inside the shell for adjustments. There is definitely no room for a GPU.
I am not having much luck when it comes to finding resources about optimizing models. I mostly just see articles saying how great 8-bit quantization is. I mean, it is nice, but the inference times are abysmal. I am implementing a custom model for action recognition.
Thought about writing the inference part in C++ (currently using cv2 and Keras so I know it could be done), but I am still unsure if it will be fast enough due to it running on a CPU.
I know about Edge TPUs (https://coral.ai/docs/edgetpu/models-intro/), but I am unsure if they will get the job done as well. Incorporating a TPU is more feasible than getting a whole new motherboard.
If anyone has navigated this space, I would definitely appreciate your advice. If we can get our model to work without significant hardware upgrades, then I get to finish the contract quickly and get a bonus. 😃 If not, it is not the end of the world. It would just help our client if I can just role this new feature out as a software update. They are prepared to do it the hard way, but I felt it would be in the best interest of the client to explore this route. Thanks.
Background info: The model architecture is based on Conv3d. So, the input size is (10, 200, 300, 3).
surreal willow
How indepth should I know Statistics for machine learning?
analog schooner
@deft harbor the more than better right?
@surreal willow you should be able to understand "An Introduction to Statistical Learning"
surreal willow
Ok
uncut shadow
Hey. I was trying to make a chatbot in python (generic one, it should create a new text based on data it has). Does anybody know any usefull tutorials or something?
 viral parcel
Hello
worn stratus
@viral parcel what sklearn model are you trying to use on the data?
worn stratus
I think sklearn can just treat pandas dataframes like a dataset
viral parcel
Or I mean I am using alpha vantage intraday
Oh sweet
@worn stratus I dont think so anymore
worn stratus
Try converting the dataframe directly to a numpy array with df.to_numpy()
worn stratus
I don't know sklearn fantastically myself, but whenever I've needed to do anything, just passing it the pandas dataframe directly has worked. My understnading is that the sklearn datasets are just ways of SKLearn presenting data that has been included within the package. If you can't get a pandas dataframe to work as you want, then I don't think I understand the problem well enough and hopefully someone else can help you
jolly briar
does anyone know about aws credits? I've been told i can have 5000, but I've not a clue if that's worth having or not and can't seem to find a concrete answer of how much server time that is worth, or how much monetary value it has 🤔
 unkempt helm
I though that one credit == 1$?
jolly briar
hrm, seems a bit steep... or maybe i've actually been offered something decent lol
unkempt helm
To my inital answer
I've read that AWS Credits is a promotional coupon-code like crediting mechanism
so it's like a coupon thingy? 
jolly briar
yeah but idk what value they have 🤔
unkempt helm
what exactly have you been offered
jolly briar
thought i would find either a server time or monetary
5000
i guess i'll just send the email and say "yes"
i was wondering what it actually meant tho
unkempt helm
well if that's the case then it should be 1 credit == 1 dollar. And server time depends on type of server
jolly briar
well if that's the case then it should be 1 credit == 1 dollar
i don't understand the reasoning here
unkempt helm
there should be a aws calculator where you can check how much it will cost per hour
idk sounds logical to me. If you only got number 5000 then it should be dollars I guess
jolly briar
i got told i could have access to 5000 credits, idk why that means they should cost 1$ each
unkempt helm
maybe
maybe ask those who sent that to you
jolly briar
i think the take home is that we don't know 😅
unkempt helm
From their docs credits are like coupons and could value 1$+ each. But credits could alse be reffering to your credit balance which would be in dollars since you know usual word for that is credit. Idk why they had to name their coupons like that
wait why is this in #data-science-and-ml
jolly briar
yeah it's confusing, no worries though, i was mainly wondering if it was something that someone knew off the top of their head really
unkempt helm
oki
jolly briar
wait why is this in #data-science-and-ml
it's aws related so i figured someone might know in here
 slim fox
@viral parcel if you want any answer it would help if you could have a single post with the code snippet you run, expectected behavior and the error you get
lapis sequoia

Learn the inner-workings of and the math behind deep learning by creating, training, and using neural networks from scratch in Python.
uncut shadow
Hey. Does anybody know any good tutorials for making a neural network from scratch in python?
granite sierra
There's loads out there, literally type into google, neural net from scratch, and you can find one that suits your needs
@uncut shadow
Hey guys, I'm trying to plot a multi label confusion matrix. is that possible, and when I try to plot it, it says only supports classifiers, but I made a classifier from scratch, will that work somehow?
lapis sequoia
good day. Getting this error from trying to seasonal_decompose a pandas.Series object
and this is the error without the conversion from pd.Series to pd.DataFrame
checked the logs on statsmodels and didnt see anything relevant
last case also happens if i try pd.DataFrame(train)
basically its index is DatetimeIndex and the values are np.array with type np.int8, that's how i built the pd.Series, yet it doesnt recognize it as a panda object
when shown through print
train being a interval of time/values from myser
lapis sequoia
i'm reading
velvet thorn
look at train.freq
you will see it is None
basically, instances of DatetimeIndex can have a freq attribute
if it is set, then every value in that index is in running order in interval of freq
lapis sequoia
the real problem is not knowing how to define frequency for a multi seasonality time series
any recommendations (readings)?
velvet thorn
well
the simplest way
would be to take the most granular frequency you can get
but TBH I don't really see why multiseasonality would add a constraint in this regard?
lapis sequoia
the records of lack of activity (0 sales) dont exist. Tbh, my forecasting isnt being precise enough to me. Getting mse of ~30 best case
velvet thorn
what do you mean by the first sentence?
lapis sequoia
trying to forecast next values by hour. There are gaps between some datapoints, when there are no record of sales
so if i have a sale recorded 2am but none til 6pm, it's not pointed in anyway
i tried to use resample but it was a naive approach and skewed the data
velvet thorn
hm
okay, let me clarify
are you saying that 0 sales are not represented in the dataset (which seems like a simple problem), or that there are periods where sales data is not captured (which is not as simple), or something else?
velvet thorn
what do you mean by "skewed" the data?
that seems like a perfectly acceptable approach to me
it seems that the problem is rather with the modelling process?
lapis sequoia
the way i did was not appropriate, i didnt understand properly how to apply the resample
i tried to use .sum(), filling the unrecorded points with 0s
the forecast got much worse after that
might be, i tried to use auto_arima
no pipelines, just fitting using the training portion of the data and checking with the test one
velvet thorn
do you need to use ARIMA?
lapis sequoia
you suggest RNNs instead?
i'm still trying to figure when one is better than another
velvet thorn
no, just curious.
I don't know what your usecase is
but it's good to try different methods
CNNs are viable too
lapis sequoia
true, i was holding back because it took me a lot of reading on sarima and i had to type a lot to adapt the api in order to use it. And i wanted to get more statistical background from the models theory and practices
lapis sequoia
So is tensorflow bacially just math, alot of math functions written in code and then they have made it easy for us to just call the endpoints of the function?
velvet thorn
uh...kiiiiind of...
...but that is rather like saying the Amazon rainforest is basically trees and animals
lapis sequoia
tensorflow is mostly written in c++.. a lot of Google infrastructure relies on frameworks written in C++.. along with their build system that links dependencies.. That's why they keep pushing it, they need people on the outside to be more familiar with it so it doesn't die out
lapis sequoia
HELLO
lapis sequoia
Why is it strutted in c++? Isn’t it possible to write it in any language almost?
Yeah cause they have the infrastructure relies on it
So if I would like to create my own framework, or not a framework, just make everything from scratch and not use theirs, how would I do that? If I want to create my own neural network?
oblique belfry
Technically, Tensorflow is a c++ lib with python bindings. Tensor multiplication is ridiculous slow in plain Python. Numpy is great, but Tensorflow and Pytorch are better at neural nets (and other things) because they great static and dynamic computation graphs. In Tensorflow 1.x, it creates static graphs in the c++ layer, push all the computation in the c++ layer which is highly optimized for the task. Pytorch creates a dynamic graph and is executed by its JIT.
These two heavy weights should be used for real deep learning because they are so optimized and have pre-baked CUDA support.
Feel free to implement these routines personally so that you can understand what is happening, but use code from one of the heavy weights in a real task because that code is battle-hearted and highly optimized for CPU and GPU computations.
worn stratus
I have a multiclass classifier, with 5 classes in my sample, and I'm trying to use sklearn's multilabel_confusion_matrix, however, I don't understand the output correctly.
  [  0   0]]
 [[164  66]
  [  0   0]]
 [[203  27]
  [  0   0]]
 [[203  27]
  [  0   0]]
 [[  0   0]
  [223   7]]]```

I have 230 test samples, and would expect an accuracy of around 50%, what do the 5 matrixes in this output represent? I'm guessing top left is true negative?[TN, TP],
[FN, FP]
``` is that what the ouput for each class is? plain jungle
class Neural_Network():
    def __init__ (self):
        self.inputSize = 3
        self.outputSize = 1
        self.hiddenSize = 2

        self.W1 = np.random.randn(self.inputSize,self.hiddenSize)/2
        self.W2 = np.random.randn(self.hiddenSize,self.outputSize)/2

    def forward(self,x):
        self.z = np.dot(x,self.W1)
        self.z2 = self.sigmoid (self.z)
        self.z3 = np.dot(self.z2, self.W2)
        o = self.sigmoid(self.z3)
        return o

    def backwards(self,x,y,o):
        self.o_error = y - o
        self.o_delta = self.o_error*self.sigmoidPrime(o)

        self.z2_error = self.o_delta.dot(self.W2.T)
        self.z2_delta = self.z2_error*self.sigmoidPrime(self.z2)

        self.W1 += x.T.dot(self.z2_delta)
        self.W2 += self.z2.T.dot(self.o_delta)

    def train(self,x,y):
        o = self.forward(x)
        self.backwards(x,y,o)

    def sigmoid(self,x):
        return 1/(1+np.exp(-x))

    def sigmoidPrime(self,x):
        return self.sigmoid(x)*self.sigmoid(1-x)```

When running this code to get a better understanding of neural networking, I ran into an issue that when feeding

```python
x = np.array(([0,0,0],
              [1,1,1],
              [1,1,0],
              [1,0,1],
              [1,0,0],
              [0,1,1],
              [0,1,0],
              [0,0,1],
              ),dtype=float)
y = np.array(([0],
              [1],
              [1],
              [1],
              [0],
              [1],
              [0],
              [1],), dtype = float)```

this information into the AI, it was preforming better when I left out the instance of [1,1,1] giving [1]. I was wondering if someone could explain why? When [1,1,1] [1] was left in, I was getting false positives for [0,1,0] and [1,0,0].

This goal was ment to predict a binary search tree of : A * B + Cfeel free to ping me
uncut shadow
Hey. I have few questions.
- What is Backpropagation and how does it work? (I googled it, but I don't clearly understand)
- How a CNN can classify images? I mean, they get only pixel values, so they check shapes or something?
jolly briar
@uncut shadow there's an example here https://mattmazur.com/2015/03/17/a-step-by-step-backpropagation-example/

Background Backpropagation is a common method for training a neural network. There is no shortage of papers online that attempt to explain how backpropagation works, but few that include an example…
oblique belfry
A very poor way to describe back prop is a way to minimize a function using gradients. It is a way to update the weights to decrease the error.
There are much better ways to describe it in full, but that is the poor man’s explanation of it.
sand gyro
I posted here a couple of days ago about how to append Pandas dataframe to excel and It seems my new method is working however now appending the dataframe is now giving me a weird value error. I searched for the problem and everyone suggested the problem is in the for loop before the
ws.append
method to change the header to
: False
. However, it was False already. There is something else wrong with it
for r in dataframe_to_rows(df, index=False, header=False):
   ws.append([r1])
raise ValueError("Cannot convert {0!r} to Excel".format(value))


ValueError: Cannot convert   Lastname Firstname Company  ... Personal_email  Note Note_Category
0      Doe      Jane     NaN  ...            NaN  None          None
2  Ramirez    Morgan     NaN  ...            NaN  None          None
3    Burki     Roman     NaN  ...            NaN  None          None

[3 rows x 20 columns] to Excel```hey
i saw this cool project on youtube
where a car learns how to drive
i just wonder if it was made with python
i mean if its possible to make with python too
cuz i it looked like something made in unity
granite sierra
was it the reinforcement learning car, the one from amazon? amazon deepracer I think its called
lapis sequoia

An AI learns to park a car in a parking lot in a 3D physics simulation. The simulation was implemented using Unity's ML-Agents framework (https://unity3d.com/machine-learning). The AI consists of a deep Neural Network with 3 hidden layers of 128 neurons each. It is trained wi...
seems like this
yeah i think you know what i am talking about
this video
is it made with python
?
I mean the ml part of course
 prisma depot
It appears so; it was made with https://github.com/Unity-Technologies/ml-agents

GitHub
Unity Machine Learning Agents Toolkit. Contribute to Unity-Technologies/ml-agents development by creating an account on GitHub.
lapis sequoia
Oh okay
I was looking for python code in the git repository
I found out that they used python yesh for the ML part
And kinda mixed it up with Unity?
I want to learn more about this
prisma depot
At first glance, it looks like the ML-side of it is Python, and it talks over gRPC to the Unity process.
 blazing bramble
Hey guys so i'm designing a scraper that uses the best buy api, for some odd reason when i go through all of the products listed, the index goes out of bounds on the final page, even tho each page is said to contain the same amount of items./
 fallen anchor
Is it possible to convert a view to it's own and return the view to the base?
velvet thorn
what do you mean?
like copy the view so it becomes an array in its own right?
@blazing bramble does it actually?
fallen anchor
arr[2] created a view, arr[2].copy() creates a copy but how do I take arr[2] and make it it's own thing and return owndership of arr[2] back to the original arr ?
velvet thorn
yup, that is the most likely explanation.
ownership does not pass when a view is created
rather, I guess you could say it is shared...?
fallen anchor
I see, so I probably should just copy the view
velvet thorn
yes
fallen anchor
I feel like numpy axis 1 and 0 are flipped
they say 1 is columns but I always end up using 1 to get stuff to work on rows
 balmy geyser
hey folks. are there any matplotlib folks in here?
worn stratus
There are
 sterile plover
hello all what is the prerequisites for learn data science?
I know some python basic stuff
blazing bramble
I wise man once told me, data science is very vast. Choose an area, then reevaluate the question.
Some data science, doesn’t even require programming!
sterile plover
@blazing bramble thanks
jolly briar
I'm still not sure what a numpy view is, is it meant to be like a copy?
 dreamy tartan
Hi, i want to ask something about regression.
I get regression result of my data using LineerRegression, DecisionRegressor and RandomForestRegressor. And differences between results are quite large. They are so different than each other. Is it normal? How should i interpret the results?
LinearRegression
Train Shape:  (22037, 30)
Test Shape:  (302, 30)
Mean Absolute Error:  146.2043271810568
Mean Squared Error:  36174.90301226578
R^2:  -0.03376698178348447
----------------------------
DecisionTreeRegressor
Train Shape:  (22037, 30)
Test Shape:  (302, 30)
Mean Absolute Error:  0.0
Mean Squared Error:  0.0
R^2:  1.0
--------------------------------
RandomForestRegressor
Train Shape:  (22037, 30)
Test Shape:  (302, 30)
Mean Absolute Error:  51.750993377483404
Mean Squared Error:  4691.8239072847655
R^2:  0.8659221660373548
@jolly briar exactly the opposite
@dreamy tartan nonlinear problem
...I don't really see how that's an 80/20 split, though...
looks a bit dodgy.
dreamy tartan
I prepared train and test data manually i just forgot the delete print for split my mistake. @velvet thorn
so what should i do in this case if this is nonlinear problem? could you give reference?
velvet thorn
huh
like
do you understand the difference between the methods?
and their ability to model nonlinearities?
R^2 of 1.0 is weird, should check that
dreamy tartan
I dont have much experience with regression. So in the same time im trying to learn it while creating model. This was the best model I've ever trained but it was doubtful that the results were so different and that the DecitionTreeRegressor gave interesting results.
uncut shadow
Hey. I have another question. What are activation functions for? There are many activation funcs available but which are better?
velvet thorn
uh
the short and slightly inaccurate answer is that
there is no "better", only different
and their purpose is to introduce nonlinearities.
plain jungle
Just bumping this
class Neural_Network():
    def __init__ (self):
        self.inputSize = 3
        self.outputSize = 1
        self.hiddenSize = 2

        self.W1 = np.random.randn(self.inputSize,self.hiddenSize)/2
        self.W2 = np.random.randn(self.hiddenSize,self.outputSize)/2

    def forward(self,x):
        self.z = np.dot(x,self.W1)
        self.z2 = self.sigmoid (self.z)
        self.z3 = np.dot(self.z2, self.W2)
        o = self.sigmoid(self.z3)
        return o

    def backwards(self,x,y,o):
        self.o_error = y - o
        self.o_delta = self.o_error*self.sigmoidPrime(o)

        self.z2_error = self.o_delta.dot(self.W2.T)
        self.z2_delta = self.z2_error*self.sigmoidPrime(self.z2)

        self.W1 += x.T.dot(self.z2_delta)
        self.W2 += self.z2.T.dot(self.o_delta)

    def train(self,x,y):
        o = self.forward(x)
        self.backwards(x,y,o)

    def sigmoid(self,x):
        return 1/(1+np.exp(-x))

    def sigmoidPrime(self,x):
        return self.sigmoid(x)*self.sigmoid(1-x)```

When running this code to get a better understanding of neural networking, I ran into an issue that when feeding

```python
x = np.array(([0,0,0],
              [1,1,1],
              [1,1,0],
              [1,0,1],
              [1,0,0],
              [0,1,1],
              [0,1,0],
              [0,0,1],
              ),dtype=float)
y = np.array(([0],
              [1],
              [1],
              [1],
              [0],
              [1],
              [0],
              [1],), dtype = float)```

this information into the AI, it was preforming better when I left out the instance of [1,1,1] giving [1]. I was wondering if someone could explain why? When [1,1,1] [1] was left in, I was getting false positives for [0,1,0] and [1,0,0].

This goal was ment to predict a binary search tree of : A * B + C@velvet thorn not just sum, also things like .any()
 real wigeon
hey folks
I was encouraged to ask in this channel, because I am using a pandas library
just looking to refactor my code
I think I need to change the #future price change and immediate price change into functions
deft harbor
asdlkjfhasdlkj
real wigeon
yeup
jolly briar
is it fair to say standard regression analysis is still quite a bit more clunky in python than R? I'm basing that on the following : https://zhiyzuo.github.io/Linear-Regression-Diagnostic-in-Python/
Zhiya Zuo
using Python to conduct linear regression diagnostic with statsmodels
seems that there's a fair bit more work there than just plot(model) or whatever in R, but I'm not sure if there are more straightforward approaches than what's outlined in that post
velvet thorn
@fallen anchor well, the idea is that that axis is collapsed
e.g. if you apply an operation on an array of shape (4, 3, 2) over axis=1, the result's shape will be (4, 2) - the second axis, of shape 3, will have been reduced
jolly briar
from sklearn import svm, cross_validation, datasets
iris = datasets.load_iris()
X, y = iris.data, iris.target
model = svm.SVC()
cross_validation.cross_val_score(model, X, y, scoring='wrong_choice')
from : https://scikit-learn.org/0.15/modules/model_evaluation.html
gives me the error :
seems this is out of date?
velvet thorn
yes
you're using the 0.15 documentation.
the current version is 0.22.
0.15 is a bit under 6 years old.
you want
from sklearn.dataset import load_iris
from sklearn.SVM import SVC
from sklearn.model_selection import cross_val_score
hrm, I'll have to be more vigilant on the google
https://scikit-learn.org/0.22/modules/model_evaluation.html
seems to be the updated page, all good, thanks
oblique belfry
I need help optimizing this function.
def z_score_normalize(x):
    """ Scale by z-scores """
    z = np.zeros(shape=x.shape)
    for batch in range(z.shape[0]):
        for row in range(z.shape[1]):
            for col in range(z.shape[2]):
                for mon in range(z.shape[-1]):
                    z[batch, row, col, :, mon] = (x[batch, row, col, :, mon] - x[batch, row, col, :, mon].mean()) / (
                        x[batch, row, col, :, mon].std() + 1e-12
                    )
    return z
Input data is of shape (1900, 5, 5, 12000, 1).
Essentially, I am normalizing this data before it goes into a Keras model. Currently takes me about 7 sec on average. That time adds up when you are training or hundreds of epochs. Much appreciated,
How this is used: x is called from a custom data generator. Then this transformation happens. After that, it goes straight to Keras input later and etc.
velvet thorn
uh...
maybe you can explain what you want to do
it SEEMS like you want to standardise along the 4th axis?
plain jungle
@oblique belfry why so many nested for loops?
like big O notations you're looking at O^4 and yeah thats going to take a while. What is in this x that you are needing to set up to as a 4 demision list
velvet thorn
it has 5 axes
also, I was experimenting
for some reason, the for loop version is faster than the vectorised version (which shouldn't be the case)
my guess is that because the array is so big (and the naively vectorised version uses more memory), time is spent swapping
I used (X - X.mean(axis=3, keepdims=True)) / (X.std(axis=3, keepdims=True) + 1e-12)
okay, I tested it a bit more
on a small array the vectorised version is clearly faster.
so it is probably about swapping
if you have enough RAM, the above version should be noticeably more performant
fallen anchor
(4, 3, 2) is that 3 rows, 2 columns, the entire thing times 4?
velvet thorn
no
rows first
then columns
I don't think there's a standardised term for the dimensions of the 3rd axis onward
velvet thorn
yes
of course, "rows" and "columns" are just abstractions we impose upon the memory layout of an array
fallen anchor
@velvet thorn I think you were wrong
In [2]: np.random.randint(0, 1, size=(4, 3, 2))
Out[2]:
array([[[0, 0],
        [0, 0],
        [0, 0]],

       [[0, 0],
        [0, 0],
        [0, 0]],

       [[0, 0],
        [0, 0],
        [0, 0]],

       [[0, 0],
        [0, 0],
        [0, 0]]])
how many times, rows, columns
velvet thorn
what do you mean
fallen anchor
the entire thing 4 times, 3 rows, 2 columns
velvet thorn
that's how it's displayed
the last axis is the "innermost"
e.g. if you have a 2 row 3 column array it might look like this:
array([[1, 2, 3],
       [4, 5, 6]])
in this case, the column axis is the last, so it is displayed "whole"
fallen anchor
You lost me on that last statement
velvet thorn
okay, I think you think of the array you showed as having 3 rows and 2 columns
because you see 4 chunks of this:
[[0, 0],
 [0, 0],
 [0, 0]]
is that correct?
fallen anchor
yes it is a 3 rows and 4 columns, that entire thing times 4
velvet thorn
that's just how it happens to be displayed
because the memory layout is a computer science concept, whereas rows/columns are a mathematical idea
graphically, it looks like 3 rows and 2 columns, but conventionally speaking, that's not how we describe the data
"rows" in general refers to the first axis, and "columns" to the second, regardless of how we display it graphically
velvet thorn
yes
in general, we take one "row" as a single sample, when handling data
and one "column" as a single type of observation
the other axes are usually more context-dependent
and even what a "column" is can vary
e.g. for image data, the axes in order generally represent (samples, height, width, channels)
so an array of shape (20, 640, 480, 3) would be an array of 20 images, each of which has 3 channels and resolution 640x480.
rows/columns have their main use in the context of 2D tabular data (like what you would work with in pandas)
fallen anchor
OK, that clears it up quite a bit. Thanks a bunch @velvet thorn
velvet thorn
np
plain jungle
Just bumping this
class Neural_Network():
    def __init__ (self):
        self.inputSize = 3
        self.outputSize = 1
        self.hiddenSize = 2

        self.W1 = np.random.randn(self.inputSize,self.hiddenSize)/2
        self.W2 = np.random.randn(self.hiddenSize,self.outputSize)/2

    def forward(self,x):
        self.z = np.dot(x,self.W1)
        self.z2 = self.sigmoid (self.z)
        self.z3 = np.dot(self.z2, self.W2)
        o = self.sigmoid(self.z3)
        return o

    def backwards(self,x,y,o):
        self.o_error = y - o
        self.o_delta = self.o_error*self.sigmoidPrime(o)

        self.z2_error = self.o_delta.dot(self.W2.T)
        self.z2_delta = self.z2_error*self.sigmoidPrime(self.z2)

        self.W1 += x.T.dot(self.z2_delta)
        self.W2 += self.z2.T.dot(self.o_delta)

    def train(self,x,y):
        o = self.forward(x)
        self.backwards(x,y,o)

    def sigmoid(self,x):
        return 1/(1+np.exp(-x))

    def sigmoidPrime(self,x):
        return self.sigmoid(x)*self.sigmoid(1-x)```

When running this code to get a better understanding of neural networking, I ran into an issue that when feeding

```python
x = np.array(([0,0,0],
              [1,1,1],
              [1,1,0],
              [1,0,1],
              [1,0,0],
              [0,1,1],
              [0,1,0],
              [0,0,1],
              ),dtype=float)
y = np.array(([0],
              [1],
              [1],
              [1],
              [0],
              [1],
              [0],
              [1],), dtype = float)```

this information into the AI, it was preforming better when I left out the instance of [1,1,1] giving [1]. I was wondering if someone could explain why? When [1,1,1] [1] was left in, I was getting false positives for [0,1,0] and [1,0,0].

This goal was ment to predict a binary search tree of : A * B + CThanks for the follow ups. I had to make dinner for the fam.
It is weird that that happens. I need to pay more attention to memory and swapping. I have had to be more mindful of this with handling data between the CPU and GPU.
I used
(X - X.mean(axis=3, keepdims=True)) / (X.std(axis=3, keepdims=True) + 1e-12)
@velvet thorn This is replacing that loop, right?
velvet thorn
yes
everything
the function
how much RAM do you have?
on my system, with random data of the shape you specified
the vectorised version was roughly 30% slower
on data that was small enough that all the intermediate results could fit in memory, it was 4x faster
oblique belfry
Yeah...these models run on a Lambda Blade 8-GPU Tesla GPUs with 504 GBs of RAM. We got the RAM. 😄
fallen anchor
that AWS bill has got to be through the roof
also I don't think GPU rams scales like that does it?
more gpus != more ram AFAIK
@velvet thorn are you able to see the pattern on the last one?
I don't see it
oblique belfry
Nah. The client bought it.
No. I was talking about system RAM.
I think Teslas have 25gb of GPU RAM.
fallen anchor
that's a lot of VRAM
oblique belfry
We have found that it is most cost affective in the long run to own a Blade than rent GPUs.
We have a Lambda Quad in the office and it definitely has paid for itself.
fallen anchor
are GPUs more bang for buck?
I know they are faster
but certainly a $2000 threadripper is better than a $2000 gpu
considering the RAM on the GPU is limited
oblique belfry
They are much more efficient for Matrix computations (so Neural Nets) than CPUs.
They are many orders of magnitude faster than a CPU.
velvet thorn
@fallen anchor I don't really understand the question
yup
GPU vs CPU for most neural net stuff is like...
professional boxer vs cute lil' kiddo
the main use of the CPU is to load and preprocess data in ways that GPU computing does not support
(in the context of DL)
RAM matters only while you have not enough
oblique belfry
The only way I have seen any benchmarks showing a close gap between GPU and CPU performance is downloading and compile the Intel Math Library and compile Tensorflow to use that. Even then, GPUs are better in my opinion.
velvet thorn
uh
let me read that slowly
anything above 2D arrays is a bit brain-frying + I just worked out
fallen anchor
I don't see a pattern like I do with when axis is 0 or 1
velvet thorn
okay
so basically the output of that
all
is True when the values in [x, y, 0] and [x, y, 1] are both True
iterating through values of x and y
if you count down from the top, you'll see that you have a [True, True]
the 6th value.
that corresponds to the 6th value in the result, counting left to right, then top to bottom
those values are arr[1, 2, 0] and arr[1, 2, 1]. remember that the axis argument specifies the axis to "collapse" over; accordingly the result is stored at the index [1, 2] (second row, third column).
does that make sense?
unkempt helm
@fallen anchor GPUs can do a huge huge ammount of simple computations at the same time. Whereas CPUs tend to do few tasks but are more powerfull if you give them a single complex task. I hope a worded that good.
So if you use GPUs correctly and break that complex task into many many small little tasks then GPU will be much faster for that task, but that is only if you can properly break that task and if it is even possible to break it down to smaller components.
fallen anchor
That is confusing, thank you though. This is hard to visualize
velvet thorn
also, GPUs are generally better @ independent tasks
neural networks generally involve, as @unkempt helm said, a lot of simple computations, but it's also important that those simple computations do not depend on one another
you can see the numpy analogue in vectorised calculations
unkempt helm
yes that is crucial do not depend on one another, that's why some tasks can't be just simply put to work on gpu
fallen anchor
Why can't they make a processor that does both well?
velvet thorn
e.g. if you have a huge array and take the mean over one axis, the calculation of one mean is not affected by any other
 random bolt
Mobile processor design has a sort of compromise between the two.
velvet thorn
conversely, CPUs have something called speculative execution; they may calculate a result ahead of time so that it won't bottleneck the pipeline, even if that result may not actually be needed
so they might save time (because it's kind of parallelising a sequential computation)
fallen anchor
isn't that the cause of SPECTRE and MELTDOWN?
velvet thorn
or they might waste cycles on something that actually is to be thrown away
random bolt
Yes.
velvet thorn
@fallen anchor yes, in a nutshell
fallen anchor
so CPUs can calculate stuff like logarithms and GPUs can only do + - * /
Or where do they draw the line?
oblique belfry
CPUs are good at everything. GPUs are great at a few things. Some of those are matrix computations and parrallel processing (in terms of parrallel computations).
fallen anchor
but they both calculate the same stuff?
no limitations math feature wise? the difference is speed only?
oblique belfry
One thing about GPUs is moving data from CPU realm to GPU realm can be costly.
velvet thorn
well, in theory (I believe, not really that knowledgeable about the hardware), yes, because you can do a lot of things with just basic arithmetic, as long as you have the right algorithms...but that would be like using tweezers to move a sand pile.
because GPUs have a lot of cores.
oblique belfry
So...you have to weigh the costs.
velvet thorn
CPUs have a few really powerful cores.
e.g. average CPU has like
4-8?
average GPU has thousands
but again, not an expert.
I just write code.

oblique belfry
For big machines, GPU memory is less than CPU memory, so you can't run everything in the GPU realm.
GPUs are decently expensive as well. More than an average computer. The 1080Ti is one of the most common GPUs and it about $1.2K. You can buy a decent dev machine for that amount.
random bolt
Hm.
oblique belfry
Well, not for deep learning, but if you are doing webdev and devops and the like, it would be a great machine.
GPUs also run extrememly hot and consume a lot of power. You got to have special cooling. The Lambda Labs boxes use water cooling to keep the heat down.
velvet thorn
that's USD, right?
oblique belfry
Yeah.
random bolt
It's about right based on a quick search.
velvet thorn
16/20 series have been out for a while and 30 is projected to be released in a few months
oblique belfry
I just did a quick google and saw the Amazon price. You could probably buy it cheaper.
random bolt
Might be nvidia having weird numbering schemes.
velvet thorn
probably in a few months when 30 is out I'm going to get a machine with it
oblique belfry
I was being lazy. 😄
velvet thorn
Ampere
oblique belfry
They also age well.
fallen anchor
seems to me like GPUs should be about *70 times faster than their similarly priced CPUs
velvet thorn
that's the codename
you can't compare specs like that directly
there are a LOT of factors that go into it
random bolt
Also, MHz vs GHz in there.
oblique belfry
I'd compare FLOPs when doing a Neural Net or FFT. You can see the real advantage.
random bolt
GPU vs CPU is like having 1000 accountants vs 1 mathematician. Each will be better at different tasks.
unkempt helm
👌 good analogy
velvet thorn
yes, I agree
oblique belfry
Thing to note, they are better at different things. So, you have to run a benchmark where both intersect in operations, i.e neural nets, computer graphics, etc.
fallen anchor
But how do GPUs get so many, somewhat fast cores, and CPUs get a handfull of fast ones.
GPUs are closer the the CPUs speed than CPUs are to the GPUs core count
random bolt
GPU cores each have a much smaller instruction set than a CPU core.
velvet thorn
^
velvet thorn
and not all instructions take one cycle to execute
fallen anchor
I thought one Hz is just changing one bit
fallen anchor
right
fallen anchor
but it measure how many bits can be set every second
velvet thorn
no, that is not the case
what you have described is probably more along the lines of memory bandwidth.
fallen anchor
so what can take a CPU one cycle can take a GPU 10?
velvet thorn
think of clock speed as an analogue to "how many things the processor can do in a given amount of time"
and the instruction set as "what things can be done"
this of course simplifies the matter greatly, but it's the general idea
correct me if I'm wrong @random bolt
random bolt
That's roughly correct.
With the accountants vs mathematician thing again: the accountants might only know roughly high school level math. In principle, they can do basically anything, but it's a lot of work to translate it into a form they're comfortable working with.
velvet thorn
I felt like making an accountant joke but I think I'll pass
random bolt
The mathematician has a much broader knowledge base, and so can ingest problems much easier, and might know more shortcuts for, say, calculus problems.
velvet thorn
it depends on what you mean by "calculation"
random bolt
The GPU instruction set is probably Turing complete.
velvet thorn
is there a proof of that?
random bolt
Not sure.
velvet thorn
I have no idea what's in the average GPU instruction set
a quick search doesn't turn up much
random bolt
Doesn't help that the manufacturers are quite tight-lipped.
Did find this:
Has the instruction set for hardware that's almost a decade old, but probably at least gets the idea across.
fallen anchor
I wonder if there will be a third major type of processor, not just CPU and GPU
random bolt
Well, mobile cpus are starting to merge the two somewhat.
They tend to have one big processor, and a bunch of little processors, which are roughly analogous to a CPU and GPU respectively.
oblique belfry
There is research into TPUs.
Which to me seems like a cool, hip GPU.
I jest, but I don't know if they can beat a GPU consistently.
Also seems like Google is the only company exploring them.
random bolt
Well, hard to match decades of research into graphical hardware, I guess.
fallen anchor
they offer TPUs on the notebooks and probably GCP too
random bolt
Course, there's also quantum computers, but that's not another kind of processor, that's a whole new ballpark.
oblique belfry
Although GPUs are great, they aren't perfect.
I'd also love to have a chip that has an open standard. Nvidia pretty much has a tight grip on the market. And it is hard to even use a 3rd party GPU because Cuda and CudaDNN dominate that abstraction layer. It is incredibly frustrating.
fallen anchor
There are only two players, and AMD is way late
oblique belfry
Simple economics. If more players can make GPUs and be used by even, competition will drive down price and spur innovation.
fallen anchor
hopefully Intels GPU is good
random bolt
With CPUs at least there's RISC-V, but yeah, GPUs don't really have anything atm.
oblique belfry
Can Tensorflow or Pytorch even run on AMD chips?
oblique belfry
Intel just released their newest GPU. Curious how that goes.
fallen anchor
but officially it only runs on the CPU and nVidia GPUs
oblique belfry
I looked into OpenCL for an embedded project. There is an out of date fork of TF that supports it. The comments on the Pytorch Github issue for OpenCL are funny. The dev basically said it was a lost cost and the shouldn't waste their time.
fallen anchor
ROCm is still behind CUA
but AMD is killing it with their CPUs, hopefully they now have more money to spend on GPU research
oblique belfry
Agreed.
oblique belfry
@velvet thorn Thanks for that suggesstion. I got it to speed up by half.
Teaching moment: Why did you have keepdims=True. The docs give a crappy explanation.
oblique belfry
I am just unsure how it works.
random bolt
Maybe this helps?
https://stackoverflow.com/questions/39441517/in-numpy-sum-there-is-parameter-called-keepdims-what-does-it-do
Stack Overflow
In numpy.sum() there is parameter called keepdims. What does it do?
As you can see here in the documentation:
http://docs.scipy.org/doc/numpy/reference/generated/numpy.sum.html
numpy.sum(a, axis=...
oblique belfry
Thanks. I mean, it is a great add, just a bit unintuitive in concept.
velvet thorn
it matters specifically in this case because we are reducing across an inner axis
because of how numpy's broadcasting rules work
lapis sequoia
How can i append rows in a daraframe with other having some@of the last indexes overlapping which i want to overwrite
@lapis sequoia you can drop your indices.. they're useless anyway..
and why do you have your real name here o.o
Yes i should get it chnaged
Changed
changed wut
Name here
ok
jolly briar
has anyone here carried out clustering with finite mixture models? I've only used distance metrics
arctic wedgeBOT
ask
Asking good questions will yield a much higher chance of a quick response:
• Don't ask to ask your question, just go ahead and tell us your problem.
• Don't ask if anyone is knowledgeable in some area, filtering serves no purpose.
• Try to solve the problem on your own first, we're not going to write code for you.
• Show us the code you've tried and any errors or unexpected results it's giving.
• Be patient while we're helping you.
You can find a much more detailed explanation on our website.
lapis sequoia
Coming back to my question :)
So i have static files which have history data and a new file which have recent data say last 13 months
I want to append history with recent data
and index is in format YYYYMM
By files i mean dataframe
why do you want to care about the index.. either convert it to a column or don't bother
And some dates are overlapping
jolly briar
@lapis sequoia survey data, wondering how best to go about clustering it atm. I'm wondering if i might be better off using some kind of FMM or something as using distance metrics doesn't give much, and something that enables hypothesis to be used might be good here.
lapis sequoia
you want to cluster survey data.. are they time series based?
Yes timeseries
wut.. not you
jolly briar
Some yes, some no, I can say no for this as it seems to make things simpler.
lapis sequoia
ok then no it is then.. let's see how you can cluster..
do you have a snippet of some data to share
jolly briar
I can't share the data no, but I have survey data which are question responses. The levels aren't consistent, and they are typically nominal variables
when I say the levels aren't consistent I meant that they're not all on a scale of 1-5 , there are some with 12 responses, some with 6 etc.
lapis sequoia
what do you hope to find from your clustering
jolly briar
@lapis sequoia clustering groups of people, eventually it would be used to contribute towards predictive modelling / targeting etc
lapis sequoia
ok
does the time data relate only to when the survey was answered?
if you're just doing it for exploratory reasons.. you should try multiple methods and see what gives you explainability..
jolly briar
Yes, sometimes the survey is conducted in the same location across multiple times (so the same survey with week 1,2,3), but this is not so common and not a current focus
Exploratory is important yea
lapis sequoia
gradient boosting, gaussian mixture model with em, k means
jolly briar
I'm unsure how something like a mixture model would work here
Classes, depends, I expect 3 or 5
Iirc
jolly briar
i mean, if i'm assuming distributions of the data, what does that mean in the context of a survey?
seems odd to have normal distributions here
i found MCA from bumping around - that's basically PCA but for survey data
It doesn't seem to be very common, but it's quite neat
lapis sequoia
you're right.. usually mixture models are applied on time series..
kmeans in anomaly detection
jolly briar
I can't use PCA or stuff on here, and methods which convert things to numerical responses are also iffy
lapis sequoia
random forest and gradient boosting seem like they can be useful here
jolly briar
because there is no consistent format to the levels, it's not like converting [small,medium,large] into some kinda space
random forest and gradient boosting seem like they can be useful here
hrm, for exploratory stuff?
rf is supervised, no?
lapis sequoia
you can apply anything to do pca
jolly briar
you can't do pca with this data
@lapis sequoia i don't follow what you have in mind for rf here?
because pca isn't suitable for this data, which is why i used mca instead
velvet thorn
a nominal variable is a discrete variable without an ordering
jolly briar
@velvet thorn yes
velvet thorn
do you still need help @jolly briar
jolly briar
@velvet thorn I'd definitely appreciate thoughts/input yeah, still wondering how best to go about FMM with this kind of thing.
jolly briar
yeah sure
@velvet thorn have survey data, responses have different types (ordinal/nominal) and number of levels.
I would like to be able to cluster this data for explanatory purposes, but also to be able to warrent further investigation into particular subsets of the population.
I've tried standard clustering algo's such as k-means, agnes, but didn't ge much. PCA didn't really make much sense.
As a result of the above I found MCA (multiple correspondence analysis) which is basically PCA for survey data.
There are some rough groupings from the MCA (the axis explained ~5 to 8% of the variance iirc), but I was wondering what the next steps might be. Putting the MCA data into distance clustering yielded better results than the original clustering (although how to interpret them at this point isn't clear to me).
And today I've just started wondering about FMM or something instead.
jolly briar
haven't run t-SNE on it yet actually, and FMM = finite mixture model yes
what's cool - FMM?
jolly briar
hmm... it's all tricky : ' )
velvet thorn
the majority of DS people don't touch anything to do with mixture models
like
Gaussian mixture etc.
or like Bayesian process etc.
jolly briar
yea seems closer to factor analysis and social science tbh
velvet thorn
because the math is non-trivial, IMO, compared to like classical ML
jolly briar
or at least, the angle at which i'm coming at this from
velvet thorn
the only complex classical ML model, IMO, is the SVM
like the optimisation problem
also, yeah, what you said
jolly briar
support vector machine?
velvet thorn
yup
jolly briar
right... the data is tricky to really cluster with a lot of typical ML things, and i was wondering what sort of action i might take based on MCA i guess. ack
have you seen MCA before @velvet thorn ?
velvet thorn
nope, actually
jolly briar
I had never heard of it before this stuff, It seems to be uncommon
velvet thorn
I've never dealt with survey data
velvet thorn
I suppose you've tried DBSCAN
jolly briar
no actually, DBSCAN and t-SNE are both untouched
jolly briar
fair - I'm digging up work from a couple of months back at this point, but I think i was attempting to use a bit more classical stuff... I briefly looked into tSNE and it seemed that it could be tricky to interpret and kinda volatile?
not sure if i misread things there though
velvet thorn
t-SNE is more or less
only for visualisation
well I guess you can use it for clustering in that sense too if you want...
k i n d o f
jolly briar
right, i need to cluster subsets of the population that might be used for further investigation / campaigning etc
velvet thorn
so you're kinda doing user segmentation?
jolly briar
what kinda insights do you typically get from tSNE? Is it anything more than an initial guide as to whether further work is possible?
you're kinda doing user segmentation
yeah
jolly briar
fair, i kinda got that impression
velvet thorn
the point of t-SNE is really reduction to a lower-dimensional space for visualisation
because you can use e.g. silhouette score to assess high-dimensional clustering, for example
but sometimes you need to tell a story
and sometimes you just need to get a visual sense of what the data is like...?
jolly briar
yea, all good... the broad strokes made sense but i didn't really bother... in hindsight it was probably worth a look 🤔
jolly briar
the silhouette scores were complete trash on the clustering i did lol
velvet thorn
t-SNE has been used to visualise phoneme representations in NLP
jolly briar
ah, yeah that sounds cool
velvet thorn
so like the "difference" between consonant clusters
"results" is not really the right term
jolly briar
i actually have some NLP as part of some surveys that I've not really made use of :/
velvet thorn
what do you want to do?
jolly briar
split people into groups, see where which groups are, I have geographical info as well
velvet thorn
no, I mean, the textual data
jolly briar
oh right, well it's all in different languages which doesn't help... I've not thought about it a fat lot, I guess the most basic would be a sentiment analysis. Whether there's some kinda topic modelling that could predict an individual belongs to some latent group or something idk
NLP doesn't matter so much I guess
jolly briar
geographical data would be used afterwards i think, initially it's just national level 🤔 so i don't think that it's too important that the geographical is used for everything, clustering could be done without it
jolly briar
how does one typically work with large data? something around 18GB, I can't work with this in memory... would it typically be sampled, or just uploaded to something like big query
plain jungle
Just bumping this
class Neural_Network():
    def __init__ (self):
        self.inputSize = 3
        self.outputSize = 1
        self.hiddenSize = 2

        self.W1 = np.random.randn(self.inputSize,self.hiddenSize)/2
        self.W2 = np.random.randn(self.hiddenSize,self.outputSize)/2

    def forward(self,x):
        self.z = np.dot(x,self.W1)
        self.z2 = self.sigmoid (self.z)
        self.z3 = np.dot(self.z2, self.W2)
        o = self.sigmoid(self.z3)
        return o

    def backwards(self,x,y,o):
        self.o_error = y - o
        self.o_delta = self.o_error*self.sigmoidPrime(o)

        self.z2_error = self.o_delta.dot(self.W2.T)
        self.z2_delta = self.z2_error*self.sigmoidPrime(self.z2)

        self.W1 += x.T.dot(self.z2_delta)
        self.W2 += self.z2.T.dot(self.o_delta)

    def train(self,x,y):
        o = self.forward(x)
        self.backwards(x,y,o)

    def sigmoid(self,x):
        return 1/(1+np.exp(-x))

    def sigmoidPrime(self,x):
        return self.sigmoid(x)*self.sigmoid(1-x)```

When running this code to get a better understanding of neural networking, I ran into an issue that when feeding

```python
x = np.array(([0,0,0],
              [1,1,1],
              [1,1,0],
              [1,0,1],
              [1,0,0],
              [0,1,1],
              [0,1,0],
              [0,0,1],
              ),dtype=float)
y = np.array(([0],
              [1],
              [1],
              [1],
              [0],
              [1],
              [0],
              [1],), dtype = float)```

this information into the AI, it was preforming better when I left out the instance of [1,1,1] giving [1]. I was wondering if someone could explain why? When [1,1,1] [1] was left in, I was getting false positives for [0,1,0] and [1,0,0].

This goal was ment to predict a binary search tree of : A * B + C@jolly briar that is in the "salty spot"
it depends; if you can take a good sample, then do it
something like BigQuery is okay
or some other cloud service
jolly briar
if i'm in BQ then it's kind of a hassle as i need to use all their tools >:I
jolly briar
what's most common? treat it as a population and take a representative sample?
velvet thorn
that would take the least effort
is
sample
the next option
would be
install more RAM
jolly briar
i don't think i can install more ram in a mac laptop
jolly briar
i thought i could, turns out i can't, it's soldered in 🙃
oblique belfry
@jolly briar What type of data and what are you trying to do?
With no context...
You make it a generator. If it is numerical data, store it as hdf5. When you open the file, the data is not read into memory at that time, only when you need it. So, you could create a generator and slice up that hf5 dataset to get what you need. Dask can be helpful at times. I had to check my work after a refactor, and a np.allclose nearly shut off my computer since I was comparing to masive tensors (poor plannin on my fault). Making those dask array and the doing dask.array.allclose didn't crash my computer.
So...it depends on the data and usecase.
plain jungle
Just bumping this
class Neural_Network():
def __init__ (self):
self.inputSize = 3
self.outputSize = 1
self.hiddenSize = 2
self.W1 = np.random.randn(self.inputSize,self.hiddenSize)/2
self.W2 = np.random.randn(self.hiddenSize,self.outputSize)/2
def forward(self,x):
self.z = np.dot(x,self.W1)
self.z2 = self.sigmoid (self.z)
self.z3 = np.dot(self.z2, self.W2)
o = self.sigmoid(self.z3)
return o
def backwards(self,x,y,o):
self.o_error = y - o
self.o_delta = self.o_error*self.sigmoidPrime(o)
self.z2_error = self.o_delta.dot(self.W2.T)
self.z2_delta = self.z2_error*self.sigmoidPrime(self.z2)
self.W1 += x.T.dot(self.z2_delta)
self.W2 += self.z2.T.dot(self.o_delta)
def train(self,x,y):
o = self.forward(x)
self.backwards(x,y,o)
def sigmoid(self,x):
return 1/(1+np.exp(-x))
def sigmoidPrime(self,x):
return self.sigmoid(x)*self.sigmoid(1-x)```
When running this code to get a better understanding of neural networking, I ran into an issue that when feeding
```python
x = np.array(([0,0,0],
[1,1,1],
[1,1,0],
[1,0,1],
[1,0,0],
[0,1,1],
[0,1,0],
[0,0,1],
),dtype=float)
y = np.array(([0],
[1],
[1],
[1],
[0],
[1],
[0],
[1],), dtype = float)```
this information into the AI, it was preforming better when I left out the instance of [1,1,1] giving [1]. I was wondering if someone could explain why? When [1,1,1] [1] was left in, I was getting false positives for [0,1,0] and [1,0,0].
This goal was ment to predict a binary search tree of : A * B + C sharp dawn
i am trying to make a custom env in Gym, and Keras-RL errors with ValueError: Input 0 is incompatible with layer flatten_1: expected min_ndim=3, found ndim=2
any idea what that means/how to solve it?
jolly briar
@oblique belfry have survey data, responses have different types (ordinal/nominal) and number of levels.
I would like to be able to cluster this data for explanatory purposes, but also to be able to warrent further investigation into particular subsets of the population.
I've tried standard clustering algo's such as k-means, agnes, but didn't ge much. PCA didn't really make much sense.
As a result of the above I found MCA (multiple correspondence analysis) which is basically PCA for survey data.
There are some rough groupings from the MCA (the axis explained ~5 to 8% of the variance iirc), but I was wondering what the next steps might be. Putting the MCA data into distance clustering yielded better results than the original clustering (although how to interpret them at this point isn't clear to me).
And today I've just started wondering about FMM or something instead.
plain jungle
Just bumping this
class Neural_Network():
    def __init__ (self):
        self.inputSize = 3
        self.outputSize = 1
        self.hiddenSize = 2

        self.W1 = np.random.randn(self.inputSize,self.hiddenSize)/2
        self.W2 = np.random.randn(self.hiddenSize,self.outputSize)/2

    def forward(self,x):
        self.z = np.dot(x,self.W1)
        self.z2 = self.sigmoid (self.z)
        self.z3 = np.dot(self.z2, self.W2)
        o = self.sigmoid(self.z3)
        return o

    def backwards(self,x,y,o):
        self.o_error = y - o
        self.o_delta = self.o_error*self.sigmoidPrime(o)

        self.z2_error = self.o_delta.dot(self.W2.T)
        self.z2_delta = self.z2_error*self.sigmoidPrime(self.z2)

        self.W1 += x.T.dot(self.z2_delta)
        self.W2 += self.z2.T.dot(self.o_delta)

    def train(self,x,y):
        o = self.forward(x)
        self.backwards(x,y,o)

    def sigmoid(self,x):
        return 1/(1+np.exp(-x))

    def sigmoidPrime(self,x):
        return self.sigmoid(x)*self.sigmoid(1-x)```

When running this code to get a better understanding of neural networking, I ran into an issue that when feeding

```python
x = np.array(([0,0,0],
              [1,1,1],
              [1,1,0],
              [1,0,1],
              [1,0,0],
              [0,1,1],
              [0,1,0],
              [0,0,1],
              ),dtype=float)
y = np.array(([0],
              [1],
              [1],
              [1],
              [0],
              [1],
              [0],
              [1],), dtype = float)```

this information into the AI, it was preforming better when I left out the instance of [1,1,1] giving [1]. I was wondering if someone could explain why? When [1,1,1] [1] was left in, I was getting false positives for [0,1,0] and [1,0,0].

This goal was ment to predict a binary search tree of : A * B + CI have seen this post bumped 5+ times now. I hate to be that guy, but it seems like no one is interested in that. Sorry.
plain jungle
^
worn stratus
I think it reaches a point where you just have to do some investigation on your own
lapis sequoia
@plain jungle
plain jungle
Yeah I’ve been try I have a few theories, but that’s all what they are and it’d be nice to get a second eye to it all
velvet thorn
yes, but reposting it 3 or so times a day is a bit much
I would normally look @ that kind of thing but quite honestly the naming conventions turn me off
jolly briar
i have a 24GB plain text file and I'm not actually sure what to do with it 🤔 everything i've had previously has been able to fit in memory... So I'm not even sure how to look at this thing, if i try something like cat | head -n 5 > f.txt is it likely to just stress my laptop out and crash?
split -b 500m <file> was pretty useful, not sure if there's a more standard approach or not though
oblique belfry
Well. First idea, you could break it up in chunks. Maybe use a generator when reading the file.
lapis sequoia
Why does pandas merge gives _x and _y appended on column names
i merged two time series having same columns but some overlapping rows
I did merge on index
blazing bramble
Is it possible to data scrape a page with a login/password?
Making an app personal to me that will access my email for instance
deft harbor
Capture the login token
 acoustic scaffold
Does anyone here know how to get tensorflow 2.0 to work on windows 10?
hasty maple
@plain jungle After a quick glance, the cost function(error fn) doesn't look right, what material are you using to implement this network?
lapis sequoia
you shouldn't be doing anything TF (or ml) locally..
@acoustic scaffold Google colab
acoustic scaffold
I switched to Anaconda in my desperation. This seem to work.
@lapis sequoia I have no money.
lapis sequoia
it's free man
Google colab let's you install stuff, save your notebooks to your Google drive
Google Cloud Platform gives you 300$ of free credits. So does AWS Educate. So you can run notebooks or virtual machines for ML on their platform too.
There's also kaggle kernels, you can run decent machines, much better than general laptops/desktops.. so dont gimme that excuse
it's all free
acoustic scaffold
I got RTX 2070
lapis sequoia
are you doing image processing? really depends whether you're going to use your gpu or not..
plain jungle
@hasty maple to be honest it’s my first time messing around with AI, and I just looked st a bunch of beginner tutorials and was testing about with them
If there’s a better direction you can point me in to get started that be awesome too
hasty maple
I'd suggest you do andrew ng's ML beginner course on coursera instead of directly coding up stuff from various tutorials