#data-science-and-ml
1 messages · Page 211 of 1
 acoustic mural
for instance, Facebook is using neural networks to overcome certain bottlenecks surrounding streaming data to a VR headset
 worthy meadow
What would you suggest I spend more time learning?
I've heard AI is just machine learning on steroids
acoustic mural
AI is a subset of machine learning
but many people mean many different things when they say it
i'm not sure what kind of stuff i'd recommend as a prereq for BCI besides like neurology and signal processing
worthy meadow
I'm more interested in the tracking and coding information to discern behaviors/psychology, if that makes sense. Even with eye tracking data, it's amazing what you can uncover about a person with their bio data
acoustic mural
so, are you wanting to learn how to code the tracking stuff, or do you want to learn how to ask the right questions and discover the answers with scientific rigor?
worthy meadow
Both
Asking the right questions, and inferring the answers based on data sets
I think. lol
acoustic mural
you might want to look into the phd route, then
you could probably find a school with a lab working on precisely the stuff you're talking about
worthy meadow
That's a good idea
So, I'm going to ask something so broad it might be insulting to ask, but, what exactly does a data scientist do? I understand working with big data sets and identifying trends for consumers with products, but could you give me more of an overview?
acoustic mural
well full disclosure i'm not a data scientist, i'm a data analyst who's been forcing his career in the data science direction
worthy meadow
What is the difference?
acoustic mural
about $80k base salary difference 😛
worthy meadow
I'm assuming data scientist manipulates more of the data and the analyst....analyzes the data...holy crap lol
wow
How did you become a data analyst?
acoustic mural
accident, my boss needed one and i told her i could figure it out as i went
but the data science stuff i've been doing
making neural networks mimick human judgement on the relevance of news articles
using statistical models to catch new news topics before they blow up
and doing a keyword model by using the latent space of a vector vocabulary
so like... i'm doing data science i guess because i'm designing and implementing each solution, it's just not reflected in my title or salary
worthy meadow
those all sound super human and fascinating
acoustic mural
it's such cool stuff
worthy meadow
how do you qualify judgement? what relevant features do you use to code news articles as people being interested/not interested?
acoustic mural
well we have over a decade of people reading these articles we scrape and marking them with one of several dispositions
i collapsed the dispositions into (generate value for the business) and (don't generate value for the business), and am working on separating them based on that
worthy meadow
based on the number of views the articles get over time?
acoustic mural
mmm no, depending on what one of our researchers marked it as
we collect and curate data for a specific purpose, and we have people reading the news and using the information to build out our product
but we just scrape the web indiscriminately, and need a way to filter out the crap
worthy meadow
ohh
(I'm just now learning about web scraping using selenium, so I can follow this part) Can I ask your background in python?
acoustic mural
i started playing around with python in june because i hit a task i couldn't solve with my current tools, and i've been using it as my main tool ever since
july not june
before that i worked in straight SQL
i should clarify, the data science stuff isn't my job
these are projects i've devised and pitched and am now working on
worthy meadow
I'm trying for a career change with python now. How many years of exp do you have coding in general?
Oh, yes. But you are an analyst, correct?
acoustic mural
like actual programming, i'd say my only serious efforts have been since july, but before that i had 4 years of ad-hoc SQL querying
yes, but the kind of stuff i'm pitching is beyond the mandate of a data analyst
worthy meadow
What would you do as a data analyst?
acoustic mural
build data visualization dashboards, write SQL views, do a lot of ad-hoc root cause analyses
data analysis is fun, challenging work
but data science is cool
so i decided i want to do that now lol
worthy meadow
I'm watching a video on data science right now

► Want to land jobs at Facebook/Google/Microsoft/Amazon? Learn how to do that here: http://techinterviewpro.com/ ► Resume Template and Cover letter I used fo...
acoustic mural
i've actually watched that, it was interesting
acoustic mural
well if i recall correctly he describes several tracks within data science
but yeah
worthy meadow
so what modules would I need to be familiar with for data analyst/data science work with python, in your opinion?
acoustic mural
Pandas is #1
then Numpy, Pyodbc (or an equivalent), NLTK, and Gensim
have all been indispensible to me
 lapis sequoia
nltk and gensim are kinda old now
acoustic mural
but their text processing tools are solid
lapis sequoia
let me see if they open sourced tensorflow text yet
worthy meadow
i've only seen the word pandas, but never heard of pyodbc, NLTK and Gensim
lapis sequoia
you can launch something remotely
acoustic mural
if you can help them finish porting it to windows i'll be your best friend because i was so excited watching the talk on that and couldn't wait to apply it
is gensim old? it has a full fasttext module, and that was only published in what late 2016?
anyways last recommendation is a combo, if you want to get into deep learning the best place to start in my opinion is keras, specifically tf.keras in tensorflow 2
worthy meadow
awesome man
 river plume
@deft harbor @quaint halo thanks guys I'll check out stats 110
lapis sequoia
gensim is old af
2016 is like a decade ago in DS terms:P
TensorFlow
welcome to TF text
acoustic mural
i'm currently restricted to just a windows environment, and that module isn't available on windows yet
lapis sequoia
do you need to build things that run on windows..
I don't understand why you're restricted
acoustic mural
because it's a work computer, and my only available computing environment at the moment for work stuff
 vale hedge
anyone know how hard it is to use a tensorflow model in java?
I wanted to make and train model in python preferable using pytorch or keras then load and use it in java
anyone have any suggestions on how to do this?
acoustic mural
this looks promising https://medium.com/@alexkn15/tensorflow-save-model-for-use-in-java-or-c-ab351a708ee4

Medium
Recently, I searched how to save a Tensorflow model to a single *.pb file. Unfortunately, there is not enough information about that…
might not still be 100% accurate with 2.0 but it might get you most of the way there
vale hedge
thanks do you know what can be included in model saved?
 restive granite
Is 'Python for Data Analysis' a good way to start or would you recommend a different book?
 mighty tartan
joma tech is more "entertainment" then real
also just start a tutorial doesn't matter what
you learn by doing it yourself not by the source you have
 quaint halo
hands on machine learning is a great book
 topaz matrix
hi, i want to store the data i was able to scrape from a website like this > https://docs.google.com/spreadsheets/d/115tK8HygwpYaOz2OTOlos4NPT56-rFQ7bY8dZc-Fdm8/edit?usp=sharing

Google Docs
Sheet1
Dates,From', ,To', ,Faculty', ,Topics/Test', ,Notes', ,Batch',
['2019-11-04',,08:00', ,10:00', ,RJp Sir,Communication (Boards + CET),3h/3h', ,Kandivali (T.P. Bhatia) - TPS1-CET
10:15', ,13:15', ,asasa,asdsadd,adasdasds,asdsdffs
561256,325320,assd,aSAS,AAsa,asdd
56251...
import pandas as pd
from bs4 import BeautifulSoup

with open("tabledata.html", "r") as f:
    contents = f.read()
    soup = BeautifulSoup(contents, 'html.parser')

dates = soup.find_all(class_="date")
tables = soup.find_all(class_="table table-bordered")

list_of_tables = [table.text for table in tables]
list_of_dates = [date.text for date in dates]
data_of_table = [lines.split("\n") for lines in list_of_tables]

#print(list_of_dates)
#print(data_of_table)
table_stuff = pd.DataFrame(
    {
        'Dates' : list_of_dates,
        'Dunno' : data_of_table,
    })
print(table_stuff)
can anyone help me get this data arranged in manner as in the sheets?
acoustic mural
your columns don't seem to have consistent data types, is that on purpose?
topaz matrix
the website I'm scraping is a dynamic one
should i send the html file so you can have a better picture?
acoustic mural
ok but in the spreadsheet, some of your columns have dates, numbers, and text. short of casting everything to a string and writing it like that, i don't think pandas has support for this type of thing
in pandas a column has to have a single datatype
topaz matrix
the code i wrote above gave me this output
      Dates                                              Dunno
0  2019-11-04  [, , , From, To, Faculty, Topics/Test, Notes, ...
1  2019-11-05  [, , , From, To, Faculty, Topics/Test, Notes, ...
2  2019-11-06  [, , , From, To, Faculty, Topics/Test, Notes, ...
3  2019-11-07  [, , , From, To, Faculty, Topics/Test, Notes, ...
4  2019-11-08  [, , , From, To, Faculty, Topics/Test, Notes, ...
5  2019-11-09  [, , , From, To, Faculty, Topics/Test, Notes, ...
is there some other way I can sort data like in that sheet?
these are the columns : Dates, From, To, Faculty, Topics/Test, Notes, Batch
dates are working, the table part is the main problem
topaz matrix
okay so new code.. this looks more promising.
import pandas as pd

with open("tabledata.html", "r") as f:
    contents = f.read()
    table = pd.read_html(contents)
    #table.to_excel("data.xlsx")
    print(table)
gives output:
tried exporting it to .xlsx file as you can see but it gave an error..
Traceback (most recent call last):
  File "test.py", line 6, in <module>
    table.to_excel("data.xlsx")
AttributeError: 'list' object has no attribute 'to_excel'
what are you trying to do
didnt I post pseudo code for you to follow last time you asked this
you have two columns (as from your output above), you need to expand your list because you can't write this table to excel as it is
write a new dataframe with elements in the list in separate columns
topaz matrix
@lapis sequoia apologies.. I totally missed the pseudo code part.. let me check it out
okay so I'm probably making some mistake but its not working
import pandas as pd
from bs4 import BeautifulSoup

with open("tabledata.html", "r") as f:
    contents = f.read()
    soup = BeautifulSoup(contents, 'html.parser')

dates = soup.find_all(class_="date")
tables = soup.find_all(class_="table table-bordered")

list_of_tables = [table.text for table in tables]
list_of_dates = [date.text for date in dates]

column_name_list = ['Dates', 'From To Time', 'Faculty', 'Info']
df = pd.DataFrame(list(zip(list_of_dates, list_of_tables)),
               columns = column_name_list)
df.to_csv(data, index=False)
let's break this down..
lapis sequoia
your scraping code is different from the part you use for cleaning.. and the part you use to load it to dataframe.. and the part you use to write to csv
that's why we have functions..
now, let's see where you're stuck.. which is dates and tables
show me how they look like
topaz matrix
should i send a img of actual table?
topaz matrix
lapis sequoia
as long as there's no personal info.. it's good
I meant content inside your dates and tables variables
lapis sequoia

Stack Overflow
I'm pretty much brand new to Python, but I'm looking to build a webscraping tool that will rip data from an HTML table online and print it into a CSV in the same format.
Here's a sample of the HTML
clean the data you scraped
topaz matrix
clean in the sense sort dates in some dates list, timings in it's own list, and so on?
lapis sequoia
consider this
if you want some things in the same row, they have be one object, like a list or tuple
so if you're going to put a bunch of row in to a dataframe, then it has to be a list of lists or a list of tuples
topaz matrix
i understand
topaz matrix
okay so this code is working! it's doing it for only the 1st table
from bs4 import BeautifulSoup

with open("tabledata.html", "r") as f:
    contents = f.read()
    soup = BeautifulSoup(contents,"lxml")
    table = soup.find('table')

list_of_rows = []
for row in table.findAll('tr'):
    list_of_cells = []
    for cell in row.findAll(["th","td"]):
        text = cell.text
        list_of_cells.append(text)
    list_of_rows.append(list_of_cells)

for item in list_of_rows:
    print(' '.join(item))
OUTPUT:
From To Faculty Topics/Test Notes Batch
08:00 10:00 RJp Sir Communication (Boards + CET) 3h/3h Kandivali (T.P. Bhatia) - TPS1-CET
10:15 13:15 RJp Sir Electron & Photon (Boards + CET) 4h/4h Kandivali (T.P. Bhatia) - TPS1-CET
so, how can I loop through all the tables in the tabledata.html?
from bs4 import BeautifulSoup

with open("tabledata.html", "r") as f:
    contents = f.read()
    soup = BeautifulSoup(contents,"lxml")
    table = soup.find('table')

list_of_table = []
for all_table in table.findAll('table'):
    list_of_rows = []
    for row in table.findAll('tr'):
        list_of_cells = []
        for cell in row.findAll(["th","td"]):
            text = cell.text
            list_of_cells.append(text)
        list_of_rows.append(list_of_cells)

    for item in list_of_rows:
        print(' '.join(item))
tried this loop, gives no output
from bs4 import BeautifulSoup

with open("tabledata.html", "r") as f:
    contents = f.read()
    soup = BeautifulSoup(contents,"lxml")
    table = soup.find('table')

list_of_table = []
for all_table in table.findAll('table'):
    list_of_rows = []
    for row in table.findAll('tr'):
        list_of_cells = []
        for cell in row.findAll(["th","td"]):
            text = cell.text
            list_of_cells.append(text)
        list_of_rows.append(list_of_cells)

    for item in list_of_rows:
        print(' '.join(item))
for all_the_tables in list_of_table:
    print(''.join(all_the_tables))
this is not working either
topaz matrix
import csv
from bs4 import BeautifulSoup

with open("tabledata.html", "r") as f:
    contents = f.read()
    outfile = open("table_data.csv", "w", newline='')
    writer = csv.writer(outfile)
    tree = BeautifulSoup(contents, "lxml")
    table_tag = tree.select("table")[0]
    tab_data = [[item.text for item in row_data.select("th,td")]
                for row_data in table_tag.select("tr")]


    for data in tab_data:
        writer.writerow(data)
        print(' '.join(data))
this code seem to return and store only one table, how can I do it for all tables and also include dates?
 lament hatch
uh so is there any library for google search like keywords or phrase matching.
Actually say i have a dataset of questions and its answers. I somehow want to get that question object from database with similar phrases or keyword as queried.
Or i will have to use NLP ?
or maybe use NLTK to get keywords or something and then use regex
lapis sequoia
@lament hatch you're trying to solve match answers to questions? That's called Question answering.. classic problem
lament hatch
yeah
lapis sequoia
no regex.. NLTK is too old and useless..
it depends on what domain your questions are based.. and whether your answers contain enough context that can be interpreted
for example..
I bought a dodge viper. .... What sort of car did you get?
so if the first sentences was in a list of sentences.. and the question on the right was in a list of questions
the question would show up ranked high when doing QA
lament hatch
i see
lapis sequoia
so understand what we have here is top n matches.. and you can choose to select just the highest ranked one based on a score
lament hatch
yeah
lapis sequoia
so, frame your problem first and then we'll see what method to use
lament hatch
but first i was trying lookikng for QA datasets
lapis sequoia
what sorta question and answers are you handling.. is it a closed domain problem
right.. then you're just doing this for practice or homework
hmmmm
lament hatch
actually
lol
have hackathon tom in college
so i thought of making offline answering app for questions
lapis sequoia
I see you're listening to a korean artist...I've listened to one of her songs:p
lament hatch
lol i love her voice
lapis sequoia
sure... I can't help you with app development.. but if you can frame what domain you're trying to do QA in, it'll be easier
consider this... What is the power house of the cell? .... vs. How much power do I have left?
lament hatch
i see i seee
lapis sequoia
the first domain is biology.. the second is something general or random
so, when you're not handling QA for a close domain.. you need a knowledge graph to supplement your system.. those are highly complex information archives
meaning, when you want to do QA for multiple domains, first thing you need to do is restrict your Q and A to domains.. then you start the ranking
that's how Google does it
so if you're trying to build an App.. I suggest you choose a domain
lament hatch
um i think i can stick to particular domain like science only
lapis sequoia
Semantic matching is a technique used to identify information which is semantically related. We present some research results in this area.
this so you can get a general idea
lament hatch
tho i would prefer science if i had to
lapis sequoia
ok.. now ways to approach this
lament hatch
ik considering multiple domains datasets will be like in TBs
lapis sequoia
you can use a semantic matcher that's already trained and just fit it on your dataset
or you can train a semantic matcher on science data
wut
lament hatch
tho any idea where i can find QA datasets for science or other similar domains
lapis sequoia
topaz matrix
import csv
from bs4 import BeautifulSoup

with open("tabledata.html", "r") as f:
    contents = f.read()
    outfile = open("table_data.csv", "w", newline='')
    writer = csv.writer(outfile)
    tree = BeautifulSoup(contents, "lxml")

    dates = tree.findAll(class_="date")
    list_of_dates = [date.text for date in dates]

    table_tag = tree.select("table")[0]
    tab_data = [[item.text for item in row_data.select("th,td")]
                for row_data in table_tag.select("tr")]
    writer.writerow(list_of_dates[0])
    for data in tab_data:
        writer.writerow(data)
        print(' '.join(data))

    table_tag1 = tree.select("table")[1]
    tab_data1 = [[item.text for item in row_data.select("th,td")]
                for row_data in table_tag1.select("tr")]
    writer.writerow(list_of_dates[1])
    for data1 in tab_data:
        writer.writerow(data1)
        print(' '.join(data1))
is there any way to iterate over the table for no. of tables in the tree?
also, do we have any method to write dates in a single cell?
 lyric canopy
A single cell in a csv file already on disk?
topaz matrix
while writing the table
I looked it up online, seems like csv can only write rows
still, how can I iterate over this ```python
table_tag = tree.select("table")[0]
tab_data = [[item.text for item in row_data.select("th,td")]
for row_data in table_tag.select("tr")]
writer.writerow(list_of_dates[0])
for data in tab_data:
writer.writerow(data)
print(' '.join(data))
What does tree.select return? Is it a list or another type of iterable?
If so, instead of selecting one with [0], you could probably iterate over it with a for-loo
topaz matrix
<table class="table table-bordered">
<thead class="tt-header" id="theader">
<tr>
<th>From</th>
<th>To</th>
<th>Faculty</th>
<th>Topics/Test</th>
<th>Notes</th>
<th>Batch</th>
</tr>
<!--<tr>
<td id="2019-11-04" colspan="7" class="date">2019-11-04</td>
</tr>-->
<tr class="physics">
<td>08:00</td>
<td>10:00</td>
<td>RJp Sir</td>
<th>Communication (Boards + CET)</th>
<td>3h/3h</td>
<td>Kandivali (T.P. Bhatia) - TPS1-CET</td>
</tr>
<tr class="physics">
<td>10:15</td>
<td>13:15</td>
<td>RJp Sir</td>
<th>Electron & Photon (Boards + CET)</th>
<td>4h/4h</td>
<td>Kandivali (T.P. Bhatia) - TPS1-CET</td>
</tr>
</thead>
<tbody>
</tbody></table>
this is what tree.select returns
what will be the loop if instead of [0]?
 odd osprey
why cv2.imdecode read single image into x,y,3 shape?
lapis sequoia
hello
i'm really new to machine learning
like it's my first try at it
what's a good thing to start with
nvm
Welcome Again To My Blog. Today In this Post I am going to write about How We can create Simple Tic Tac Toe Game With Artificial Neural Network With PyBrain Python Module.
Oh my god
is there something i can download and play with
Nvm found something
 upper ginkgo
Hey I need help with keras and tf
I recently changed my VPS and had to move my projects to a new virtual machine
and now I'm getting this when predicting
tensorflow.python.framework.errors_impl.FailedPreconditionError: Error while reading resource variable dense_1/kernel from Container: localhost. This could mean that the variable was uninitialized. Not found: Container localhost does not exist. (Could not find resource: localhost/dense_1/kernel)
         [[{{node dense_1/MatMul/ReadVariableOp}}]]
I don't understand, how can I fix that?
        with trainer.graph.as_default():
            results = model.predict([input_data])[0]
I'm predicting like this
#loading the model
            model = load_model("models/model.h5")
            model._make_predict_function()
            self.graph = tf.compat.v1.get_default_graph() #self is the trainer
#training the model
    model = self.get_model(train_x, train_y)
        model.save("models/model.h5")
        self.graph = tf.compat.v1.get_default_graph() #self is the trainer
I didn't have these errors in the old VM
upper ginkgo
hello?
 kindred flame
Do i need sql for machine learning?
acoustic mural
no but it helps if the data you're going to use for training is stored in a database
also getting good at SQL will really differentiate you from other job applicants, speaking from the other side of the interview table
it just won't die for some reason 😛
 slim fox
Why should it xD
 deft harbor
@upper ginkgo https://stackoverflow.com/questions/54772549/container-localhost-does-not-exist-error-when-using-keras-flask-blueprints
Stack Overflow
I am trying to serve a machine learning model via an API using Flask's Blueprints, here is my flask init.py file
from flask import Flask
def create_app(test_config=None):
app = Flask(__na...
 fallen anchor
hi
Lets say I have data like this
I want to compare the thinner purple and thinner pink line to the thick green one
I was thinking I could just average all the y values for each line and compare that way
but the pink one is obviously very bad. look at those spikes
but If I average all of the pinks y-values the spiked kinda cancel each other out
and it would probably under the method of just averaging all y values be consisered good
but really the only good one is the purple one
what kind of alogrithm prevents matching these bad curves to the green one?
 devout ridge
rms is a pretty standard error formula
basically, for each x-coordinate, take the difference in y and square it
adding everything up and taking the square root gives the RMS error
fallen anchor
where can I find other such formulas?
I will see if rms will work here though, so thanks
 soft siren
@fallen anchor you can look at the Wikipedia error metrics page https://en.m.wikipedia.org/wiki/Error_metric
An Error Metric is a type of Metric used to measure the error of a forecasting model. They can provide a way for forecasters to quantitatively compare the performance of competing models. Some common error metrics are:
Mean Squared Error (MSE)
Root Mean Square Error (RMSE)
M...
All of those are broadly used metrics
fallen anchor
Perfect, thank @soft siren
 grave copper
Hi, does anyone know how to create borders like this example in a jupyter notebook?
 brisk shuttle
Does anyone know sth about networkx? I'm trying to get the max degree node of my graph without manually iterating over it
upper ginkgo
@deft harbor thanks! it worked, although it's weird
deft harbor
Glad it worked at least
river plume
hey guys, how to parse xml files that contain dangerous characters like &
I mean I want to convert all the & to & and all the \n to
lapis sequoia
Hello
do you guys have experience with surrogate models?
I am trying to understand how those work
soft siren
@lapis sequoia if we’re talking about the same thing, surrogate models are often used to build an emulator over another model, primarily because the first model is computationally expensive
deft harbor
acoustic mural
😂
kindred flame
Hey
How to get into data science?
Just get a udemy course about ml for beginning?
deft harbor
@kindred flame how is your probability, general stats and math?
lapis sequoia
start with statistics..
be comfortable with matrices and basic math for ml before you start ml
focus on applying ML to a domain of your interest, that should be your objective when you start learning.. it could be for marketing, for sales, image processing, nlp tasks, finance, genomic data science, etc.. find your domain first..
ML otherwise is for research about different methods, areas of improvement.. and for that you need an advanced degree
There's free stats courses on Udacity.. Practice your coding skills on hackerrank.. understand fundamentals on datacamp.. Get into the habit of reading papers then compete in hackathons and kaggle..
that's the way to get into data science
lapis sequoia
anyone available? need help with some matplotlib visualization
 mental merlin
i can be a rubber duck
lapis sequoia
this is my current df
I'm trying to plot a bar plot for column Season's value_counts (basically frequency)
how do I change the order of the bars? in this case it should be 2012-13, 2013-14, 2014-15, and so on
each Season value (for example, 2012-13) is a string btw
 glacial rain
plt.xticks() might be what you need
Stack Overflow
Whenever I plot, the X axis sorts automatically (for example, if i enter values 3, 2, 4, it will automatically sort the X axis from smaller to larger.
How can I do it so the axis remains with the...
lapis sequoia
I got it thx! @glacial rain
lapis sequoia
anyone around?
devout ridge
!ask
 arctic wedgeBOT
ask
Asking good questions will yield a much higher chance of a quick response:
• Don't ask to ask your question, just go ahead and tell us your problem.
• Try to solve the problem on your own first, we're not going to write code for you.
• Show us the code you've tried and any errors or unexpected results it's giving.
• Keep your patience while we're helping you.
You can find a much more detailed explanation on our website.
 limber sinew
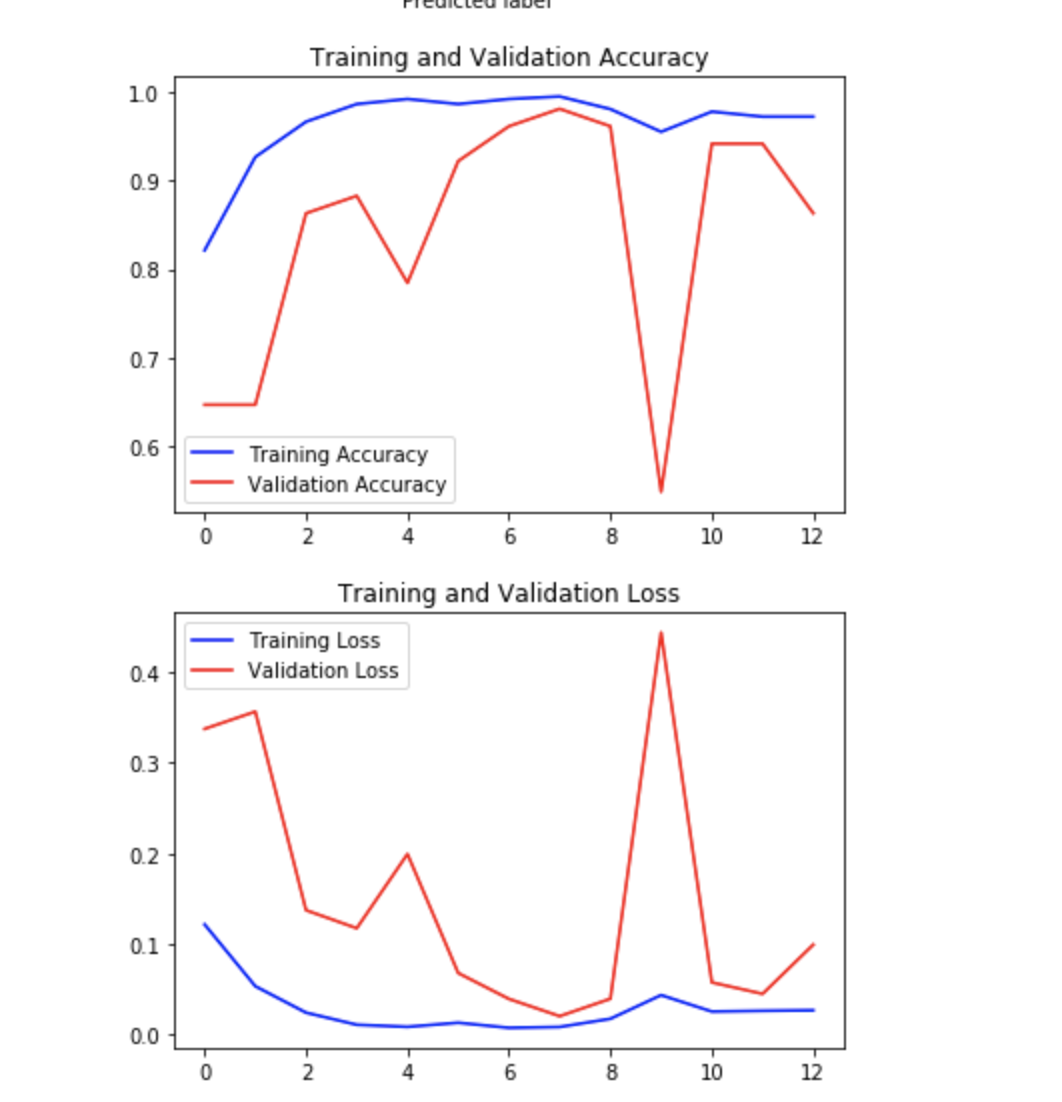

 earnest prawn
it is prooobably nothing considering how the graph does continue afterwards
deft harbor
run it again using cross validation
acoustic mural
looks like it made a bad move one epoch and then corrected it the next
some of the loss landscapes have pretty high gradients in places
lapis sequoia
why didn't training accuracy reduce drastically
 native stag

Making developers awesome at machine learning.
this website is insane so much content
deft harbor
Just machine learning?
As in creating new machine learning methods, or just using libraries to learn f(x)?
 somber hamlet
"creating new machine learning methods" is basically impossible if you're not a searcher
 rare tundra
Knowledge
 polar acorn
Anyhow, @lapis sequoia check the pinned messages.
 crude zealot
Can anyone help ?
or should i ask in the help section because i have a very simple question on data science so figured id try here rather on the help channel
acoustic mural
what's the question?
crude zealot
I have a dataset containing 3 columns of same type for eg profit but its year wise (birth rate 2016 , birth rate 2017 , birth rate 2018)
now i know how to predict if i have one column of it and do regression or any other method
But if i want to take all three of the columns and predict the birth rate for 2019
how should i do that
crude zealot
anyone?
lapis sequoia
reading
are you still here
@crude zealot ok, so you understand basic regression is predicting dependent variable Y for independent variable X.. Y = mX+b
Multiple Regression is when your inputs are multiple X's.. like in case of house prices (Y) predicted from multiple variables like ceiling height, neighborhood, number of rooms.. etc
Multivariate is when you have multiple Y's predicted from multiple X's
crude zealot
@lapis sequoia Yea that i know and i have tried out dummy datasets to practice regressions and svm and other methods
I just wanted to ask that for eg if we have a dataset with neighbourhood prices in different year with area sq ft and price based on the respective area how will i be able to use it to predict future price in that same area
Area Price in $(2016) Price in $(2017)
500 35000 40000
so like this if i have a data set with 50 or 100 rows how will i be able to predict the price of Price in $(2018)
 winged jacinth
hi, I am trying to find a way to create relations between certain IT terms, for example: ('python', 'data science') would be terms highly related but ('c','data science') would be less related
I tried looking into topic modelling, but afaik I can't give my own keywords for the model creation
can anyone point me in the right direction?
 exotic reef
Interesting, had no idea there was a name for that
(panel data)
Do you have data you can draw thesw relationships from or you need to hard code some rules? @winged jacinth
winged jacinth
yeah, I am trying to extract it from job offers (linkedin, glassdoor,...)
i got some interesting results using topic modeling, but because I don't define the terms, they are not really useful for my case https://hastebin.com/docofuwowi.bash
exotic reef
i'm not sure i understand what you mean by terms - you mean the groupings? Do you want to do classification according to predefined classes?
For example, do you want to label the relationship (python, datascience) as something or you just want to extract that they are related?
 silent swan
word vectors
acoustic mural
agreed with sh33mp, tokenize the job listings and run them through word2vec. might want to generate multiword tokens, though (e.g. "data_science")
fallen anchor
I need help with pandas dataframes
what is the ideal way to iterate over the df and for each row 1. read some columns of the row. 2. process the data just read. 3. generate a new column value for that row
lapis sequoia
yes.. that's why you don't iterate over rows, because it's slow and not efficient
what's your condition...maybe I can try to help
fallen anchor
I will abstract it
import pandas as pd

# intialise data of lists.
data = {'x': [1, 23, 14, 12],
        'y': [20, 21, 19, 18]}

# Create DataFrame
df = pd.DataFrame(data)

# Print the output.
print(df)``` x y
0 1 20
1 23 21
2 14 19
3 12 18```Imagine that I have a column x and y, I want to generate a new column z based on the formula x+y
but really in my case it's not just x+y but rather a more complicated function
any ideas @lapis sequoia
fallen anchor
how good of a solution is this?
import pandas as pd

# intialise data of lists.
data = {'x': [1, 23, 14, 12],
        'y': [20, 21, 19, 18]}

# Create DataFrame
df = pd.DataFrame(data)

# Print the output.
print(df)
print('length of the dataframe', len(df))

df['z'] = None  # add the new column

# generate the z value for each row
for row_index in range(len(df)):
    df['z'].iat[row_index] = df['x'].iat[row_index] + df['y'].iat[row_index]


print(df)``` x y
0 1 20
1 23 21
2 14 19
3 12 18
length of the dataframe 4
x y z
0 1 20 21
1 23 21 44
2 14 19 33
3 12 18 30```if you're doing a complex funciton over rows, do .apply instead
you might need to specify the axis
that said, if you could let us know what kind of computation is being done
there might be a faster vectorized way
 icy spade
jupyter peeps?
acoustic mural
sup
icy spade
could I use a globally installed jupyter to load from pipenv? or do I really need to install it in every pipenv I have
acoustic mural
i think it needs to be installed in each
but you just use one frontend and select the venv on the top right
or in Kernel > Select
icy spade
Oh well, I installed it in the pipenv and I'm getting The loading screen is taking a long time. Would you like to clear the workspace or keep waiting?
🤔
acoustic mural
never seen that one lol
acoustic mural
do you have this complex function defined as a function?
acoustic mural
"Imagine that I have a column x and y, I want to generate a new column z based on the formula x+y
but really in my case it's not just x+y but rather a more complicated function"
i'm asking if it's ultimately a single function you want to apply to each row of the frame
fallen anchor
yes, one function
setting the value of multiple columns
the value of one column will be used to generate the values of 6 other columns
 sullen wing
You can do simple math with columns directly, think of vectorizing
An example looks like this
import pandas as pd

df = pd.DataFrame(
    {'x': [1, 23, 14],
     'y': [20, 21, 19]}
)

print(df)

df['z'] = df['x'] * 2 + df['y'] * 3

print(df)
    x   y
0   1  20
1  23  21
2  14  19
    x   y    z
0   1  20   62
1  23  21  109
2 14 19 85```it's not simple math
sullen wing
You can of course do much more complicated math
fallen anchor
Let me show you
icy spade
Can I install a pipenv package without updating the pip files?
sullen wing
By vectorizing functions
acoustic mural
ok so assuming you imported numpy as np:
change
def my_func(x):
to
@np.vectorize
def my_func(x):
then
acoustic mural
ok but pandas includes numpy
acoustic mural
so assuming you imported pandas as pd...
@pd.np.vectorize
def f(x):
    ...
Here's an example like this
 haughty mirage
Mmmm vectorizing functions
acoustic mural
might work
haughty mirage
How fun
sullen wing
import math

import numpy as np
import pandas as pd

def compute(x, y):
    return math.log(x) ** y

df = pd.DataFrame(
    {'x': [1, 23, 14],
     'y': [20, 21, 19]}
)
print(df)
compute_vectorize = np.vectorize(compute)

df['z'] = compute_vectorize(df['x'], df['y'])

print(df)```this is the function I am calling an a certain column of every row
sullen wing
    x   y
0   1  20
1  23  21
2  14  19
    x   y             z
0   1  20  0.000000e+00
1  23  21  2.645002e+10
2 14 19 1.017484e+08```You just need to vectorize the function
fallen anchor
    return {
        'wx_intensity': wx_intensity,
        'vicinity_or_not': vicinity_or_not,
        'description': description,
        'precipitation': precipitation,
        'obscuration': obscuration,
        'other': other,
        'rotation': rotation
}```each one of these will be a column
Right now it is set up for json
but I want it in my pandas dataframe
acoustic mural
ok did you read the stuff we said about vectorizing your function
fallen anchor
yes
acoustic mural
try that
fallen anchor
and it does not apply
fallen anchor
yes
acoustic mural
vectorizing is just syntactic sugar for that minus loops
acoustic mural
sure are
sullen wing
it is a way to apply a function in a vectorized way
which is very very fast comparing to looping through each row
the idea is that, you imagine your columns as vector
Then you create a function that accepts x, y, z ... each as a value in a row from each columns
You apply some math to it
Then you want to call that function to every row? Perfect candidate for np.vectorize
fallen anchor
You apply some math to it
what if I don't do any math
just regex, and some if/else stuff
fallen anchor
but do I still benefit from vectorize if I do it like that?
sullen wing
As long as you are running the function on a row basis
And applying it onto values in each row
import re

import numpy as np
import pandas as pd

def compute(x, y):
    return ''.join(re.findall(r"\d+", y)) + x * 5

df = pd.DataFrame(
    {'x': ['a', 'b', 'c'],
     'y': ['1', '2', '3']}
)
print(df)
compute_vectorize = np.vectorize(compute)

df['z'] = compute_vectorize(df['x'], df['y'])

print(df)```This is finding all digits in column y
then concat with the string in x, 5 times
   x  y
0  a  1
1  b  2
2  c  3
   x  y       z
0  a  1  1aaaaa
1  b  2  2bbbbb
2 c 3 3ccccc```intereseting
let me see if I can make that work in my code
so with you compute onle returns one thing
the output of my function needs to be saved into multiple columns
not the same data for eeach columns either
sullen wing
Oh no
You can do multiple
import re

import numpy as np
import pandas as pd

def compute(x, y):
    return ''.join(re.findall(r"\d+", y)) * 5, x * 5

df = pd.DataFrame(
    {'x': ['a', 'b', 'c'],
     'y': ['1', '2', '3']}
)
print(df)
compute_vectorize = np.vectorize(compute)

df['z'], df['t'] = compute_vectorize(df['x'], df['y'])

print(df)``` x y
0 a 1
1 b 2
2 c 3
x y z t
0 a 1 11111 aaaaa
1 b 2 22222 bbbbb
2 c 3 33333 ccccc```Be creative my friend
fallen anchor
hmm
I don't think it's gonna be that simple for me
I return a dict
although I suppose I can also change it to allow for a tuple to be returned
silent swan
is there a performance benefit from np.vectorize in that case?
sullen wing
It should still be faster
Specially when you compile the regex
I can do a quick benchmark, gimme a minute or two
fallen anchor
compute_vectorize = np.vectorize(compute) this has gotta take up so much memory
But I guess that;s why its faster than looping
sullen wing
It wont actually
Here's the code used to benchmark
import re
import timeit
from functools import partial

import numpy as np
import pandas as pd

regex = re.compile(r"\d+")

def compute(x, y):
    return ''.join(regex.findall(y)) * 5, x * 5

df = pd.DataFrame(
    {'x': ['a', 'b', 'c'],
     'y': ['1', '2', '3']}
)

compute_vectorize = np.vectorize(compute)

regex = re.compile(r'\d+')

def test1():
    """vectorize"""
    df['z'], df['t'] = compute_vectorize(df['x'], df['y'])

def test2():
    """loop"""
    df['z'] = None
    df['t'] = None
    for _, row in df.iterrows():
        row['z'], row['t'] = compute(row['x'], row['y'])

tests = (test2, test1, )
length = max(map(len, (t.__doc__ for t in tests)))

run_times = tuple(timeit.Timer(partial(test)).timeit(1000) for test in tests)

fastest = min(run_times)
print('\n'.join(
    f"{test.__doc__:<{length}} -> {run_time:.3f}s - "
    f"{'Fastest!' if run_time == fastest else f'x{run_time / fastest:.2f}'}"
    for test, run_time in zip(tests, run_times)
))
This is the result in my computer
loop      -> 0.573s - x1.68
vectorize -> 0.341s - Fastest!```The problem with looping is that you have to initialize those columns
fallen anchor
I'm doing it right now
It's proably going to take a minute
I think there are 600k row
I get an error
Traceback (most recent call last):
  File "/home/julius/Documents/projects/taf-verification/tmp.py", line 19, in <module>
    df['wx_intensity'], df['vicinity_or_not'], df['description'], df['precipitation'], df['obscuration'], df['other'], df['rotation'], df['precip_liquid_or_solid'] = get_weather_vectorized(df['metar'])
ValueError: too many values to unpack (expected 8)
this is in my code to add the columns
df['wx_intensity'], df['vicinity_or_not'], df['description'], df['precipitation'], df['obscuration'], df['other'], df['rotation'], df['precip_liquid_or_solid'] = get_weather_vectorized(df['metar'])
sullen wing
Too many error to unpack
Your get_weather function isnt returning a tuple of 8 values, it is returning more than that
fallen anchor
yeah it was returning the dict version
I set return_type to 'tuple' in the function call
should work now
sullen wing
Also you can do this for readability
(df['wx_intensity'], df['vicinity_or_not'], df['description'],
 df['precipitation'], df['obscuration'], df['other'],
df['rotation'], df['precip_liquid_or_solid']) = get_weather_vectorized(df['metar'])```Looks the same to me?
fallen anchor
oh, will do
me lines are getting too long wiht these var names
well I didn't get any errors
still trying to figure out if it actually worked
acoustic mural
holy cow Shirayuki i added a test to your example for apply, and vectorize is just shy of 5x faster
fallen anchor
It worked!
sullen wing
Yes!
fallen anchor
not even that slow
sullen wing
I wish, I'm learning everyday lol
fallen anchor
That was easier than I thought it would be
my regex is so bad
so many calls
I wonder what it would be like without compile
sullen wing
It's just how regex is, specially if your regex is super complicated
without compiling you gonna see re trying to compile it everytime
I did a benchmark on it iirc
acoustic mural
is that still the case? i thought compile just guaranteed only one compile
fallen anchor
shira tested it
fallen anchor
it is faster to compile up front
sullen wing
Make sure you compile outside of function however
fallen anchor
I did
acoustic mural
maybe jupyter does some tricks because my tests at work showed no difference
fallen anchor
I got a regexes.py
acoustic mural
i increased the lengths of your sample strings by 1000x, and matched my findings at work
unless there's also some string trickery caused by me declaring it with cases = ('a1b2'*1000, 'abc123def456'*1000)
sullen wing
Aha! I guess jupyter does some iternal compile then
acoustic mural
i'm not sure because i definitely got your results with the initial strings, twice as fast on the short ones
in jupyter
sullen wing
Lol
acoustic mural
major 🤔
sullen wing
I guess coz the time spent to compile cant compare to the time used to search on that giant string
So the time looks similar
acoustic mural
that's a good point
sullen wing
compile takes 0.5s, non compile takes 1s
search takes 5000s
so result looks similar
In any case I just go with compile most of the time
acoustic mural
yeah i precompile just to be safe wait what
cases = ('a1b2'*250, 'abc123def456'*250)

regex = re.compile(r'\w\d+\w\d+')
i think Shirayuki nailed it with the runtime of the regex eclipsing the compile time for complicated searches
but i'm curious about my latest results
acoustic mural
oh my god why
acoustic mural
how did you write that
how did you test it
i can't begin to imagine
i think i found a bread crumb, Shirayuki:
regex = re.compile(r'\w\d+\w\d+') consistently outperforms without precompiling, but
regex = re.compile(r'\w\d\w\d+') consistently outperforms when precompiled
sullen wing
that's very interesting
lol
first case, compile faster, 1.6
2nd case, compile faster, 2.2
for me
acoustic mural
wtf
sullen wing
Pattern -> \w\d\w\d+
compile  -> ['a1b2']
straight -> ['a1b2']
compile  -> ['c123', 'f456']
straight -> ['c123', 'f456']
compile  -> 0.013s - Fastest!
straight -> 0.028s - x2.13```Pattern -> \w\d+\w\d+
compile -> ['a1b2']
straight -> ['a1b2']
compile -> ['c123', 'f456']
straight -> ['c123', 'f456']
compile -> 0.015s - Fastest!
straight -> 0.025s - x1.71```Hahaha
Rip
acoustic mural
for larger search spaces/more complex patterns though it definitely doesn't seem to make a big difference
which is disappointing, i could use some magic performance gains
fallen anchor
@acoustic mural I write regex in the online debugger, visualizing helps a ton
@sullen wing is there anyway when adding the z column to skip it if the row already has a value true in a is_processed column?
This csv will grow over time
I don't want to compute the z column for all other column every time I add 30 new lines
sullen wing
sure, pass the value of z in, and skip if another column is something
fallen anchor
ok, I see
maybe I should do it propery
and get z for the new lines before concating to the old one
I'll try that
sullen wing
So like this
df['z'] = None
df['z'], df['t'] = compute_vectorize(df['x'], df['y'], df['z'])```def compute(x, y, z):
return (
z if x == 'b' else ''.join(regex.findall(y)) * 5,
x * 5
)```ok I will try that
stuff is getting hard to read
not yours, just mine
weird how numpy was able to work with a pandasdf out of the box
It's like they are one library
acoustic mural
pandas is built on top of numpy
lapis sequoia
you don't need to do df['z'] = None
lapis sequoia
no.. I'm pretty sure it gets created when you declare with the expression
fallen anchor
so if he passes the non-exsitant z column to vectorize it will throw an error
lapis sequoia
hmm I'll have to check.. I've never had that before
fallen anchor
but what is it supposed to equal if not none?
acoustic mural
except that the question was how to skip is df['z'] has a value in the row
lapis sequoia
come again?
acoustic mural
in this scenario, df['z'] could have a value and in that case it shouldn't be recomputed
lapis sequoia
you mean it already existed?
acoustic mural
that was the premise of the question
icy spade
Is there a way to expand the contents of these classes in jupyter notebooks?
acoustic mural
if it's a custom class, implementing __repr__ i think
icy spade
🤔 I was hoping for a way to just expand the stuff like when debugging with VS Code
devout ridge
it's better to implement __repr__ or __str__, but if you want a one-off way to get the attributes of an instance of a class, you can look at obj.__dict__
sullen wing
Yes @lapis sequoia in my original df i dont have 'z' column, and i pass the value of z column into the function as well so it'll raise error
If the df has z column already it is not needed
fallen anchor
but does it work with the np vectorized call?
sullen wing
Ah, because you are not passing d['z'] in
try
some_df['z'] = (some_df['x'] + some_df['y'] + some_df['z'])```Even if you defined df['z'] = None that would still fail
lapis sequoia
oh.. I just saw the function use df['z'] lol
silent swan
so the other thing is that pandas has build in str functionality that should be faster than using apply
if you can get your problem to fit into the mold
fallen anchor
I still need to learn pandas
keep getting this error sys:1: DtypeWarning: Columns (2,3,4,5,6,8,9,10,27) have mixed types. Specify dtype option on import or set low_memory=False.
some columns should be all ints
but sometimes data is missing
so I have to leave it as is, which is probably slowing it down
lapis sequoia
use floats?
fallen anchor
I can't
some of the data is just 'M'
M for missing. I can't convert that to a floar
lapis sequoia
so change the missing data to NaN
fallen anchor
hmm
then other stuff won't work
but I guess that would be the ideal solution
@lapis sequoia do I do .fillna(None) or fillna('nan')
lapis sequoia
nan is a string I think
missing values should already show up as NaN
how did you fill them with 'M'
maybe just do a replace, if you weren't the one who did that and it was in place in the data already
df.replace('M', np.NaN)
 pale pasture
hope someone can help me out here. I am just getting into pandas and want to understand what I am doing wrong
I currently have a pivoted dataframe, that is using acitvity date and activity as its index. I can for the life of me figure out how to select out for instance dates that aren't null for specific columns
lapis sequoia
Can you phrase your question better.. don't understand much of what you said there
you want to show activity dates for activities that aren't NaN?
pale pasture
@lapis sequoia sorry I took this out to #help-falafel but yes the idea is I want to select the column biking, running, or walking, and then filter results which aren't null
 dusk falcon
I dont know if this belongs in this channel, but i'm looking to get into some image classification and would appreciate recommended education material!
 steep stump
Good evening. I have a 2dimension numpy array with a bunch of 0 and 255, is there an easy way to get the average index of the elements different than 0?
lapis sequoia
can you rephrase your question
you want index values of anything greater than 0 on the same numpy array?
what do you mean average index
@steep stump
@dusk falcon depends on the application.. you can't just say image classification and be like.. whoosh..
dusk falcon
Yeah I recognize that, I'm at that stage where I don't know what I don't know
lapis sequoia
ok then.. you can start with CNNs.. I have just the video for that

Link to UCI Machine Learning Repository (where I got the dataset) - https://archive.ics.uci.edu/ml/datasets/Breast+Cancer+Wisconsin+(Diagnostic) Link to ...

Code: https://github.com/antaloaalonso/CNN-With-GUI In this video, I use convolutional neural networks--written in Python with the help of Tensorflow and Ker...
these two should help you get started
dusk falcon
Also I think my context is pretty easy, the images are a very well defined set of opaque flat color effectively symbols and there's only like 280 options
lapis sequoia
understand the layers in CNN, move on to other NN's that can be used for image classification..
dusk falcon
I thought maybe I could conquer this with just OpenCV and image magik tricks but the images have a lot of compression artifacts it gets weird. Plus I want to learn for other things
Hey thanks for the videos! Will watch
steep stump
Ok so, I want to get all indexes from elements that arent diferent of 0, to divide and get an average point between all indexes
not sure Im making myself clear here
lapis sequoia
ok.. so you actually want the average of the indices..
steep stump
Correct
acoustic mural
mind if i ask why? i can't think of an application for that
lapis sequoia
np.argwhere(your_array> 0)
I was thinking the same thing
argwhere returns indices and you can use boolean conditions with it
acoustic mural
oh that's convenient
steep stump
Yeah Im using that still having a bit of trouble to use the output
I'll keep trying and get back here
acoustic mural
lapis sequoia
what exactly is your expected result
your input was a 2d array.. it returns indices as 2d arrays
show me the output
acoustic mural
@lapis sequoia notes from the argwhere docstring, FYI:
Notes
-----
``np.argwhere(a)`` is the same as ``np.transpose(np.nonzero(a))``.

The output of ``argwhere`` is not suitable for indexing arrays.
For this purpose use ``nonzero(a)`` instead.
let's check input and output.. and try np.where as well
steep stump
yeah I was trying both
acoustic mural
ughhhh i HATE np.where because i can never remember how it works when i read it again later
steep stump
Im expecting to get the average position of all positions
upper ginkgo
Hello! Is there any good intent classification neural networks out there I can take a look at?
lapis sequoia
you mean like for Q&A?
lapis sequoia
anyone knows any good tutorials for web scraping?
 muted niche
seach youtube for selenium, Sentdex has some scraping tutorials using PyQT5,
there are plenty of tutorials using the requests lib too
I basically lerned from youtube
Use Selenium/requests/PyQT to get the html. Then parse it using BeautifulSoup 4. Also install lxml and use it with BeautifulSoup, I hear it is the fastest option for parsing
Python Programming tutorials from beginner to advanced on a massive variety of topics. All video and text tutorials are free.
lapis sequoia
programming with mosh is also good,or some coding bootcamps like freecodecamp or codecademy..
 pale thunder
in matplotlib, is it possible to have a subplot be e.g. 8/9 of the figure. I want to have a thinner one underneath - slider
 supple ferry
I have two datasets, A and B. I want to create a new column in A in which I will look up some values of A in B and assign the result to it. I have this function written, but it is not working as I intended:
from functools import partial


def retrieve_cluster_prob(row, searchdf):
    individual = row["individual"]
    cluster = row["cluster"]

    probability = searchdf.query("individual == @individual & cluster == @cluster")["prediction"]

    return probability

apply_function = partial(retrieve_cluster_prob, searchdf = r)

result_df["cluster_choice_prob"] = result_df.apply(apply_function, axis = 1)
How I can make it work ?
 paper niche
@supple ferry why not just merge the two dfs?
supple ferry
@paper niche memory incompatibility :)
paper niche
what does that mean? as in, the two dfs are too large?
lapis sequoia
use dask
 barren bluff
Hey im having an issue understanding gridsearch im ML. Where in the world can I find a list of the tuning paramters I can use in the grid search and how do I decide on values?
or I think I mean more like, how do you decide what is a normal parameter and what is a hyperparamter(and how to decide the values for each)?
lapis sequoia
Hyperparameters are your prior belief.. it has nothing to do with a 'normal' parameter.. which is not a thing..
barren bluff
normal parameters not a thing? what
lapis sequoia
you start with your prior belief.. run your iterations.. in gridsearch or random search, then arrive at optimized values for your hyperparameters that maximize your model's utility..
barren bluff
not sure I understand
lapis sequoia
your parameters are what you arrive at during model training.. do you understand that?
then you tune them
kindred flame
guys
just started with ml but rn its rly dry
Does it get better or is ml just not my branche
lapis sequoia
depends why you started
ml in itself doesn't have direction.. you either need to focus on industry for application or research..
silent swan
machine learning is whatever you want it to be
like didn't search algorithms used to be considered "ai"
silent swan
like a star search used to be considered AI
 plain turret
I keep see people bringing this up, to the point of most data science meetup i went too, speakers waste 5 min mentioning about AI, but i don't think anyone is asking what AI is or is not. It's interesting if you do history of science but erh.
Now, is linear regression Machine Learning hmm hmm 
lapis sequoia
well..
regression is more statistics..
but it can be applied through ml methods.. but i'm not sure if that makes it ml
let's just call all applied stats ml:p makes things easier
plain turret
Eheh
polar acorn
It literally is though. If a machine learning from data is not machine learning then I don't know what is. And yes there is a large overlap between statistics and machine learning. ml ≠ stuff that use gradient descent. However linear regression is often used differently and for different purposes within stats and ml.
 past wren
could anyone help me with importing a json dataset with pandas in python. First two values of the dataset are given below as a reference of the format: {"is_sarcastic": 1, "headline": "thirtysomething scientists unveil doomsday clock of hair loss", "article_link": "https://www.theonion.com/thirtysomething-scientists-unveil-doomsday-clock-of-hai-1819586205"}
{"is_sarcastic": 0, "headline": "dem rep. totally nails why congress is falling short on gender, racial equality", "article_link": "https://www.huffingtonpost.com/entry/donna-edwards-inequality_us_57455f7fe4b055bb1170b207"}
if i try to used pandas.read_json(r'file_location') i get multiple errors
silent swan
is it json or jsonl
 quartz monolith
Has somebody worked with azure Ml and blobs?
 noble merlin
Anyone use the shapiro.test function on r before?
 cursive flax
@quartz monolith @noble merlin A lot of people have / do
acoustic mural
anybody here tried out modin.pandas?
experience on Windows a plus 😄
(i'm not asking to ask, that's my actual question i want to know if anyone has used it)
i can't tell if it's too good to be true, or if it's legit if it's production ready
deft harbor
I have not
 brittle lily
anyone here know a good resource for learning keras w tensor flow backend?
 solid bone
How do we apply model.predict(...) inside Flask?
, line 45, in __getattribute__
    return object.__getattribute__(self, attr)
AttributeError: 'local' object has no attribute 'value'

-->
ok... it looks like it is not fixed: https://github.com/keras-team/keras/issues/13353
 jagged stump
Hey everyone I wanna be data scientist but I have no experience about it and I got an offer about data engineer . So its my question its easy move to data science from data engineering?
lapis sequoia
no
and you shouldn't..
they're completely different fields.. and you should pick one that suits your career goals
@jagged stump
polar acorn
That seems a bit harsh. If your choice is having no job or having a DE job, I think the DE job brings you closer to DS than having no job. Many DE skills are useful for DS also. Though I guess transitioning from DS to DE is more common than the other way around.
Probably depends very much on the job details though.
lapis sequoia
well I didn't say he shouldn't take the DE job lol..
I meant not take it with the idea you'll shift to DS.. that's not a good start.. the goal should be picking up the skills to be the best DE your role needs.. and then figuring out if DS is something you want to look into..
DS is very industry specific.. meaning it needs a lot of industry knowledge to break into.. but most people think it's all ML.. that's not the case
slim fox
well but you should get that industy specific knowledge somewhere. Not an easy thing without no job I think 🙂 At least I get few rejections motivated "you lack experience but your skills are fine tho"
quartz monolith
just be a DE und DS 🙂
 umbral pier
I wanna predict chemical chain reaction , there are algorithms for it but I'm stuck in implementing it , I've checked on modules for it like Chempy ... but I cannot get something specific on this one
Is there a way ?
quartz monolith
For a short time free
https://pytorch.org/deep-learning-with-pytorch
Deep Learning with PyTorch provides a detailed, hands-on introduction to building and training neural networks with PyTorch, a popular open source machine learning framework. This book includes:
Introduction to deep learning and the PyTorch library
Pre-trained networks
Tensors
The mechanics of learning
Using a neural network to fit data
Get a free copy for a limited time.

An open source deep learning platform that provides a seamless path from research prototyping to production deployment.
 bitter ivy
Hello, has anyone used Python library tsfresh? I would like to know what is here the second column: https://paste.ubuntu.com/p/wnhNWFYtry/ ? And what are these warnings? Thanks for the help.
fallen anchor
hello
I have a dataset like this
about 600k rows
How can I compare the 300 rows and see where in the previous 600k this pattern has already been seen
Not sure if this will end up being more DS or ML
 native rivet
can someone help me please?
Traceback (most recent call last):
  File "/usr/local/lib/python3.7/site-packages/matplotlib/image.py", line 1412, in imread
    from PIL import Image
ModuleNotFoundError: No module named 'PIL'

During handling of the above exception, another exception occurred:

Traceback (most recent call last):
  File "./color_sel.py", line 8, in <module>
    image = mpimg.imread('test.jpg')
  File "/usr/local/lib/python3.7/site-packages/matplotlib/image.py", line 1416, in imread
    'more images' % list(handlers))
ValueError: Only know how to handle extensions: ['png']; with Pillow installed matplotlib can handle more images
i already have pillow install
 north river
Where's the proper place to ask questions about matplotlib?
fallen anchor
install the PIL module
quartz monolith
What kind of model fits to measure user satisfaction search results and what logs / data do i need for that? Any ideas, links or exp.?
polar acorn
@bitter ivy Here is the documentation for that feature. https://tsfresh.readthedocs.io/en/latest/api/tsfresh.feature_extraction.html#tsfresh.feature_extraction.feature_calculators.change_quantiles. As you can see the first part of the name says what function is used to find that feature, and the rest of the name gives the parameters passed to that function.
acoustic mural
bringing it back up, has anyone used modin and able to speak to whether or not it it's good and stable?
saw it in pycoder's weekly this week and it looks promising but also too good to be true
lapis sequoia
it's okay..
lapis sequoia
i want to make a machine learning model which can solve simple Algebraic Questions Ex:2x + 3 = 2x +3 Any ideas how on to approach such tasks?
 signal siren
hey I would like to setup a remote mlflow server (https://mlflow.org/) on a machine in my local network so that the other machines can log the parameters, metrics and artifacts to it. The only problem with it right now is the artifact storage which does not work the way I think it works.
The setup on the machine which hosts the mlflow service:
mlflow server --host 0.0.0.0 --port 9999 --default-artifact-root sftp://user@machine:~/artifacts
And to test this I took the example code on their github page and tweaked it a little bit so that it uses the remote mlflow server.
from mlflow import log_metric, log_param, log_artifact, set_tracking_uri

if __name__ == "__main__":
    remote_server_uri = 'machine.this.network:9999' # this is done by a local DNS
    set_tracking_uri(remote_server_uri)
    # Log a parameter (key-value pair)
    log_param("param1", 5)

    # Log a metric; metrics can be updated throughout the run
    log_metric("foo", 1)
    log_metric("foo", 2)
    log_metric("foo", 3)

    # Log an artifact (output file)
    with open("output.txt", "w") as f:
        f.write("Hello world!")
    log_artifact("output.txt")
What happens: The parameter and metrics get actually transfered. But the artifact - in this case the file with "hello world" - not.
The documentation says the following about this:
- I should be able to log in via sftp on the server without a passwort: I can log in via sftp without a password.
- And the package
pysftphas to be installed on both sides. It is installed on both sides (client and server)
Currently there is no properly working blog post about this and the example on a remote server in their github repository does not explain the settings on the mlflow server (https://github.com/mlflow/mlflow/blob/master/examples/remote_store/remote_server.py)
Does anybody know hot to setup this tool?
Thanks in advance
edited grammar/spelling
polar acorn
@signal siren Don't know about that problem specifically, but I think there was a start up somewhere that provided hosted MLflow and artifact storage with a free tier. Here's a link https://www.mflux.ai/
 chilly geyser
Has anyone tried doing predictions with BERT or Keras-Bert?
I'm actually using R (because poor reasons, but still reasons), and my trained-model is very slow when trying to predict anything
chilly geyser
Well, my BERT finished training and predicting, training took ~1 hr, and prediction for training/test sets (very similar accuracies in both sets) took ~ 25min overall
I'll check in later if anyone has any good ideas as to how to speed things up, but while the accuracy is reaaaaaally reallllly good I'll stick with XGBoost as the benchmark for now
lapis sequoia
what are you training with BERT
mention your use case instead of just the framework.. it makes it easier to suggest
fallen anchor
What is a a good reference website?
For example if I want to know more on polynomial regression
wikipedia is very lengthy
lapis sequoia
well wikipedia isn't reliable...first of all lol
silent swan
are you using GPUs for BERT? I've worked extensively with it
fallen anchor
@lapis sequoia Well, you got something better?
lapis sequoia
kaggle for one
fallen anchor
kaggle doesn't have much of a dictionary/lexicon though
chilly geyser
I was using the Google Colab with IRKernel for R Keras/BERT, with TPUs I think
use case
It's multi-label classification, 3 categories (a,b,c)
lapis sequoia
that's not very descriptive.. what are the labels.. what is the data
chilly geyser
😐 I rather say as little, but ok, the data are tweets and they carry sentiment
My labels are negative, neutral or positive
TBH I'm not really going to go deep into it, but I'm benchmarking it versus other methods.
I'm looking at ALBERT now, since BERT was promising
lapis sequoia
you're focusing on models instead of the application..
but if benchmarking is your goal.. then ok
for sentiment classification any representation that captures the sentiment is adequate.. it doesn't need to be as heavy as BERT
chilly geyser
I'm seeing results that smash typical random forest basically
lapis sequoia
because RF is very basic.. and wasn't built specifically for text classification.. that's a given
 distant inlet
Just starting with data science
Udemy course
It has numpy + pandas + matplotlib + seaborn .
I'm every new to this dtuff
Stuff
And then it will teach ML.
Data visualization excites me..I could make a visualization of my daily expenses (personal project)
I'm not sure about ML ..they say it's super tough and you need to be good at Math .. sounds very geeky ..
Can ya'll guide me ..
It will be appreciated.
lapis sequoia
if you like data visualization.. you should stick with it
there's aspects of industry where that is useful..with the right business background..
marketing, sales.. to name a few
applied ML gets more complex depending on industry again.. and yes you need to be good at math, and have industry experience to be able to apply it anywhere
there are people making a living being good at just one thing, like Tableau, Qlikview or powerBI.. all just visualization..
if you can get your way around those.. you're set for the next 8 years or so.. plenty of time to pivot
distant inlet
👌 👌 👌
Thank you!
@lapis sequoia
After data visualization with python..I should check out Tableau ,Qlikview?
Fun fact .. I used to do business development sales for Tableau..
It was analytics software
lapis sequoia
then there you go.. you might've just found your niche
chilly geyser
Does anyone know how to make ALBERT work on Google Colab
I can't even properly tokenize
The TF Hub module doesn't seem to work very well
Ok I think I'm giving up on ALBERT until people come up with less problematic tools, since I'm failing so hard at the tokenization
FWIW this is what I get
tokenizer.tokenize("An example of ALBERT tokenizer")
['▁', 'A', 'n', '▁example', '▁of', '▁', 'ALBERT', '▁to', 'ken', 'izer']
(at least BERT seems to work)
lapis sequoia
you can use a different tokenizer
that's kinda the point.. you have to shape your input for your goal..
either restricting input to text only and remove symbols, emoticons.. or represent emoticons differently so you capture those signals too
that's vectorization
chilly geyser
Um well, I was expecting that if ALBERT comes along with its own tokenizer, that it works. Unless the '_' parts are considered working (I don't think...so?)
distant inlet
@lapis sequoia thank you!
deft harbor
When using keras for binary prediction, is there something I should be doing so that the model predicts either a 1 or a 0?
I understand the output, I'm just curious if there is a way to force it to one or zero, or if I need to process the numpy array afterward with typical python code.
silent swan
that likely is how the ALBERT tokenizer works
each of the BERT-class tokenizers do something funky with the tokens
BERT uses ## to indicate a partial word
RoBERTa uses ends up prepending something that looks like Ģ to the start of every word
I recommend working with RoBERTa for now, it's quite a bit better than BERT but has almost 100% the exact same setup
(on second thought I am suspicious of the ALBERT tokenizer because "An" should certainly be in one token)
which albert version are you using
 limpid pilot
@silent swan, this tokenization... Is this for replacing a sensitive database value with a neutral value? I.e., replacing SSN with an index id?
silent swan
no it's just for converting text to tokens
arctic wedgeBOT
ask
Asking good questions will yield a much higher chance of a quick response:
• Don't ask to ask your question, just go ahead and tell us your problem.
• Try to solve the problem on your own first, we're not going to write code for you.
• Show us the code you've tried and any errors or unexpected results it's giving.
• Keep your patience while we're helping you.
You can find a much more detailed explanation on our website.
 agile wing
ok, thanks.
so
im working on databricks, and i've noticed that when I'm querying through the blob storage, there is no returned results
upon querying i wrote:
select Schedule_Procedure_Code, Procedure_Category from clmdt where Schedule_Procedure_Code IN (99495,99496)
and the results just say"OK" and not the returned results
i know in ssms, it works but not through azure databricks
anyone knows why?
lapis sequoia
I think the query results are empty
can you just select without condition
see what it returns
agile wing
yes, without the filters it does display itneresting.
lapis sequoia
there you go.. empty selection
agile wing
darn, thats weird, in regular database using regular sql using SSMS, results shows tho.
I'm now suspecting my company did not migrate all the Schedule_Procedure_Code values....
to blob storage...
no that might not be right either... because Im doing select Schedule_Procedure_Code from clmdt where Schedule_Procedure_Code = '98943' and 98943 value exist in the blob storage
still says 'OK'
its so wonky
does Databricks use only spark sql?
lapis sequoia
afaik yes
agile wing
hmm
lapis sequoia
do the select without the condition.. see the values that show and use them in another query including the condition for those
that way you can check
maybe your query is structured wrong
agile wing
so even if I magic command %sql, it's not original sql...im assuming?
yeah thats what Im assuming, i may have to restructure the query to accomodate the style of spark sql instead...
im so new to databricks. It's the wonkiest thing. Our company uses the blob storage to access the data... so using python we create the usual access and key to open the blob storage vault..
then use sql to grab the data after registering to temp table
and then i can use R or python to do... whatever I need to do
....is this method .... like .... is that normal? PySpark (open up blob storage and register to temp table) -> SQL or scala (to grab whatever table(s)) -> R or Python for data analysis/manipulation
lapis sequoia
you can do whatever on the analysis part
but streamlining the flow is something you should be concerned about
for instance, you want to do analysis, you should ideally have some functions that pass SQL queries and give you the data you need..
I would suggest kafka or something to give you the stream or materialized view depending on your analysis needs
lapis sequoia
hey np..
watch the Tron movie
kafka is a streaming platform.. can be used for pub/sub as a message broker
agile wing
is.... kafka integrated with Azure?
waitaminute...
is databricks sql, ansi 2003 standard only
?
lapis sequoia
yes kafka is available on azure..
you should check which version of spark you're running
fallen anchor
from random import random
import matplotlib.pyplot as plt

data = [random() for i in range(10000000)]  # a list of a million random float (0.0 to 1.0)
match = data[-30:]  # the last 300 float in the list. I want to find the closest duplicate of this list in the
# data = data[:-30]  # everything but the last 300 items
data_without_match = data[:-30]

best_match_start_index = 0  # where we keep track of the index at which the so far best match has been found
lowest_error_so_far = 10000000  # set to some stupid high value so it will replaced
for index, value in enumerate(data_without_match[:-30]):  # this list is about 1mil long minus the 30 for the reference match
    error_this_index = 0  # the lower the better
    for index_match, value_match in enumerate(match):  # this list is 300 long
        error_this_index += (data[index+index_match] - value_match) ** 2  # add the sqaured difference to the error_this_index
    if error_this_index < lowest_error_so_far:  # if the error from the last loop is better than the one so far we found a better match
        best_match_start_index = index  # keep track of where the better match is


print('reference match: ', [f'{i:.2f}' for i in match], 'sum:', sum(match), 'avg (mean):', sum(match)/30)
best_match_list = data[best_match_start_index:best_match_start_index+30]
print('best_match_found:', [f'{i:.2f}' for i in best_match_list], 'sum:', sum(best_match_list), 'avg (mean):', sum(best_match_list)/30)

x_value_for_plot = [i for i in range(30)]
plt.plot(x_value_for_plot, match, label='actual')
plt.plot(x_value_for_plot, best_match_list, label='best_match_found')
plt.legend()
plt.show()```in my data with length of 10 mil why is my best mastch so bad?
lapis sequoia
there you go
devout ridge
i think i told you this before, but i'd use RMS error
 storm scroll
does anyone have experience with data frames and dictionaries with python?
silent swan
yes. For a quicker response, just state your full question
fallen anchor
@devout ridge ah, I think I used just squared error
which didn't really work
doesn't the "root" in RMS undo the "sqaured" in RMS?
storm scroll
FYI anyone that's into forecasting or time series data should look into Prophet by Facebook
its a nice model developed by the data science team at Facebook, and its open source
silent swan
@fallen anchor why do you say the squared error doesn't work
root doesn't cancel out the square because you're taking the root of the sum of squares
storm scroll
For any DataFrame expert that wants a real test, I posted this problem Im running to on stack overflow (https://stackoverflow.com/questions/59025883/how-to-create-individual-data-frames-through-automation-instead-of-appending-on)
Stack Overflow
I have a program that forecasts individual stock data. It's very simple and straightforward. The user needs to select one stock and the range of data.
I'm ready to take it up to the next level by
chilly geyser
@silent swan Um I'm using the one on TF Hub, V2. I'll check out the RoBERTa
silent swan
can you link me to the one?
chilly geyser
This one: https://tfhub.dev/google/albert_base/2
silent swan
ah that's alberta-base
plain turret
@storm scroll why do you call all tickers and not just the symbol you want in your first line of your loop
stock_info = pdr.get_data_yahoo(tickers, start=start_date,end=end_date
storm scroll
Would you recommend another way to loop it ?
plain turret
If you replace with symbol wouldn't you get just the data you're interested into ?
storm scroll
Yes, then if we follow that coding logic, I think it doesn’t make sense for what I’m trying to build
I want to loop that, so I can just get as many data frames I want
plain turret
Yeah ?
Build a function to return 1 dataframe by the symbol
Then you loop on your ticker list and call it X time with each symbol as argument
plain turret
I think, however, it's better to have one big Dataframe with everything you want, and then select just the data you need with pandas, rather than building individual dataframes.
Don't exactly remember the syntax thou and i might be wrong
storm scroll
That’s also what I’m thinking , but I’m running the data through a model that needs to be 2 columns per stock.
At least for now
Def stocks (tickers): stock_info = pdr.get_data_yahoo(tickers, start=start_date,end=end_date)
Like that ?
plain turret
It's 1 ticker so ticker or symbol :p
And you need to return the stock info
If not it's just gonna build them and do nothing with it
supple ferry
Hey! I have a dataset with the following columns: id, clusterid, price, duration.
I wanted to find the rank based on price for every id and cluster id. For this I was using pd.groupby.rank to get this. This was my code:
sample["ictdc"] = (sample.groupby(["individual", "cluster"])
                          ["totalPrice"]
                          .rank(ascending = False, method = "dense")
                          .astype(int)
                          .sub(1)
                  )
What I want to do now, is to do the same think, but now compare every Price value with the prices which are not in that cluster for every id. How can I accomplish that?
chilly geyser
@supple ferry IDK enough pd to help
But do you really need PD
As in, if speed is not yet a factor, you should probably try to code out that logic using iteration through the pd
not in that cluster for every id.
This sounds like you might want to put a new column and try comparing against that, by the way
By the way, anyone know if BERT's epochs are all equal in terms of training time? I was doing single epoch BERT (which takes 1 hour), and I was wondering if more epochs would scale linearly, so 10 epochs would take 10 hours.
I could do it by checkpointing the epochs, but I'd rather not since I haven't coded it out yet
silent swan
are you talking about fine-tuning or training BERT from scratch
if fine-tuning the answer should be yes (even if not, the answer is still probably yes)
chilly geyser
Fine-tuning mostly, because BERT isn't trained with my task of 3-labels AFAIK, so I only train the pre-trained model on it. Currently my code also adds a few other layers (after), but they don't really seem to change it all that much
lapis sequoia
what do you mean afauk..
do you understand why pre-training is required? it's to shift embeddings to the domain you're working on..
 still abyss
Is there anyone here good with Pyspark?
lapis sequoia
!ask
arctic wedgeBOT
ask
Asking good questions will yield a much higher chance of a quick response:
• Don't ask to ask your question, just go ahead and tell us your problem.
• Try to solve the problem on your own first, we're not going to write code for you.
• Show us the code you've tried and any errors or unexpected results it's giving.
• Keep your patience while we're helping you.
You can find a much more detailed explanation on our website.
still abyss
All right... well I have a spark dataframe and some of the columns contain dictionaries because it came from a nested json. What is a good way to make the dictionaries their own columns?
lapis sequoia
like every field in neted json into a separate column?
still abyss
Yeah I want Buys to become buy price and buy quantity.
Same for sell.
Ultimately I'm going to to a spark stream to have the prices as they change over time.
lapis sequoia
you would have to declare the schema for the column and expand it in a new one
is it a lot of data
show code
there might be a better way to do this
still abyss
There's going to be 57,080 rows.
Or records or whatever.
json_rdd = sc.parallelize(json.loads(requests.get("https://api.guildwars2.com/v2/commerce/prices?ids=%s" % ids).text))
df2 = json_rdd.toDF()
lapis sequoia
why do you need pyspark for that
still abyss
Because it's a course in spark.
lapis sequoia
how are you going to stream
ahh okay
hmm
here you go
Stack Overflow
I'm trying to expand a DataFrame column with nested struct type (see below) to multiple columns. The Struct schema I'm working with looks something like {"foo": 3, "bar": {"baz": 2}}.
Ideally, I'd...
@still abyss
still abyss
Is there a way to like do "for col in df.columns()"?
With the schema?
Oh nevermind.
The next answer does it.
 unborn phoenix
Is this the place I would ask about general ML stuff?
Especially as it relates to frameworks like TensorFlow and PyTorch
acoustic mural
sup mushu
acoustic mural
why wasn't i able to install it after like 2 hours of trying
unborn phoenix
So I'm looking to build an RL game player that uses MCTS to play a go-like game and I'm trying to see which would be better for that.
Tensorflow looks quite robust but I have heard people say PyTorch is a better option (without much explanation.)
Is there a strong reason to use PyTorch for an application like this?
silent swan
if you're just starting deep learning, I wouldn't recommend touching RL at all
but if you are, just use whatever has the closest prewritten code to what you want to do
PyTorch is generally nicer to work with because it works like a Python library and doesn't try to take control over everything
TensorFlow is very much "my way or gtfo"
 olive prairie
Hey - dunno if my question really falls under data-science, but I am trying to visualize some data. Does anyone know much about bokeh?
unborn phoenix
Sadly I can't get any letters of recommendation for tic-tac-toe and I really need some. 😢
arctic wedgeBOT
ask
Asking good questions will yield a much higher chance of a quick response:
• Don't ask to ask your question, just go ahead and tell us your problem.
• Try to solve the problem on your own first, we're not going to write code for you.
• Show us the code you've tried and any errors or unexpected results it's giving.
• Keep your patience while we're helping you.
You can find a much more detailed explanation on our website.