#data-science-and-ml
1 messages · Page 209 of 1
 proud iris
proud iris
proud iris
should I pastebin my codes?
it's not exactly linear, I'm using relu and so far it has given me pretty good results when I'm considering 2 points for deflections
 desert oar
Yeah paste your training code, I'm curious how you're doing this
Training and evaluation
proud iris
what was that website again?
desert oar
!paste
 arctic wedgeBOT
Pasting large amounts of code
If your code is too long to fit in a codeblock in discord, you can paste your code here:
https://paste.pydis.com/
After pasting your code, save it by clicking the floppy disk icon in the top right, or by typing ctrl + S. After doing that, the URL should change. Copy the URL and post it here so others can see it.
proud iris
this one generates deflection data at 2 points, 0.2 and 0.7
this one trains the above dataset and returns predictions (quite accurate)
desert oar
Accurate on the test set?
proud iris
yeah
desert oar
OK, and the problem comes when you want to predict on a different beam?
proud iris
this one generates data for single point deflection, at the midpoint, for two equal K values
this one trains and predicts the above dataset. Results are quite bad.
desert oar
Yeah well, you optimize for one beam and now here's a completely different beam with different properties
proud iris
My question is, the dataset and the method of training are quite similar. So why am I getting such poor results on the second one?
Nah, same beam.
desert oar
But it's a different problem, the deflection point is in a different place
proud iris
yeah. And it has a separate training code too
desert oar
Yeah, so not only are you using an architecture tuned for one problem on a different problem, but you're not making use of any common information between the two
You could generate a whole bunch of different beams and deflection points
Stack the data all vertically
And include the deflection point as a feature
International statistical modeling you might get in some kind of hierarchical stuff here, but for your case a neural network can learn it. Since you're simulating the data you can generate as much of it as you need
proud iris
I am not following you. The beam, and all its data remains exactly the same. Previously I was calculating two deflection positions, using the same formulas, now I'm doing it for one. Previously I had two deflections and two stiffnesses as my features, now it's one deflection and two stiffnesses
desert oar
You're changing the deflection positions right
desert oar
But you're using the same model and the same model architecture?
proud iris
yeah. Isn't this a general keras model?
proud iris
meaning?
desert oar
Maybe you need a simpler architecture for one deflection
How is your neural network defined right now
What is the architecture
proud iris
3 hidden dense layers, sequential, 100 neurons each
relu on the first one, linear on the other two
proud iris
how does one decide no. of neurons/layers? Is there a rule of thumb?
proud iris
Also, after training, all my predicted values are coming same. Why is that?
ohhh wait i might have found the issue
 vestal pecan
today I met people who do data analysis through software like alteryx and such. So basically what i do to type codes and manage dataframes, they do it with one click. they don't even have to worries about making dummy variable for categorical data.
I was thinking of talking to the program organizer, that data analyst stream is not useful if they are not going to upscale data analyst trainees to machine learning
 strange knoll
In binary search trees are there alternate methods of removal other than through merging?
 lapis sequoia
I'm confused on when to use Euclidian distance or cosine similarity. I'm implementing my own knn to predict the sentiment of amazon reviews. So should I use cosine similarity because the reviews are of varying length or
desert oar
i'd go with cosine for that kind of thing
you're not trying to find out if they're the same vector, just if they point in the same direction
proud iris
okay this is very frustrating. I realised and corrected the issue, and now I'm getting around 98 percent accuracy for k1 = k2
However when I'm imposing k1 != k2, k1 output is around 98 percent accurate as opposed to 86 percent for k2.
k1 and k2 are independent of each other....what the heck is going on
 boreal mauve
Hey everyone. Im just starting to put some of my work to github. Is it in good practice to put files in jupyter notebook file format (.ipynb) there? I know that I can download then as .py and pushem them like that, but obviously all the markdown cells will be converted to comments as well overall structure of the file will not look so good. That is a lot of work if ill have to refine them to .py and I'm not sure is it worth it. The purpose of my github is to 'upgrade' my personal profile when I will be looking for a job. Thanks for any advice 🙂
desert oar
@boreal mauve .ipynb is fine
 worthy meadow
so my question is I've made a program which can manipulate the Philips Hue smart lights in my house, and I'd like to know if and how I could connect my phone to wifi so that when I receive a call from a specific person, my lights could pulse a different color
and they said that this would be the place for that
Also this is my third day using python
 deft harbor
Data science is not the droid you are looking for
 wicked fable
so, in the eyes of beeing a professional, what does it mean to be a data scientist? what you shoukd know (except of python and libaries like numpy)?
desert oar
depends on how advanced you are
a raw junior might have 2 of these, whereas a "generalist" senior will have 6 or more, in addition to management experience.
- good data visualization and data communication skills
- "modern" machine learning
- "traditional" statistics
- AI / deep learning
- a scientific programming stack (r, julia, python + all the scientific/ML stuff)
- general hacking (web scraping, sql, linux command line)
- software engineering (algorithms, software architecture)
- fluency with "foundational" math (linear algebra, probability, calculus)
- specialized knowledge in some domain space (e.g. signal processing, time series forecasting, graph theory)
- business domain expertise
 vernal pendant
Anybody have any experience getting data from kafka into Spark using Spark Stream plugin? Needing help with integrating using python
lapis sequoia
@vernal pendant do you have some code you're starting with..
would be easier to help
!paste
arctic wedgeBOT
Pasting large amounts of code
If your code is too long to fit in a codeblock in discord, you can paste your code here:
https://paste.pydis.com/
After pasting your code, save it by clicking the floppy disk icon in the top right, or by typing ctrl + S. After doing that, the URL should change. Copy the URL and post it here so others can see it.
vestal pecan
Hello, I have a question in regards numpy arrays:
in a 2 dimensional array, axis = 1 is row, and axis = 0 is column
in a 1 dimensional array, axis = 0 is row ?
lapis sequoia

Sharp Sight
This tutorial will explain NumPy axes. Numpy axes are a little confusing to many beginners, so this tutorial will explain axes and also show some examples of how they work.
vestal pecan
thanks will check it
desert oar
@vestal pecan other way around, axis=1 is columns
when we write .sum(axis=1) we are specifying the axis to collapse
@lapis sequoia this is a wonderful post btw, thank you for sharing
 kindred gate
hello. I am kind of new to python. I am working on, or atleast trying to, on a project. I know the algorithm of how to approach the problem but i am facing difficulties when i try to write that into python. i just dont know how to start and where to go with that. I have been trying to read up on net and trying to do it, but its not really helping me. None of my colleagues want to help because they think it is "copying", if i ask to see their code to understand what they did. This is the problem set:
Objectives:
Design a decision rule on a synthetic data set with two categories. Assume the probability density is Gaussian.
Data set used:
Download synth.tr (the training set) and synth.te (the test set) from Ripley's Pattern Recognition and Neural Networks
Use synth.tr to train your decision rule, and use synth.te to test the decision rule.
-Use maximum likelihood estimation to estimate the parameters of the Gaussian
-Use MAP to derive your decision rules (try all three cases). Illustrate the three decision rules as well as the sample locations (use different symbols for different categories) on the same graph. Comment on the difference.
-Try different prior probability distributions and evaluate the performance. Use classification accuracy as the performance metric.
-Evaluate the performance of your decision rule extensively. Some methods include calculation and comparison of the classification accuracy of applying different decision rules on the testing set.
-Use two-modal Gaussian to model the data set and compare the performance with that using the one-modal.
can someone help me please?
desert oar
@kindred gate share the part that you are stuck on, and whatever youve tried so far
 barren bluff
Hey, I have to implement my own precision and recall function without using scikit or any other machine library, but I am super stuck. I cannot think of a way to write a one liner that returns the correct value, my mind keeps heading back to if-statements.
can anyone help me trough how to implement this formula as a one liner using numpy or something similar:
vestal pecan
anyone knows about wptools and requests libraries?
 polar acorn
@barren bluff If I understood the question correctly you can do the following. Assume true_class and predicted_class are numpy arrays with the two classes: 0 and 1. You can calculate the precision with the following one liner np.sum((true_class==predicted_class) & true_class==1)/np.sum(predicted_class==1)
barren bluff
yes!!! Thank you!
Then my followup quesiton is how to do something similar for this one as well @polar acorn
polar acorn
That can be done by changing one variable in the previous one liner. I'll leave it to you to figure out which 😉
barren bluff
okay cool, but hey @polar acorn why is it that you only devide my the sum of all predictions that are equal to one?
its like the equation is flipped around in that line of code
 dim kettle
True positives and false positives share one thing: they were both predicted positive
barren bluff
oh
desert oar
why do you need a one-liner
the most efficient thing to do is to compute all 4 cells of the confusion matrix, then compute what you need from that
barren bluff
I dunno, my teacher said not to use statements
desert oar
"not to use statements" what
barren bluff
if statements
barren bluff
yes
Plus confusion matrix is the next part
I sat legit 4+ hours trying to figure this little part of my assignment haha.
still a little lost
this was an example my friend sent to me about TP,FP, FN and TN :
when the ground truth is a non-cat, and you predict a cat, it's a false positive, ie you predicted a positive (cat) but it wasn't that when the ground truth is a non-cat and you predicted a non-cat, it's a true negative when the ground truth is a cat and you predicted a non-cat, it's a false negative
lol
desert oar
"fucked" was exactly what i was going to say
@barren bluff ok, and does that make sense to you?
BTW the mods are probably going to ask you to change your name because it can't be easily typed for @ mentions
desert oar
?
desert oar
you can change your nickname per-server
in the drop-down menu on the top left, above the list of channels
barren bluff
oh okay, rip me
I am a bit stuck on the line you gave me @polar acorn tbh
what does it do?
p0 = np.sum((y_true==y_pred) & y_true==1)/np.sum(y_pred==1)
For anyone interested
barren bluff
So is it the sum of all the ground truths equal to the prediction and all ground truths equal to 1?
desert oar
e1 = y_true == y_pred
e2 = y_true == 1
e3 = e1 & e2
e4 = np.sum(e3)
e5 = e4 / np.sum(e2)
"sum" on a boolean array is just a count of True values
since True is stored as 1 in the compuer, and False is stored as 0
desert oar
sum() and np.sum() both try to convert their inputs to numeric first
barren bluff
because the formula is p = TP/TP+FP
desert oar
so "convert boolean to number" means "1 if True 0 if False"
barren bluff
aha
barren bluff
oh yeah
desert oar
you can always try to condense it into a one-liner later if you really really want to
barren bluff
silly one liner
yeah smart choice
so how would it be with if statements?
might actually help my understanding alot
barren bluff
and again why is it flipped around the equation?
desert oar
flipped around?
barren bluff
yeah the one liner is more like p = TP+FP/TP and not p = TP/TP+FP
desert oar
- use parentheses, they mean something
- no, thats not what & does
& is "logical and", elementwise
barren bluff
yeah I understood that part
weird having just a single & in python after writing c++ for 3 years
desert oar
its weird in python
actual boolean logical and is and
but that has special short-circuiting behavior and cant be overridden
python also has non-short-circuiting bitwise &
barren bluff
makes sense
desert oar
which can be overridden
barren bluff
its like c# then
lapis sequoia
Hi, how do I determine if web scraping a database is legal or not?
desert oar
so numpy abuses that to re-define & to mean elementwise logical/boolean "and"
@lapis sequoia read the terms of service and look up local laws
usually if you have to ask its probably not
lapis sequoia
There's no TOS or couldn't find the TOS atleast, but thanks
desert oar
@barren bluff x & y is identical to np.logical_and(x, y)
barren bluff
cool
desert oar
3 & 4 is bitwise, and 3 and 4 is logical
barren bluff
dang I always forget the rules on boolean operations
I dont remember or or Xor or anything anymore
but I am still unsure what is false positive and true positive in that line I sent
my brain is mushed
desert oar
and => both have to be true
or => one or both have to be true
xor => exactly one is true
as to your question... think about what TP / (TP+FP) represents
lets be more concrete
barren bluff
TP = groundtruth == prediction
desert oar
yep
well hold on
no
"true positive" means "it was predicted 1, and our prediction was correct"
"true" == "we were correct"
"positive" == "predicted 1"
barren bluff
yeah mb
yeah when the number we were trying to predict is equal to the ground truth number right?
how about false positive?
desert oar
that's just "we were correct"
i can predict a 0
and the actual can be a 0
then that's also a correct prediction
that's "true"
but it's not a "predicted positive"
barren bluff
thats a false positive?
desert oar
no
imagine you're a doctor testing someone for a disease. that's where the terminology comes from
"positive" -> "they have the disease"
a true positive is, "the test says they have the disease, and the test is correct"
a false positive is, "the test says they have the disease, but they do not actually have the disease so the test is incorrect"
barren bluff
so like cancer
barren bluff
you can have a tumor but it isnt positive?
barren bluff
false positive?
barren bluff
fak me
desert oar
ok fine
barren bluff
this is so hard haha
desert oar
sure, you're testing to see if a tumor is malignant or not
so it's a "positive" if "the test says the tumor is malignant"
it has nothing to do with the actual state of the tumor
it only has to do with what your test says
barren bluff
okay, im sorry but I gotta hear this with ground truths and predictions instead now xD
I have heard it in all other ways
and thanks for helping me btw dude
desert oar
ok sure
lets make a prediction
i predict that the tumor is malignant
that's a "positive" prediction
barren bluff
== 1?
desert oar
yes
barren bluff
okaay
desert oar
the ground truth is irrelevant
barren bluff
so far so good
barren bluff
okay
desert oar
was my prediction correct?
barren bluff
depends on the ground truth
desert oar
okay
barren bluff
whats behind the vale
desert oar
so i made a positive prediction, a 1
let's say the ground truth is also a 1
then is my prediction correct?
barren bluff
yes
desert oar
okay, that's a true positive
now i make another prediction, a 1
the ground truth this time is 0
is my prediction correct?
barren bluff
no
barren bluff
true negative?
desert oar
and it's false because it was wrong
barren bluff
oh
desert oar
so it's a false positive
barren bluff
OOH
desert oar
correct
barren bluff
how about false negative?
desert oar
try it
barren bluff
0 and 1?
desert oar
which is which
desert oar
right
          true/false            negative/positive
            ^^^^^                     ^^^^^
did i predict the right thing?   did i predict a 0 or a 1?
okay I think I might have it now
TN = truth = 0, pred = 0 TP = truth = 1, pred = 1 FP = truth = 0, pred = 1 FN = truth = 1, pred = 0
right?
desert oar
i think you made a typo
barren bluff
yeah tp
barren bluff
oh cool
maybe it can help me on the next assignment
not sure why this does not work for recall:
r0 = np.sum((y_true==y_pred) & y_true ==1)/np.sum(y_pred==0)
polar acorn
@desert oar You're a saint for giving of your time like this 👼
Also @barren bluff In case nobody told you why these terms are important. Imagine the following. I make a medical test to see if someone has a rare disease that only 0.1% of people have. My test simply says that everybody is healthy, nobody has the rare disease. My test say 0 every time. I can now say that my test is right 99.9% of the time (because 99.9% do not have the rare disease) which sounds impressive. But in reality its quite bad, in fact I never correctly diagnose a single patient. This is where looking at true positives and false positives etc. are important.
desert oar
@barren bluff what's the formula for recall
barren bluff
sorry was in the kitchen
if any of you could maybe give me the answer and explain the code that would be great
I cant really learn more after 16 hours of trying to figure everything out
and yeah thank you so much for the help @desert oar you are a great help!
same goes for you @polar acorn
desert oar
@barren bluff ok, look at what you wrote now
np.sum( (y_true == y_pred) & (y_true == 1) ) / np.sum(y_pred == 0)
what is np.sum( (y_true == y_pred) & (y_true == 1) ) and what is np.sum(y_pred == 0) in terms of the confusion matrix
barren bluff
false negative
for the last bit
and true positive for the first bit
right @desert oar ?
desert oar
the first part is TP, yes
the second part, no
in plain english, what is the 2nd part
just describe it in words
barren bluff
the prediction is equal to zero
barren bluff
so it isnt anything
barren bluff
oh so I need to add an extra part?
desert oar
back up a second
lets see if we can build the right one-liner
Recall := TP / #P
we agree that is the definition of recall right
barren bluff
not really sure
the equation is different
it says it is TP/TP+FN
but that isnt the same is it?
or is it 1/FN?
sorry if im hopeless guys!
dim kettle
ok, you in text are able to get the formula right
so, what do TP and FN look like in code form?
desert oar
@barren bluff there are 2 ways to define it
it says both of them in the pic
Np is "#P", the number of predicted positives
the actual definition of recall is TP / #P but we can restate #P in terms of what's in the confusion matrix, which makes it easy to calculate based on just the confusion matrix
are you with me so far?
barren bluff
yeah somewhat
but I dont know how to program that
have not seen any examples yet
but yeah I understand
desert oar
sec
barren bluff
all good im just excited to know xD
barren bluff
if the values are over zero return the value?
barren bluff
so just return all 1's?
barren bluff
sorry dude I cant tell ya, my brain is finished
Im too slow now
like matrix. count
or what ever
desert oar
no no no
forget numpy
just logically
thats how you do it right
you just count the 1s? cause we literally just want to know how many 1s there are?
desert oar
we want number of positives
so yes
a positive is a 1
count the positives
count the 1s
thats it
barren bluff
cool
desert oar
so that's #P
barren bluff
so how code wise?
desert oar
= number of
P = positives
who cares about code, lets finish the definition first
we need TP / #P , that's the definition of recall
barren bluff
I have to turn in assignment in 50 minutes
desert oar
oh
barren bluff
and im not done with the journal
desert oar
yeah just np.sum(y_true == 1)
barren bluff
so im getting a bit stressed sorry
desert oar
that's #P -- adding up all the 1s means counting the 1s
and we already have TP
so TP / #P , done
barren bluff
wtf I could have sworn I wrote the exact same code like ten minutes ago
but thanks
it works fine now
thank you so much 🙂
desert oar
what
do you %%time every cell?
t0 = perf_counter()

# ...

t1 = perf_counter()
print(format(t1-t0, '0.2f'), 'seconds')
i just do that
from time import perf_counter

class Timer:
    def __init__(self):
        self.t0 = perf_counter()
        self.t1 = None

    def __enter__(self):
         return self

    def __exit__(self, *args):
        self.mark()
        print(self.format_elapsed())

    def self.mark(self):
        self.t1 = perf_counter()

    @property
    def elapsed(self):
        return self.t1 - self.t0

    def format_elapsed(self):
        return f'{self.elapsed:0.2f} seconds'
theres this too
 silent swan
I'd cheat and use contextlib
desert oar
yeah i wanted to be able to access the timer object after
i do always forget that i think im supposed to inherit from AbstractContextManager though
from contextlib import contextmanager
from time import perf_counter

@contextmanager
def timer():
    t0 = perf_counter()
    yield
    t1 = perf_counter()
    print(f'Elapsed: {t1-t0:0.2f} seconds')
 grizzled folio
oh that's neat
lapis sequoia
How can i make this more readable on jupyter
Like i created an array to store my data but i need it to be in clean decimal form so i can actually read what is the data
how can i do it in jupyter like we can do it in spyder?
silent swan
- this is not a jupyter thing, this is a numpy thing

Stack Overflow
I'm curious, whether there is any way to print formatted numpy.arrays, e.g., in a way similar to this:
x = 1.23456
print '%.3f' % x
If I want to print the numpy.array of floats, it prints several
 supple ferry
In general, scientific notation is more convenient, at least to me
lapis sequoia
Oh I see
Thanks
Yeah I mean it's pretty important as far as precision of model goes.. but its unreadable sometimes
 wicked flare
@barren bluff there are lots of datasets to practice on on https://www.kaggle.com/
Download Open Datasets on 1000s of Projects + Share Projects on One Platform. Explore Popular Topics Like Government, Sports, Medicine, Fintech, Food, More. Flexible Data Ingestion.
barren bluff
yeah I checked it out, but had a hard time figuring out what is simple enough for someone just starting
lapis sequoia
Titanic is a good starting dataset
barren bluff
okay cool
I think we have to use deep learning at somepoint on the same dataset
is that a good enough set?
lapis sequoia
Neural networks / Deep Learning algorithms need a lot of data. If I remember correctly, the Titanic dataset only contains a few thousand (if that). That's big enough for algorithms like Decision Trees / Random Forest etc, but not for Deep Learning.
 prime elm
Hi is anyone here in computer science. I have a question for my homework. I dont need the answer, but i dont quite understand the ideas behind this question
im trying to get ahead, but my teacher posted only the homework not the lectures
please ping me bc i will be tabbed out looking at my homework (:
right now i graphed them all to organize from slowest to fastest growing terms
 normal copper
iirc, just depends on the type of graph you get
Rob Bell's software development blog, discussing object-oriented programming, design and best practices, amongst other things.
Not sure about big-Theta
All Big-O types are described in the link, should allow you to sort those at least I hope
prime elm
@normal copper so am I just grouping it in to linear, logrithmic, quadratic such and such
normal copper
Yes
prime elm
thats p simple. but i should look more into w.e the big theta thing is
normal copper
I did a quick lookup on that too
Basically
The red line being Big-θ
Meaning theta has a slightly variable runtime, but on average between certain limits

Khan Academy
Think this one is most common when it comes to random/guess based algorithms
Which confuses me, cause that wouldn't apply to any of
https://discordapp.com/channels/267624335836053506/366673247892275221/624248580978376733
So I'm probably missing something as well.
prime elm
i was just about to ask how do you think it might play into this 😅
i guess i need to think about that more 🤔
imma start grouping
normal copper
Yeah... same, been ages since I dug into this
So I'm all lost when it becomes more complex than just the Big-O
Hope this helps you along a bit though 🙂
prime elm
yep it does. imma email the TA about the big theta after i group
but if i dont get an answer and i get impatient looking on the internet ill probably come back here to see if anyone knows wth big theta does in this question
normal copper
Awesome, good luck man
barren bluff
Hey I have to work on a project on the side of my machine learning course to pass the class, I am pretty nooby but I want to do something fun none the less. Someone recommended working with the titanic dataaset, but it seemed a bit small? Any good facial recognition datasets(and how would I work with them)?
I was thinking about using this dataset, but was not sure it would be too hard for a beginner

Image Scene Classification of Multiclass
or this one https://www.kaggle.com/moltean/fruits

A dataset with 80653 images of 118 fruits and vegetables
 orchid geode
anyone can help me with this?
 restive charm
@barren bluff Those datasets are good to work with, if you want to create a neural network model, CNNs to be particular
There's quite a bit of underlying theory involved if you want to get a good grasp for how neural networks work. However, you can skip through it and refer to the kernels on kaggle if you want to just work on the implementation aspect of creating a model
 lofty shore
Hey all. I'm looking to pick the brain of someone with computer vision experience.
Background:
We're building a system at work to generate 3D reconstructions of small animals for kinematic analysis. The requirements are 360deg coverage of the animal at all times, approx 19 points need to be tracked to cover major joints/areas of interest. Our capture system can handle 4x 1440x1080 feeds at 140 FPS and we don't want to go much lower than that. All the analysis after capture can be done offline. We're using 4 hardware triggered/synch'd Flir cameras for video capture, a DCNN for 2D pose estimation, the OpenCV calib3d module for stereo calibration and triangulation and finally pclPy to perform 3D point cloud registration on the 4 generated point clouds.
Problem:
I'm wondering if a real expert can poke any holes in our approach or knows of a more accurate or easier way to accomplish this. We want to be sure we're heading in the correct direction. If anyone has any input I'd love to hear it!
vestal pecan
when do you consider unpivoting columns in a table
vestal pecan
I m trying to drop rows that follows a specific condition as below:
twt_copy[(twt_copy['in_reply_to_status_id'].notnull()) | (twt_copy['in_reply_to_user_id'].notnull())].drop()
but the .drop is not working, giving me error to specify a label, index. what are better method to do that
dim kettle
@vestal pecan What about doing dropna with specifying a subset?
 native patrol
yeah .. if you want to keep those rows where either of those columns have some value
then a df.dropna(subset=column_list, how='all') is probably the best option
 tranquil oxide
whats the simplest way to add a row to the bottom of a pandas dataframe?
is it the append function?
vestal pecan
@dim kettle i want to drop the one with data not nan
@native patrol I want to keep the columns that are empty on a specific column
native patrol
@vestal pecan you want those rows where both columns are null?
in that case you can do df[df['col1'].isnull() & df['col2'].isnull()]
native patrol
it's functionally the same .. if you really want to use a .drop method
vestal pecan
yeah just was wondering how to with drop
native patrol
you can use df.drop(~(df['col1'].isnull() & df['col2'].isnull()))
strange knoll
Any one good with avl trees?
im trying to figure out whether this avl tree is performing a right left rotation
 floral patrol
would this be the right place to ask for some pointers on plotting?
 quasi tide
sure
floral patrol
Okay then,
I want to find the most optimal route for a thing in a game.
Got a SQLite database with the points I can plot through (crated from a json dump) and want to get from A to B with some constrainst.
Basically there's 2 types of points, one type I can get fuel from, the other one increases my possible range x4. The fuel consumption has an exponentional growth related to the distance between points and mass with fuel also weighing something. There's limited range and can only have max x fuel at a time.
What should I look at having no experience in things like this? Just thought I'd ask before spending a day googling
 earnest prawn
Sounds like a simple ish graph theory problem with a tiny twist which should be easy to solve using depth search to me
 serene scaffold
Does anyone have the link to download a small set of Gensim word vectors? I need some to test a script.
The vectors I'm working with take too long to load for testing purposes.
 jagged stump
Hey everyone I dont know its good place for ask but I wonder your opinion .
I am trying to logo detection during broadcast so it means it must analysis live ! Vehicle brand I used cause of there are many photo for image/test about vehicles. I used HOG + CNN but it doesnt work as I suppose . Any suggestion?
 hot nimbus
Hello everyone i have a query can anyone guide me? related to Firebase data to pandas?
any guide or reference.
vestal pecan
hello, is it possible to save jupyter notebook variables as they are without having to re-run all the cells whenever i open the notebook ?
lapis sequoia
hey guys, first time offender here, coming from (bio)chemical engineering. Currently I'm trying to model a chemical reaction which was successful so far but I've hit a stumbling block when trying to introduce a second variable (until now, everything was only time dependent). The rate of change of my main reactant is dA/dt = + R*c - v(a) where R =production rate, c=constant, and v(a) = consumption rate dependent on the concentration of a. Until now, I had R as a constant and was able to solve this ODE using symfit. Going forward, I would like to introduce R as a variable. Will this change my ODE system to a PDE? Apparently, most packages like scipy, symfit, sympy can't handle PDE systems? Any hints for me on how to proceed?
desert oar
@lapis sequoia that's a good question but not a data science question
@jagged stump You will need to provide a lot more information, like the size of your data set, the number of unique labels, how are you are training the model, how are you are evaluating the model, what the model architecture is, etc.
 obtuse skiff
Anyone with pyspark experience? I have a file that I need to split via sentence, but the file is too large to put into a single array, then split.
This is what I have now but its giving me memory issues
text = sc.textFile("hdfs:///user/epid/input/file.txt").glom().map(lambda x: ' '.join(x)).flatMap(lambda x:x.split('.'))
what can I use to split it, so each sentence gets its own part of the RDD
The memory issues are fixed when I remove the glom and join, but then it splits it by each line, and that wont allow me to get the sentences because some are on multiple lines
silent swan
@lapis sequoia like mathematical sets, you use it for checking/recording the existence of items
@vestal pecan pickle, or just save the data you need. You should not expect all your variables to just be hanging around all the time
vestal pecan
oh okay thanks ! 🙂
desert oar
@obtuse skiff can you stream it in somehow?
i've never used spark in a streaming fashion
but i know it's a thing
desert oar
how do you determine what's a "sentence anyway?
desert oar
hmm
https://spark.apache.org/docs/latest/api/python/pyspark.streaming.html maybe there's something in here
obtuse skiff
just a rough estimate to see if they repeat words in the following sentence
deft harbor
Not python, but is anyone here good with counting subsets?
desert oar
@deft harbor like combinatorics?
deft harbor
Yeah
Say you have 56 data points, and you want to know how many subsets are created if you remove three different points each time.
desert oar
isnt that equivalent to the number of 3-element subsets?
 olive nimbus
hello , does any one use vadersentiment ?
arctic wedgeBOT
Asking good questions will yield a much higher chance of a quick response:
• Don't ask to ask your question, just go ahead and tell us your problem.
• Try to solve the problem on your own first, we're not going to write code for you.
• Show us the code you've tried and any errors or unexpected results it's giving
• Keep your patience while we're helping you.
You can find a much more detailed explanation on our website.
 quartz stream
BTW Spacy is good alternative if you wanna do sentimentet analysis
 odd terrace
Hello I want to create this kind of dilation effect but with a mask. I know opencv ans scikit have this implemented but the evaluation must take place at the first iteration at the border of the mask and not sample pixel beyond. Do you guys know how to do that? Thank you
Also if I do a loop to grow the mask how do I know when to stop?
odd terrace
Still looking for a better answer though
 worn stratus
does anyone have a good reccomendation for a book covering maths for machine learning and possibly data science in general?
I have one university unit on it, but my uni is pretty shit - so they'll probably avoid the maths as much as possible - it = machine learning
 alpine nymph
does anyone know the library pandas
arctic wedgeBOT
Asking good questions will yield a much higher chance of a quick response:
• Don't ask to ask your question, just go ahead and tell us your problem.
• Try to solve the problem on your own first, we're not going to write code for you.
• Show us the code you've tried and any errors or unexpected results it's giving
• Keep your patience while we're helping you.
You can find a much more detailed explanation on our website.
desert oar
@worn stratus at what level of expertise?
alpine nymph
i need to send the file over that i have a question on
desert oar
can you ask a more general version
alpine nymph
can't really have to show the code btw do u know pandas?
desert oar
i do but i won't provide help outside of this server
@worn stratus
Bishop - Pattern Recognition
Murphy - Machine Learning
Hastie, Tibshirani, Friedman - Elements of Statistical Learning
Ash - Basic Probability Theory
Burkov - The Hundred-Page Machine Learning Book
McElreath - Statistical Rethinking
Davidson Pilon - Probabilistic Programming & Bayesian Methods for Hackers
Casella & Berger - Statistical Inference (advanced)
worn stratus
Thanks for the list and sorry for the late reply
I assume it doesn't matter now, but I'm pretty much at high school level maths ability
With no expertise at all in data science
jagged stump
Hey everyone I dont know its good place for ask but I wonder your opinion .
I am trying to logo detection during broadcast so it means it must analysis live ! Vehicle brand I used cause of there are many photo for image/test about vehicles. I used HOG + CNN but it doesnt work as I suppose . Any suggestion? I repeat my question with update what @desert oar says. I will use flickr_logos_27_dataset so its kind of 4000 data maybe about cars . I dont know well about other things that is why I am asking 🙂
desert oar
@void anvil did you forget 'rb'?
wait what
ml_algo = pickle.dump(svm_predictor, open("file.sav", 'wb'))
what is this meant to do
with open('file.sav', 'rb') as f:
    ml_algo = pickle.load(f)
???
 desert cradle
@void anvil is that really the code? the error message looks like you had something like "C:\Users\something..."
not just ifle.sav
desert cradle
ok yeah, i was confused because the \ doesn't appear in the code you pasted
I assume you changed from the real full path to "file.sav" when you pasted it?
 hollow shard
hi, could anyone explain to me why this http://dpaste.com/24JJ1MN code for a simple mnist 1 hidden layer neural network doesnt work, and how to fix it?
 tranquil dagger
Hello everyone. I am having an issue with Py4J that I posted about on Stack Overflow (https://stackoverflow.com/questions/58087489/issue-with-py4j-tutorial). Would anyone be able to help me out? I don't have previous experience with Java.
Stack Overflow
Please note I do not have any previous experience with Java. I am having issues with the following tutorial for Py4j: https://www.py4j.org/getting_started.html
I installed Py4j in an Anaconda
 tight dove
Hello all
I think this is my first time here
I've some noob questions on analytics, hope they get answered lol
Ok, just this afternoon, I tried read a csv into a pandas dataframe but noticed the disjointed manner in which the data came out
here's a screenshot of the data in excel
Please how do i clean this up? What do I need to do? Examples would be apreciated as well
Okay
So what kind of data source is this?
desert oar
@tight dove use pd.read_csv(..., sep=';')
that changes the record separator from , to ; which is what you have in your data
tight dove
Yes, I just did that. found the solution on stackoverflow. that delimiter was the term I was looking for 🙂
thank you all
vestal pecan
Hi all, which course do you recommend for someone finished data analyst program
Android Basics by Google
https://www.udacity.com/course/android-basics-nanodegree-by-google--nd803
Deep Learning
https://www.udacity.com/course/deep-learning-nanodegree--nd101
AI Programming with Python
https://www.udacity.com/course/ai-programming-python-nanodegree--nd089
Predictive Analytics for Business
https://www.udacity.com/course/predictive-analytics-for-business-nanodegree--nd008
Intro to Machine Learning
https://www.udacity.com/course/intro-to-machine-learning-nanodegree--nd229
oh wow didn't know it will open preview for all links
🤦
 woven musk
is anyone familiar with numpy and booleans?
desert cradle
just go ahead and ask your question @woven musk
prime elm
how do i design a function that takes a list (binary tree) and finds its left most node (I posted this in help, but it wasnt answered for a while so im moving channels i suppose (: )
desert oar
thats not really on topic here
prime elm
oh okay gotcha
 white mesa
Hey i have a dataset
where i want to make some data visualisation, and eventually some ML
on the Y column, i have current satisfaction from 1-5
and X axis i have total budget
and i want to try and display some form of linear context
after me feature engineering, i tried to use seaborn
to make an lmplot
sns.lmplot(y='Q17', x='Q54', data=df)
but i get a really bad plot
grizzled folio
maybe your data isn't suited to that plot
 pulsar stag
For anyone interested in Financial Data I've created tutorial video on Alpha Vantage API on how to build a live fetching Dash application: https://youtu.be/MCN33xZNoqk

My Website: https://www.cryptopotluck.com Alpha Vantage Github: https://github.com/zackurben/alphavan... Alpha Vantage Documentation: https://www.alphavantag...
 woeful jungle
Hello, How do I get my computer to utilize GPU when running python code?
quartz stream
@woeful jungle Try Cuda
tight dove
I wrote a function to detect outliers using isolation forest, but I keep getting an error
TypeError: __init__() got an unexpected keyword argument 'behaviour'
from sklearn.ensemble import IsolationForest

def isolation_forest(series):
    clf = IsolationForest(behaviour='new', contamination='auto', random_state=0)
    series = series.values.reshape(-1, 1)
    clf.fit(series)
    return clf.predict(series)
from my train set from the dataset,
series = train_without_missing_bookingPrice.clickIn
inliers = series[isolation_forest(series) == 1]
I went to stackoverflow and from the answers, it was suggested I update scikit-learn on my machine
I used conda update scikit-learn
But I'm still getting the same error
lapis sequoia
you guys got any good pandas tutorials out there
desert oar
@tight dove fortunately behaviour is deprecated anyway
conda list | grep scikit-learn what does that show?
hollow shard
hi, anyone got any idea as to why this k-means clustering program doesnt work?
ping me if you can help please
thanks in advance 👍
lapis sequoia
guys how do i make my model (im trying to make a speech recognition model ) ignore the background noise and just focus on what the person is saying?
lapis sequoia
so uh , who knows the best Pandas tutorial on the net or maybe a book?
silent swan
there's a lot of speech denoising technology, I wouldn't know where to start
there's Python for Data Analysis written by the author of pandas, but idk if it's outdated
I think it should be fine to grab a couple chapters from that and get the basic idea of series/dataframes
and then just google for what you need
pandas really is just a big pile of convenience methods for all sorts of things. There's no real structure to it.
 olive robin
hello
anybody know how I can use imagenet or alexnet
I want to build a program that links users to similar items resulting from what they upload to the program
so I want to use one of those as the backbone
halp needed pls :/
silent swan
ImageNet is a dataset
AlexNet is a very old CNN model
you should look at tutorials for Keras or PyTorch
pulsar stag

My Website: https://www.cryptopotluck.com Github Repo of Project: https://github.com/cryptopotluck/alpha_vantage_tutorial Alpha Vantage Github: https://githu...

GitHub
tutorial video I made and the repo that goes with it - cryptopotluck/alpha_vantage_tutorial
olive nimbus
hello is anyone familiar with open cv ?
desert oar
!ask
arctic wedgeBOT
Asking good questions will yield a much higher chance of a quick response:
• Don't ask to ask your question, just go ahead and tell us your problem.
• Try to solve the problem on your own first, we're not going to write code for you.
• Show us the code you've tried and any errors or unexpected results it's giving
• Keep your patience while we're helping you.
You can find a much more detailed explanation on our website.
deft harbor
desert oar
@cunning bear cross validation is the name of a technique in statistics and machine learning
the sklearn.cross_validation module is what has been deprecated
KFold means "k-fold cross validation"
 cunning bear
Oh I see
 hidden radish
guys, i have a lot of experience with python and ML, but looking for other jobs, i constantly see in the required experience ETL, and building data pipelines. What are those and do you have some course recommendations for them?
desert oar
what does 'a lot of experience' entail
usually if you have a lot of experience you're past the point of needing to take courses on ETL
hidden radish
i worked for a long time, roughly 3 years with plain python and machine learning, but the data that was used was already in place and clean
unless thats just a fancy name for a simpler concept that i am not aware of
not a senior by any means, but i have some experience in my baggage enough to work with ML and python properly
@desert oar
desert oar
ETL is just "extract transform load"
if you're trying to pivot to data engineering then youll probably want to skip the "noob" stuff and probably just go for some combination of database admin, spark/hadoop and other big data technologies
maybe theres some courses on building data pipelines out there
but thats really if youre trying to move up to e.g. FAANG scale
most companies just need basic data engineering and IT
hidden radish
thats exactly what im trying to do, to be honest i grew a little tired of ML black box magic
hidden radish
not an expert on those, but got some background
desert oar
would make you a much more capable machine learning practitioner too in the long run
if youre just plugging stuff into a black box youre going to be restricted to certain problems where that works well (e.g. image classification)
speaking frankly i wouldnt even call that machine learning
i mean, its machine learning? but in the same way that doing t-tests in excel is statistics
you can go so much deeper and get so much more out of it
hidden radish
yeah, i see where you are going, and i agree to some extent
desert oar
so you have options
basically, do i wanna be "plumber" and make things work fast and smoothly (data engineering), solving hard technical challenges
or do i wanna be a "researcher" developing algorithms at a more sophisticated level, cleaning data, being creative with feature engineering, making presentations to management, etc
theyre equally noble imo, depends on what you like
hidden radish
tbh i dont know what i like, since i have not tried either of those thus not having a grasp on a daily routine
and the career switch that i intend to, its basically because i think that "machine learning" will not be a plus in a couple years, as it is getting easier and easier, with lesser and lesser needed knowledge on whats does it actually does over the years
i am confident that in a very short time span, literally every SWE will be able to do black box magic in a couple lines of code with little to no knowledge on whats happening
and what is a plus today, will be a must
desert oar
the kind of machine learning you are describing, yes
hidden radish
and to follow this carrer i would have to go academical, getting a phd, which is far far away of what i intend to go
desert oar
you dont need a phd
a masters is usually fine, or work experience + a bootcamp or intensive online course
if you actually commit to the study and practice of machine learning and data science, you will have the skills and tools to not be at the mercy of industry trends
as you increasingly automate your own job, you will be able to focus on increasingly more sophisticated tasks
there are also lots and lots and lots of "small" problems that are not sexy and don't get news coverage, and cannot be solved with the magic black box
but are fun and interesting to work on, can have immediate and significant impact on a business, etc
and don't require a phd at all, maybe not even a masters if you are willing to commit to self study
hidden radish
yeah, i agree with you
desert oar
</rant>
hidden radish
i am just trying new experiences, since i am kind of early in my carrer
i want to see whats like to work on each stack, to figure out what i actually want to specialize
thats why i was asking some data engineering questions
so for the carrer switch, as you were mentioned before, what should i focus on for now?
got a good foundation on what was mentioned before, and also SQL, and some little knowledge here and there trough some personal projects and study
a little of spark, some theoretical about nosql, some in hadoop
but dont think enough to actually land a job
"most companies just need basic data engineering and IT", please expand
desert oar
look at most non-senior data engineer job posts
it's: basic machine learning and stats, python, linux, sql, hadoop/spark/hive, docker, kubernetes
desert oar
ah
a data pipeline is indeed vague
i'd say in general it's any software primarily designed for moving data from "raw" form to a "processed" form in a production or automated setting, possibly with a machine learning model at the end
lapis sequoia
I would say, a data pipeline is where there's a source and a sink.. and it may or may not include transformations in the middle
desert oar
That's probably a better definition
 livid relic
Anyone here pretty familiar with opencv?
desert oar
Lol
What was the roast about? I like the API
The 2.0 API that is

I just saw that
Lol I can see that sub is a little bit biased
livid relic
hmmm
 slim fox
in my job search I was been asking around a bit and everyone seem to reccomend tf/keras rather than pytorch
slim fox
btw anyone knows a good resource to learn tf2,0/keras?
slim fox
@desert oar that makes sense 🙂 how beginner friendly is it?
desert oar
i think it helps if you already know the math
and the techniques
i'd be pretty lost if i was also new to ML
slim fox
well I know some, and I understand and can use scikit-learn
and in some online courses I follow there were DL parts, so I am not at a 0 level for ML/math and even some basics of DL @desert oar
dim kettle
Airflow question:
I am designing a process that will have multiple DAGs. Each DAG can have a branch where it is dependent on something running on an ec2 in AWS. This ec2 process has a long setup and teardown time, but low run time. So ideally I would like each branch to be queued until they're all ready to run, start the ec2 once, run for each DAG, and teardown once.
I thought about creating these as sub-DAGs, but ideally I want to be able to preserve history runs so that I can more easily identify a problem if one arises.
Open to ideas on how I might accomplish this.
desert oar
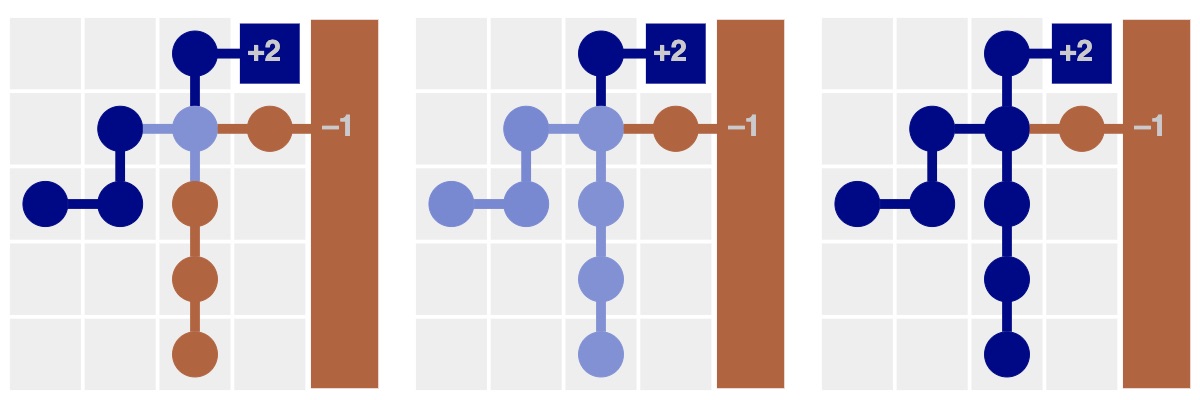
https://distill.pub/2019/paths-perspective-on-value-learning/
@void anvil might be interesting to you since you do RL
Distill
A closer look at how Temporal Difference Learning merges paths of experience for greater statistical efficiency
 dark wharf
I have a question about opencv
 fair locust
!ask
arctic wedgeBOT
ask
Asking good questions will yield a much higher chance of a quick response:
• Don't ask to ask your question, just go ahead and tell us your problem.
• Try to solve the problem on your own first, we're not going to write code for you.
• Show us the code you've tried and any errors or unexpected results it's giving
• Keep your patience while we're helping you.
You can find a much more detailed explanation on our website.
 limber cradle
Oooooookay. I'm trying to dive into ML, specifically NN. I've been through a short introductory course. Now I'm trying to broaden my knowledge base. So I'm just trying to collect terms into a kind of glossary and then get definitions for each one so that I can read things and begin to understand them.
And I'm already tripping up because I'm trying to get a definition for a "perceptron" and I'm getting some contradictions here. One thing states that it's a neuron that uses step function activation, another seems to be saying it's just a synonym for neuron as I know it (linear combination of input terms and an unspecified activation function)
annnnnd wikipedia says a third thing which is that it's a single-layer neural network
desert oar
fortunately you dont need to care
you will probably never hear someone say "perceptron" outside of a classroom in 2019
silent swan
sometimes fully connected layers are still referred to as MLPs
but for all intents and purposes
perceptrons are a historical term
(one pet peeve is that when people go through a generic "history of modern deep learning" and bring up the whole perceptron XOR story. It's a nice story but it also ignores all the other and far more relevant statistical methods. Mainly because it was seen as "AI" from the start and not boring statistics)
 hot compass
hey guys, I was wondering if you guys could teach me how to do a little script that does the following. Reads stock names(saved as symbol) and amount of that stock owned per company and then prints out the symbol and amount owned in that symbol. If possible I would like the file to store info like :
msft:2
appl:4
snap:7
etc, and i was wondering if you could also explain how I would add values to the file so I can read it and increment or decrement the amount in each
 latent flicker
Do you know about dictionaries and JSON?
odd terrace
Hello
I have two overlapping images.
On the overlapping region I compute the square difference pow((a-b),2)
I want the minimal boundary error cut
Ho can I do that?
I tried
So I assume it's directionnal
But I get sort of discontinuities
MaskWsd = np.zeros(Wsd.shape)
    for i in range (overlapy,overlapy+Y):
        for j in range (overlapx, overlapx+X):
            if (i==overlapy):
                Wsd[i,j] = Wsd[i,j]
            else:
                Wsd[i,j]= Wsd[i,j] + min(Wsd[i-1,j-1],Wsd[i-1,j],Wsd[i-1,j+1])
        ind = np.argsort((Wsd[i,:]))[0]
        print (ind)
        MaskWsd[i,ind] = 1
Do I do something wrong?
 serene veldt
In sicki-learn documentation, they say this regarding to their voting mechanism for Random Forests
In contrast to the original publication [B2001], the scikit-learn > implementation combines classifiers by averaging their probabilistic > prediction, instead of letting each classifier vote for a single class.
Does anyone have any reference to the methods used? i dont think i fully understand how it works
polar acorn
I'd imagine the two approaches they talk about work like this. Imagine you have a random forest model composed of 3 decision trees. And you're trying to classify cat or not a cat. For one picture you get back.
Tree 1: 90% chance it's a cat
Tree 2: 45% chance it's a cat
Tree 3: 45% chance it's a cat
The old approach of letting each classifier vote would say thats 1 vote for cat and 2 votes for not a cat so the model will say not a cat.
The approach used by scikit learn will say the average of the classifiers probabilistic predictions is 60% so the model will say it's a cat.
desert oar
@polar acorn single decision trees don't typically emit class probabilities so that's still kind of curious
deft harbor
If I'm using sklearn's PolynomialFeatures to add powers to a couple features in an existing dataframe, what is the best way to replace the existing feature with the polynomial features in a copy of the dataframe?
Just go through adding the new polynomial features one by one?
desert oar
@deft harbor you just want to replace a column with it square?
deft harbor
A little more than that.
Say I have:
speed, light, range, rain and snow variables.
I want to get:
speed, speed^2, speed^3, speed^4, light, range, range^2, range^3, range^4, rain and snow.
I can use PolynomialFeatures to create expand the features, but then I have an array [2,4,8,16] for each observation.
It seemed there had to be a better way of updating the dataframe with these new values, than:
df_copy['range^2'] = expanded_range[: , 1:2]
df_copy['range^3'] = expanded_range[: , 2:3]
etc
A lot of work if the feature list is long and I'm expanding a lot of them.
limber cradle
Is Andrew Ng's ML coursera thing a good entry point to the subject (equipping me to actually work on my own projects), or would you recommend an alternative?
desert oar
from what i've seen (and i have not taken the full course, nor have i kept up to date with its changes over time), it's a good intro to a fairly narrow subset of data science and machine learning, but it should give you the tools to at least get started doing some projects. just be mindful that machine learning specifically and data science in general is a huge diverse field, and that one course is only ever going to be a starting point
@deft harbor expanded_range is a numpy array right?
@deft harbor
data = # data frame

poly_columns = ['speed', 'light', 'range', 'rain', 'snow']
degree = 4

expanded_columns = []
for colname in poly_columns:
    expanded_columns.append(colname)
    expanded_columns.extend(f'{colname}^{exp}' for exp in range(2, degree))

expander = PolynomialFeatures(degree=degree, include_bias=False)
expanded = expander.fit_transform(data[poly_columns].to_numpy())
expanded = pd.DataFrame(expanded, index=data.index, columns=expanded_columns)

data[expanded_columns]  = expanded
Thanks for the response, had to run to the airport.
As I'm learning these packages I sometimes seem to forget the basics of having base python do some of the work.
 dry ice
is this the right channel to ask questions about networkx?
 devout imp
hi i got a question. how do you cluster time-series data? there's this article i found where the author used the same centroids he used in 2014 data for 2004 data: http://www.turingfinance.com/clustering-countries-real-gdp-growth-part2/
I have 2000-2015 data of countries. The data have gaps in a lot of years for some features. I was wondering if it will make sense to group the years into blocks so I can capture more countries (110 at max) than just around ~70 countries if I use one year when I do the clustering. Say, I'll have 4 blocks/groups with 4-years worth of data each. Will that make sense? If so, is there a way to check reliability of it?

This post produces a clustering of countries based on socioeconomic indicators that drive GDP Growth. Clustering can help identify attractive investments.
 agile wing
anyone use azure databricks?
desert oar
@devout imp That's a really interesting question, ping me if I don't respond in a couple days
@agile wing i use it at work
 chilly shuttle
 faint kelp
Can I ask a ML related question here perhaps? I want to do something where I train a model on recognising an address or a name, in server logs... I have a lot of names and a lot of addresses I can train on, but as I’m a noob, what model should I research?
chilly shuttle
lstm would be a good starting point
for ML classification you generally need to have a training dataset which is labelled, that is a log entry and the corresponding output you hope to get
for the task that you're describing, an ML model might not be the best solution without a large amount of training data
faint kelp
Ah cool, thank you for the heads up, I’ll reaearxh that. But I could give it a lot of addresses then, and it could learn to scan documents for those kinda patterns?
I have like 300.000 addresses I can give it
chilly shuttle
i don't know enough about what you're doing, but yeah I think it's quite feasible
faint kelp
Yeah, of course 🙂 But thank you, it will get me started!
chilly shuttle
learn the basics of training and using ML models, like selecting training data and having a held-out validation set etc.
faint kelp
I’m doing that at the moment yeah, probably diving too deep into details though, as I’m reading both lin alg, calculus, probability and statistics again, so maybe I should just get going and start building something 😄
chilly shuttle
it's pretty easy to do that with tools like keras these days
faint kelp
Awesome, I’ll look into that, thank you 🙂
desert oar
You need labeled data though
Youd have to be clever about training
Eg construct 10s of thousands of simulated log records
You will likely want a character level model
This is really a "sequence tagging" problem
And youll also want to make sure that your model is actually useful, i.e. your baseline benchmark is handcrafted regex
@faint kelp ^
Hold on, are you talking about domain names IP addresses or mailing addresses
faint kelp
Mailing addresses. It’s GDPR related, we need to check and anonymise server log and other data
First I just want to actually find the addresses
@desert oar
desert oar
ahh
can the addresses be "anywhere" in the text? @faint kelp
if so, then yes this is a sequence tagging problem
and you'll need to construct many thousands of log records with addresses in them, not just addresses alone
faint kelp
Yeah, addresses could be anywhere. I see. Then the first job will be to do that. Is it still the same model I should use? @desert oar LSTM?
desert oar
maybe....
i think there are things to consider before going for lstm
or deciding what model to use at all
you will likely end up using LSTM
but
its not just "throw data into model and walk away"
@void anvil im thinking BPE
also if this is GDPR they're not likely US addresses
yeah, but addresses are more free-form otherwise
https://guillaumegenthial.github.io/sequence-tagging-with-tensorflow.html @faint kelp this is a good intro to sequence tagging and yes it does show the use of an LSTM
Guillaume Genthial blog
GloVe + character embeddings + bi-LSTM + CRF for Sequence Tagging (Named Entity Recognition, NER, POS) - NLP example of bidirectionnal RNN and CRF in Tensorflow
you can probably hard-code a bunch of features by looking up a list of all counties or towns or w/e in your city
good point @void anvil
they have 300k addresses already
i was suggesting they cook up some fake logs
i still think you could do this with regex and/or a hand-spun parser
since town names, street names, etc are often public data
fwiw i have considered using a very similar model for a very similar task
but i ended up hacking it together w/ existing models, namely the usaddress library which is a pre-trained CRF model
either way ML is likely not your first stop on solving this problem. especially with something like this, this is not a beginner task
chilly shuttle
he said he had 300k labelled entries
desert oar
that said @void anvil did you skim that article? it actually looks like a pretty intelligent approach
chilly shuttle
that's more than enough to train ml
desert oar
@chilly shuttle they have 300k addresses, not entries
thats only part of the story
@void anvil my only concern would be the vocab sparsity. but as you said, using character n-grams might fix
oh
i was talking about the modeling approach
yes i agree on domain-specific resampling
i think thats what i was suggesting right? like generating fake log records w/ real addresses
faint kelp
I’ll try to look into what you guys are talking about too, or else yeah I can just hardcode all the street names maybe
It’s probably not
I do, but your suggestion sounds like a good plan
But I want to find addresses where there isn’t any zips too
limber cradle
Is anyone familiar with this coursera specialisation: https://www.coursera.org/specializations/deep-learning ? Is it worth the time/effort in terms of delivering something that would be more difficult for me to find myself just bumbling around random websites online?

Coursera
Learn Deep Learning from deeplearning.ai. If you want to break into AI, this Specialization will help you do so. Deep Learning is one of the most highly sought after skills in tech. We will help you become good at Deep Learning. In five courses, ...
faint kelp
Awesome, I’ll look into that, thank you. Can I train on direct addresses? Or do I hand to give it logs with addresses?
Oh ok
Thank you, I’ll start the research 🙂
I’ll look into bpe as well
desert oar
When doing RL on things with limited data sets and collection costs (e.g. stocks, production lines; pretty much everything but video games or things with robots, etc.), I think the most limiting thing to creating good, implementable algorithms is inefficient data usage (resulting in over/underfitting) rather than learner choice. Given an infinite sized data set and runtime, they should pretty much all arrive at the same path.
this is true for anything btw, not just RL. although feature engineering maybe matters more in other domains? since in RL you're kind of stuck w/ whatever your "sensor" inputs are?
Because data is more limiting than algo choice, the main focus for ML practitioners should be on 'getting more mileage' out of the data at hand. There are significantly better ways to resample and change data (especially time series) than just randomly starting/stopping (a la monte carlo type approaches) that will yield better results, more training iterations without overfitting, and more robust learners that can transfer better to other, similar time series. If you want to do all the 'hard work' for writing paper(s), there are a few approaches I have found that work fairly robustly.
i'd definitely be interested in the data generation you've done. we have struggled with that at my org
desert oar
right
 dawn lark
Does anyone know if there are any pretrained models for greyscale images? I'm working with pytorch and I prefer the speed from lower complexity than the information from greyscale as the images I have are all grey. Its going to be used for transfer learning and I am not too keen on building a model by myself
 primal wing
goooday, any where i can find infor for python for finance packages?
looking into financial modelling or supply/demand modelling
if i'm in the wrong section of discord, pls point me to the right direction ><
primal wing
thank you
 tacit vale
Hello, is anyone familiar with opencv? Specificly distance calculations using stereo cameras.
 small ore
 potent parrot
@light plover saw you asking for pyqtgraph experts, wouldn't count myself as an "expert" but I am one of the maintainers (also saw your post was from 6+ months ago)
@odd terrace saw your post on pyqtgraph taking a quarter of the space, that was a pyqtgraph bug that was recently fixed, if you install the current version from the dev branch it will work as expected (also I know this post is from a while back; I totally understand if you've moved on). For openGL graph also consider checking out vispy
 chrome rampart
Hello people, I want to start learning Machine Learning, is there any online course for it? I already know python syntax, and should I learn numpy, matplotlib, etc. first before trying machine learning?
odd terrace
@potent parrot Thanks for the notice. I didn't find anything easy and strong to display 4k height maps. I'm using three.js in a browser
 ancient thistle
@chrome rampart sentdex on YouTube has some good ML videos that you can follow
chrome rampart
@ancient thistle Thank you!
 simple ocean
Hi, don't know if this is the right place to ask but I'm having a bit of trouble understanding perceptrons/neural networks. From the reading I've done so far, apparently the process nodes should assign weights to all the links from the inputs, which determine how 'important' the input is in the node's decision to fire. What I don't get, though, is how we can get the 'target' output of the node so we can adjust the weights... if I have multiple inputs and outputs, how do I know that a process node should have or shouldn't have fired? Am I missing something?
 fervent mesa
hi all
desert oar
@simple ocean backpropagation
These things also make a lot more sense when you know the math underneath it
It's way less magical
A neural network is basically chaining several functions together
You minimize the loss of that big chained function using a technique called gradient descent
It so happens that when you run through the math of gradient descent, it has this elegant interpretation of forward and backward pass through a graph of nodes
silent swan
basically almost never think in terms of individual nodes in deep learning
it's sort of a holdover from its "neuroscience" "origin"
deep learning is basically modular differentiable function approximators
because it's differentiable you can learn via chain rule + gradient descent
supple ferry
Hey there all!
question of fraud detection. I have a toy dataset of various transactions which is anonymised. i have transactions made by 300 users, but some of them only did 1, and some did 4-5 transaction. What I want to do, is to reduce the sample size of the transactions belonging to some user 'a' if that user has more than 1 transaction, which in the end should give me exactly 300 rows of data.
How should I approach this problem?
one idea can be to use clustering, but i am not sure it may be much of use here. Anyone done something like that?
vestal pecan
maybe try fuzzy matching? to find close matching records, that might be detected as fraud?
"reads data forward and backwards to return a percentage indicating the degree of similarity between the matches. You’re able to quickly identify multiple similar records in as many as three character fields, revealing data entry errors, multiple similar entries or even potential fraud."
desert oar
@supple ferry thats going to be difficult depending on what metadata you do or do not have available -- why do you need/want to reduce the sample size?
supple ferry
I have several users which did 5+ transactions and I have some users who did just 1. I want to reduce the sample size to 1 per user. But mathematically
I was thinking about clustering
@void anvil then I wont be able to catch User specific behavior
@void anvil this is one of the methods I have on my list
Alongside with clustering
I kinda want one representative transaction per user
@void anvil, @desert oar I also hoped that you will answer here :) thank you
desert oar
@supple ferry without knowing the goal of this its hard to suggest a method
also its hard to know what you mean by anonymized
do you have a unique but "anonymous" user ID for each transaction? or is there no user ID at all?
desert oar
but each line is a transaction right
so what do you want to actually do with these users
characterize them somehow?
 acoustic scaffold
Are there any good libraries with which I can solve matrices easily?
supple ferry
@desert oar yes. My hypothesis is that non fraud transactions follow a certain distribution and it may differ slightly between users. That's why I try to represent multiple transactions by user A with just one derived transaction
desert oar
@acoustic scaffold numpy and scipy
@supple ferry you are trying to separate "users who commit fraud" from "users who do not commit fraud"?
desert oar
hm
@void anvil why the first transaction specifically?
that makes sense
@supple ferry do you have anything more specific in that hypothesis? do they differ in frequency, time between transactions, etc?
you might have to design some "features" and then cluster/segment on those features
acoustic scaffold
@desert oar I'm specifically looking for solutions for integer matrices
desert oar
right
in either case, there's no "general" clustering method here
the clustering part is the boring part tbh
come up w/ a distance metric and cluster on that
its developing features thats hard, and thats also dependent on domain knowledge and not really on math/stats
supple ferry
@desert oar I am thinking about mahalanobis distance. Because it takes also into account the covariance of two vectors
Unfortunately I don't have IP and or related metadata
 reef nimbus
Guys, what does axis in Pandas do? And how to use it?
desert oar
It's analogous to an axis in numpy
It's a way of specifying a "direction" for functions that are vectorized
 ancient bluff
I need help configuring a pycharm project with a virtual env i set up in anaconda
I'm sure I connected Pycharm to anaconda properly, and anaconda has all the packages i need
but when i tried to import keras in a project i created using the "existing interpreter" i kept getting an error
and i'm in extreme doubt about using a "new environment using virtualenv" because it doesn't seem connected to anaconda sooooo
wait a flipping second is the problem firstenvs isn't the active one with the asterisk?
silent swan
use existing interpreter
open an interpreter session
and check the .__file__ of some built-in library to make sure you're using the right interpreter
ancient bluff
@silent swan isn't this the problem
I tried switching the active environment to firstenv and i checked the packages and
from what it seems most of the packages I installed were actually in some other virtual env i made and not this one
so I'm guessing if i reinstall everything in this env it'll work?
 exotic cedar
how do u rename the column names in a pandas dataframe
slim fox
Stack Overflow
I've got a dataframe called data. How would I rename the only one column header? For example gdp to log(gdp)?
data =
y gdp cap
0 1 2 5
1 2 3 9
2 8 7 2
3 3 4 7...
obtuse skiff
How do you set your features for a DecisionTreeClassfifier from a dataframe in pyspark.
desert oar
usually for pyspark ml you have to collect all your features into a single vector column with VectorAssembler
im not sure if decision tree is different
@exotic cedar
data = pd.DataFrame({'a': [1,2,3], 'b': [4,5,6]})
data = data.rename(columns={'a': 'A'})
Eh i have no clue what's happenning
I made sure keras and matplotlib were in the virtualenv and i kind of made sense because there's no red line by the import statements above
I tried copypasting code from a website meant to display the mnist digits and this happened
desert oar
it looks like something went wrong while installing them
ancient bluff
Wryyy now I'm even more sad
 jade chasm
Im looking for help using solver in excel or an equivalent for solving linear equations like this one:
it is regarding solving such equations from diverse answers of respondents regarding a research paper in edge computing
I'm unable to figure out how to set it up in excel to analyse the data, if someone who is familiar with that could give me a hand that is much appreciated!
Ive tried recreating the example with solver in Excel, but it finds answers not corresponding with the example
exotic cedar
@desert oar thx
 restive fable
Hey guys I'm struggling with some pandas stuff that should be pretty simple but I can't figure it out?:
I have the following data set: https://docs.google.com/spreadsheets/d/1asCKDUDY6pJRSe8l6CAc8BTcgWUZVYcWAdujpeHZBeY/edit?usp=sharing
I'm trying to figure out how to make a data frame of number of teams by year and then make a line plot of the number of teams with year in x-axis. I feel like this shouldn't be difficult but I'm getting error after error. Would really appreciate some help.

Google Docs
baseball
Team,League,Year,RS,RA,W,OBP,SLG,BA,Playoffs,RankSeason,RankPlayoffs,G,OOBP,OSLG
ARI,NL,2012,734,688,81,0.328,0.418,0.259,0,162,0.317,0.415
ATL,NL,2012,700,600,94,0.32,0.389,0.247,1,4,5,162,0.306,0.378
BAL,AL,2012,712,705,93,0.311,0.417,0.247,1,5,4,162,0.315,0.403
B...
obtuse skiff
in pyspark dataframe
So I have datetime values in the Test2 column and Im trying to extract the integer value for the year
inputFrame = inputFrame.withColumn('year', inputFrame.Test2.year)
but getting this error: 'pyspark.sql.utils.AnalysisException: u"Can't extract value from Test2#11: need struct type but got timestamp;
what am I doing wrong and what can I do to fix it?
vestal pecan
hello, i m trying to manipulate a dataframe, but i m not able to detect blanks in columns
does anyone know how to fix this?
vestal pecan
fixed 🙂
desert oar
@obtuse skiff you'll probably need a UDF for that
Youre trying to use struct "syntax"
pyspark isnt smart enough to guess what you mean
Also IMO dot syntax for column access is bad practice in both pandas and pyspark
desert oar
I dont like the visual overlap with method names
slim fox
it hurts readability as well
desert oar
Imo method/attribute style hurts readability
By making it hard to visually distinguish what's an attribute and what is a column in the data frame
vestal pecan
So i did this filtering:
df = inspec_cp2[(inspec_cp2['ACTION']!='Not yet inspected') | (inspec_cp2['ACTION']!='No violations were recorded at the time of this inspection.')]
when i export it to csv, it is not filtered, it is all data together
 rugged hare
quick question: in numpy, is there a more elegant way of doing this pattern: A[ix,np.arange(len(ix))]? i.e. ix is an array specifying rows I'm interested in, and from the nth row I only care about the nth column value, so I get back an array the same size as ix.
vestal pecan
it worked when i separated both into two steps. why conditional filtering | or never works with me 😦
desert oar
@vestal pecan use .loc for clarity
df = inspec_cp2.loc[
    (inspec_cp2['ACTION'] != 'Not yet inspected') |
    (inspec_cp2['ACTION'] != 'No violations were recorded at the time of this inspection.')
]
no risk of confusing pandas w/ a column name
vestal pecan
ohhh thank you
I have another question
is it possible to extract data from such a column ?
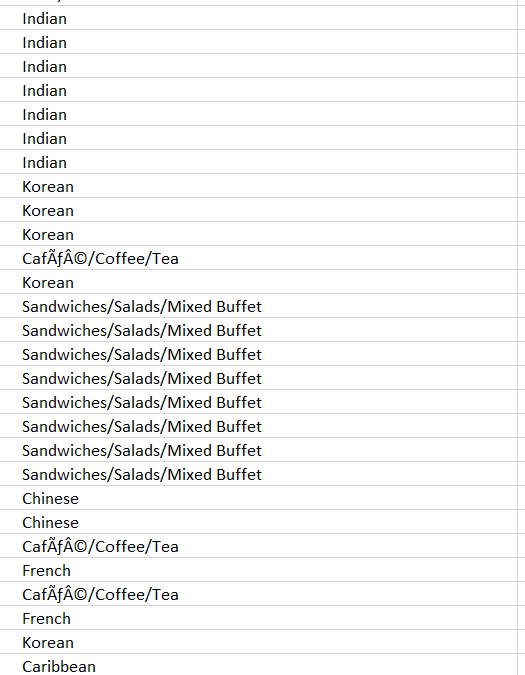 desert oar
@rugged hare that seems like the best way to do it, making good use of numpy "array indexing"
of course its possible @vestal pecan ... depends on what kind of data you need
vestal pecan
i have long list of restaurants, and each has a cuisine
some sell sandwiches..etc
i want to extract cuisines name and see what cuisine has the most restaurants
I thought maybe to have a list of all cusines, and try to grab the restaurant count into one of the cuisines name
or just extract the unique values of that column and count or groupby
rugged hare
@desert oar yes the problem was just that i was repeating that pattern many times so the arange(len(..)) (or range(len(..))) got a bit tiresome. and numpy has so many indexing tricks, figured there ought to be something that means "like : but actually interpret result as range(n) not slice(n)"
desert oar
looks like you have an encoding problem @vestal pecan
but that data looks fairly clean otherwise
can probably use as-is
vestal pecan
but some have multiple cuisines in one...
desert oar
@rugged hare it's just not a common operation
@vestal pecan does "Sandwiches" ever occur without "/Salads/Mixed Buffet" though?
you can split on "/" if you need to 🤷
i dont see the point in asking questions like "can i extract data"
its python, you can do anything
specify what it is that you actually want to do and ask targeted questions to that effect
vestal pecan
i made a groupby
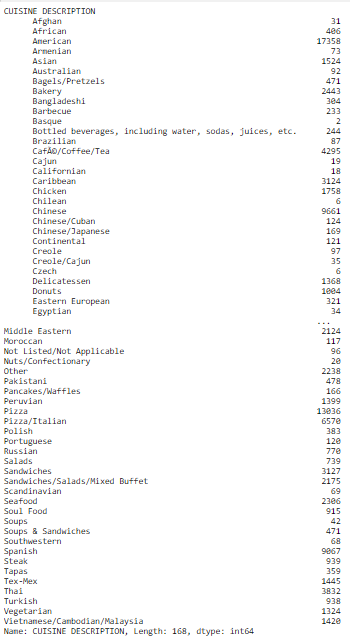
I know in python you can do anything you want, can you please refer me to tools that would help in data cleansing ? I know how to use regex a bit but it is not always enough
desert oar
"data cleansing" is too generic a task
if you ask specific questions you'll get specific answers
if you ask generic questions you probably won't get any answers
vestal pecan
Oh I see
barren bluff
Hey guys I have a new assignment in my machine learning class. But I was wondering, is the datacamp course worth checking out?
barren bluff
anyone who can tell me why I get the inverse of the data when plotting some example data?
from sklearn import datasets
import pandas as pd
import numpy as np
import matplotlib.pyplot as plt
from sklearn.decomposition import PCA
from sklearn.preprocessing import scale

#plt.style.use('ggplot')

np.random.seed(42)

digits = datasets.load_digits()

print(digits.data.shape)

data = scale(digits.data)

plt.gray()
plt.matshow(digits.images[0])
plt.show()