#data-science-and-ml
1 messages · Page 206 of 1
 surreal nacelle
 teal veldt
Hello folks, hope you're having a nice evening.
I wanted to ask about the best option for choropleths maps through Python, I was looking at Folium but it seems that it doesn't have a lot of functionality at the moment
Do you know about better options? Also, since I'm at it, is anyone aware about the existence of a dedicated Data Visualization Discord server?
 glass wyvern
Hello all! I have a question about plotting data which I hope fits here. I have a list of 3d point and some lines connecting these point. How would you go about in plotting them. Matplotlib was the first option but it's a bit too slow in displaying the points and lines. Is there anything a bit more efficient? I also tried plotly but the whole web interface is a bit too much. I want to see the data and move the POV a bit. Thanks!
 grizzled folio
@glass wyvern How many points/lines are you plotting? Matplotlib performance can vary a lot depending on how you're trying to do it
 muted garden
Hello,is this program related to ML field ? https://www.udacity.com/course/intro-to-self-driving-cars--nd113

This introductory program is the perfect way to start your journey.
 silent swan
isn't seaborn built on matplotlib
 desert oar
yes
 serene scaffold
@desert oar, scikit-crfsuite, yes.
 crude bloom
looking for honest impressions, does a deep learning library written in pure python (without numpy, even) sound more like an interesting gimmick or something a depraved mind would come up with?
asking for a friend...
 earnest prawn
if its for a learning experience (a very intense one) it is probably okay...if youre actually trying to do stuff with it youll soon, very soon notice the performance impacts of using pure python
crude bloom
yeah I'm already finding out how incredibly slow it is, it's only instantaneous for <100 parameters
half for learning, half for experimenting with something that I can't figure out how to do with pytorch/tensorflow
desert oar
it might work in pypy
should get a few x speedup at least... but ultimately no its not a good idea
it will be educational, but not useful beyond that
crude bloom
ya it's definitely been educational being up close and personal with weights, biases, gradients etc. thanks 😃
silent swan
funky fancy indexing with numpy breaks my brain 🙃 🙃 🙃
grizzled folio
hah, yup
 gilded notch
Anyone want to work on building a text-extraction suit? I can't seem to find a decent one that works on Windows. Even the one that works on Linux is a bit dogey
The idea is to extract text so it can be inputted into ElasticSearch. for further analysis
 silent root
@gilded notch extract text from? also it would be a better idea to get the project started, showcase it in #303934982764625920 and ask for contributors there
gilded notch
@silent root Thanks, I will do. I'm working on it now but its far from finished.
@silent root Oh and extract text from as much as possible, News Sites, Google, Wiki, PDF's, PTT, CSV, Excel, OCR for Images (PDF, GIF, JPEG etc) Also extract text from audio, Ideally in a way that dosent need any paywalls and any outside resources so no models that are not downlaodable.
silent swan
oh man I'm in such a coding high right now
translated some tedious matrix/prob manip code to numpy
then rewrote and cleaned up the logic to scale up to massive sizes in pytorch
and it works!
gilded notch
Nice, I'm always suspicious when I do something quite complicated and it just works. It makes me think there is a Run Time error that I just havent encountered yet.
silent swan
there's that old meme/comic
with two panes of the guy being kept awake at night
"My code doesn't work and I don't know why"
"My code works and I don't know why"
gilded notch
thats me
 quartz stream
Quick Question
%%time
from sklearn.naive_bayes import MultinomialNB
naive_bayes = MultinomialNB()
naive_bayes.fit(training_data1, y_train1)
naive_bayes.fit(training_data2, y_train2)
will this train the naive bayes on both training data1 and training data2
or will it get trained only on 2
Hmm looks like only training data 2 is getting trained
how do I do
if i wanna train on both
obviously training data 1 and 2 have different dimensions
gilded notch
@quartz stream you can't if they have different dimensions.
You can append them onto each other and then just null the dimensions your not using
gilded notch
yes they have to be the same shape.
desert oar
@quartz stream they need the same number of columns. also you can use .partial_fit() to incrementally train on 2 different data sets. only some models support that, however
 hollow quartz
I want to delete the multi index.
desert oar
@hollow quartz multi index in the columns?
what's the final data format you're going for?
hollow quartz
@desert oar i want to align Jour, Région, 00:00:00, 01:00:00,.....
desert oar
@hollow quartz what is the original format of the data and what did you use to put it in that format
quartz stream
Bro ! @desert oar
You are freaking awesome
This is the thing I was looking for
Spent almost 9 hours with no progress but a workaround
desert oar
@hollow quartz you can just re-assign to .columns
@hollow quartz can you show your whole code
desert oar
@hollow quartz write values='Total energie soutiree (Wh)' without the []
hollow quartz
it's working thanks @desert oar
 wind marlin
Hey guys when you were first starting learning ML what did you get stuck on the most?
desert oar
making sense of all the different tools and models available. it's easier nowadays imo than it was a few years ago, a lot of problems have a "best" solution now, whereas in the past you often had to guess and try a million different things
wind marlin
What are some best in the game tools for financial market predictions? I already build algorithms but I think they can assist AI. My algorithms aren't all time series based so that might be a challenge if I'm training the AI on tick data and indicator data correct? Would I be looking for a specific genre of ML for this purpose?
I figure I will need to find an easy way to port Ninjatrader indicators into Python.
That might involve converting C# code into Python. I don't know how doable that idea is though.
silent swan
We find that BERT was significantly undertrained, and can match or exceed the performance of every model published after it. gg
desert oar
yeah BERT is wild
silent swan
yea but this is saying "lol we pwned BERT six ways from sunday"
desert oar
which model was this
the msoft one?
i thought you meant someone just retrained bert w/ different parameters
silent swan
arXiv.org
Language model pretraining has led to significant performance gains but
careful comparison between different approaches is challenging. Training is
computationally expensive, often done on private...
the new hotness
depending on which msoft one you were talking about, that was based on fine-tuning BERT
now the two big contenders are XLNet (Google) and RoBERTa (Facebook)
desert oar
nice they replicated bert too
surreal nacelle
@wind marlin You could use tradingview, or simply pull the charts from your exchanges, and then use a library like TA-lib to calculate the indicators from there
desert oar
gotta love a good replication and SOTA result in one paper
silent swan
just gotta go look around for some spare v100s
maybe I got a couple hundred lying here or there
earnest prawn
with what APIs, API is just a shortcut for application programming interface
 swift karma
We'll I'd like to create an API so I can pull products from other peoples websites
Like an API with something like Magento.
swift karma
jinja2.exceptions.UndefinedError: 'form' is undefined
anyone know why I'm getting this error
quartz stream
Is it possible to load csv files
without loading it in memoru
like pandas use memory
but my csv is 3GB
silent swan
you can load csv files row by row
 supple ferry
@quartz stream you can load file in chunks. There is a parameter for that in load_csv
 lapis sequoia
Can you also use pandas to load csvs?
Sorry if that is wrong, I'm all new to this!
grizzled folio
I think that was the suggestion: https://pandas.pydata.org/pandas-docs/stable/user_guide/io.html#io-chunking
desert oar
pandas has a very fast and robust csv reader
i rcommend using it for csvs even if you dont want to do data analysis
pd.read_csv('mydata.csv').to_dict(orient='records')
that gives you a list of dicts, what could be better?
(obviously consider the cost of adding a large compiled dependency)
quartz stream
import pandas as pd

df_chunk = pd.read_csv(r'data.csv,chunksize =30000)

def chunk_preprocessing(chunk):
   #Find all the rows where it matches a particular company_id
  data = chunk.loc[lambda df: df.Company_ID == '123345', :]
  return data

%%time

chunk_list = []  # append each chunk df here

# Each chunk is in df format
for chunk in df_chunk:
    # perform data filtering
    chunk_filter = chunk_preprocessing(chunk)

    # Once the data filtering is done, append the chunk to list
    chunk_list.append(chunk_filter)

# concat the list into dataframe
df_concat = pd.concat(chunk_list)
It is taking around 5s to get entries
is there any better way than this
I'm thinking the way I select
is slow
desert oar
@quartz stream why use chunksize if you just concatenate everything anyway
that feature is for when you need streaming processing
i.e. you dont keep it all in memory
just delete chunksize= and process all at once
quartz stream
@desert oar It takes more time to load the csv
desert oar
you still have to load the whole csv
quartz stream
actually csv is of 6GB
quartz stream
yes
desert oar
what does the chunk processing do?
desert oar
because processing a 6 gb file is just going to be slow
quartz stream
so why load complete
desert oar
thats a lot of data. it will be slow
desert oar
but you can share your chunk_processing code and maybe it can be made faster
quartz stream
everything is there
see above
so the problem is I have 6GB needs to filter some rows and use the filtered output
if I load 6gb it will take time to load
plus memory usage
so i thought with chunksize I will atleast savememory usage
desert oar
you did the right thing
is there any better way than this
I'm thinking the way I select
is slow
my response: no, it's going to be slow no matter what. but maybe you can share yourchunk_processingcode and we could make it faster
quartz stream
def chunk_preprocessing(chunk):
  data = chunk.loc[lambda df: df.Company_ID == 'Z716683', :]
  return data
i also want company id to be provided by user
any way for that
like I am mentioning Company_ID explicity here
is there any way else
desert oar
not much you can do for that... have you considered using a streaming command line tool like XSV?
desert oar
im not sure if its faster
you have to try it and benchmark
pass in the company id as a function parameter
def chunk_preprocessing(chunk, company_id):
  return chunk.loc[chunk['Company_ID'] == company_id]
def chunk_preprocessing(chunk, id_colname, company_id):
  return chunk.loc[chunk[id_colname] == company_id]
yeah
I'm not at beginner level
Thanks !
😛
You Really Rock
BTW XSV doesnt exist for python @desert oar
quartz stream
@desert oar
✌ 😄
%%time
import dask.dataframe as dd
print(psutil.cpu_percent())
df = dd.read_csv('data.csv')
data = df.loc[df["Company_ID"] == "12341234"]
print(psutil.cpu_percent())
1.2
75.0
CPU times: user 37.8 ms, sys: 1.03 ms, total: 38.8 ms
Wall time: 43.6 ms
desert oar
oh nice
i was just using dask
didnt think about dask dataframe here
anyone ever get the "buffer source array is read-only" error in pandas + joblib?
it looks like pandas is trying to mutate itself while joblib is using a memmapped array
surreal nacelle
while loading something ?
desert oar
sorta. my code is basically this
    with joblib.parallel_backend('loky'):
        with Parallel(n_jobs=5, pre_dispatch=5, verbose=10) as parallel:
            results = parallel([
                delayed(do_fit_and_score)(k, p, model, x_trans, x, y, ix_train, ix_test, params)
                for p, params in enumerate(grid)
                for k, (ix_train, ix_test) in enumerate(splits)
            ])
joblib detects and automatically caches large matrices and data frames, and then read-only memmaps them in the worker processes
but something in my code is trying to mutate the underlying data
surreal nacelle
I'm afraid I can't help you 😄
desert oar
yeah np. if i figure out a workaround i'll post an update
might have to file a bug report w/ pandas
silent swan
sometimes pandas does some weird stuff under the hood
grizzled folio
joblib seems neat
maybe a more appropriate method than dask to do this outer-loop parallel?
desert oar
If you're operating on data frames I would use dask
Rather, operating on subsets of a very large data frame
Joblib is more of a general parallelism library
Basically an equivalent to multiprocessing
Except it does smart caching of its inputs
has a higher level API, and also can use different scheduler back ends
sklearn uses it internally in order to parallelize things like grid search
 tight sparrow
any tensorflow 2.0 users?
desert oar
tensorflow 2.0 noob here
tight sparrow
@desert oar sorry for the delay
so i figured out constants and placeholders are gone
what do i use instead?
u there dude?
or dudette?
???
desert oar
tf.Variable I think?
tight sparrow
tried and failed
desert oar
Share code?
desert oar
its easier if you write the code in discord or on a paste site like https://paste.pydis.com
im not sure what im looking at either
what are you trying to do
(im not going to pretend like the tf 2.0 docs are any good or that the api makes any sense)
but yeah placeholders are just gone
desert oar
i just wish you didnt have to dig to find that page
theres literally no API docs for 2.0
rather, no link to it
tight sparrow
well i found it earlier
i just didn't get it
one of those cases where i was looking at the forest instead of the trees
documentation is my kryptonite
IMO every documentation should be the vocab, a brief description and several examples of the process in action as simple as possible
    print('Operations with Placeholders')
    print('Addition:', np.add(x.numpy(),y.numpy()))
    print('Subtraction:', np.subtract(x.numpy(),y.numpy()))
    print('Multiplication:', np.multiply(x.numpy(),y.numpy()))
print('Division:', np.divide(x.numpy(),y.numpy()))```this is what i ended up doing
lapis sequoia
Anyone know of any good resources (like videos or websites) that kinda give you a guide to Tensor Flow?
grizzled folio
@desert oar re: joblib, my problem isn't really amenable to dask. I guess it would be nice for different tasks in parallel to share some data, but it's hard to come up with a reasonable way to do that. failing that, I am just looking for a way to parallelise the outer loop
(actually I use dask to build up a computation from temporary on-disk arrays)
quartz stream
@desert oar
Hey
remember the function you created yesterday for getting values
def chunk_preprocessing(chunk, id_colname, col_value):
  return chunk.loc[chunk[id_colname] == col_value]
what if i want multiple values of the same column
lapis sequoia
Anyone that could perhaps help me with LSTM implemeting in RL?
I am not sure how it would be implemented
The goal i am looking for is that the agent/rl network can "see" previous states with a rollback window of 10
however i can't get how it all works and the internet wasn't at much help yet aswel
i am using https://github.com/MorvanZhou/Reinforcement-learning-with-tensorflow/blob/master/contents/9_Deep_Deterministic_Policy_Gradient_DDPG/DDPG_update2.py as my main rl code

GitHub
Simple Reinforcement learning tutorials. Contribute to MorvanZhou/Reinforcement-learning-with-tensorflow development by creating an account on GitHub.
a direction of objective would be nice, if someone knows what you'd need to achieve such goal in RL? because i heard there are several methods to LSTM
desert oar
@quartz stream what do you mean?
 true badger
Hi all, a quick question regarding Python multiprocessing. I want to call a function, say print(x) on different cores and want to provide different x variables to each print call. How would this be done?
 native lark
@true badger well you could do this using the multiprocessing module, but my personal favourite is concurrent.futures
https://docs.python.org/3/library/concurrent.futures.html
true badger
Noob question, but why are there so many different libraries for this?
There's multiprocessing, threading, concurrent
What are the differences?
native lark
- there aren't many,
- threading and multiprocessing are the same thing, only one uses threads and the other processes
- it's a complex task, so there are different implementations
concurrent.futures is actually a high-level interface for multiprocessing/threading
native lark
threads run in the same process
if you want to know more, check out
https://medium.com/contentsquare-engineering-blog/multithreading-vs-multiprocessing-in-python-ece023ad55a
 silent swan
good illustration
 long jacinth
I made a package to transform lists in tables!
 gilded dagger
so
A friend tol me he was using Docker to set up his python environments for machine learning
He finds it easier to make a docker image that has all dependencies and use this to make sure his code can run on any machine
What do you guys think of it?
desert oar
id rather use a conda environment, but docker works i guess
seems like a pain in the ass to reconfigure if you want to install a new package, gotta tear down the container and rebuild/restart
gilded dagger
Docker has a conda environment already, https://hub.docker.com/r/continuumio/anaconda3/
You can just start from there
desert oar
why use both
gilded dagger
Portability? I have to run my code on Linux, Mac OS, and Windows regularly, and handling python environments is a bit of a mess
I'm trying to see what's the best to combine convenient dev and easy deployment
silent swan
I need to learn this docker biz
desert oar
yeah thats fair @gilded dagger
conda is somewhat portable too but it depends on a binary package being available
with windows 10 you can just docker up
im not sure why portability is that important for development
for reproducibility, i get
still seems like a pain for day-to-day
gilded dagger
I dev mainly on Mac OS tho
Well I code on Mac OS, run parsers on Linux, and run GPU based stuff on Windows
currently I manage my environments by hand pretty much
Which is maybe the dirtiest possible way?
I feel like working in Docker containers for everything should simplify it a great time, right?
desert oar
yeah
somewhat declarative config
you know actually
some kind of dockerfile generator
that would be interesting
so you can "install" packages by adding them to your dockerfile, then run some command to rebuild and restart the container in one shot
gilded dagger
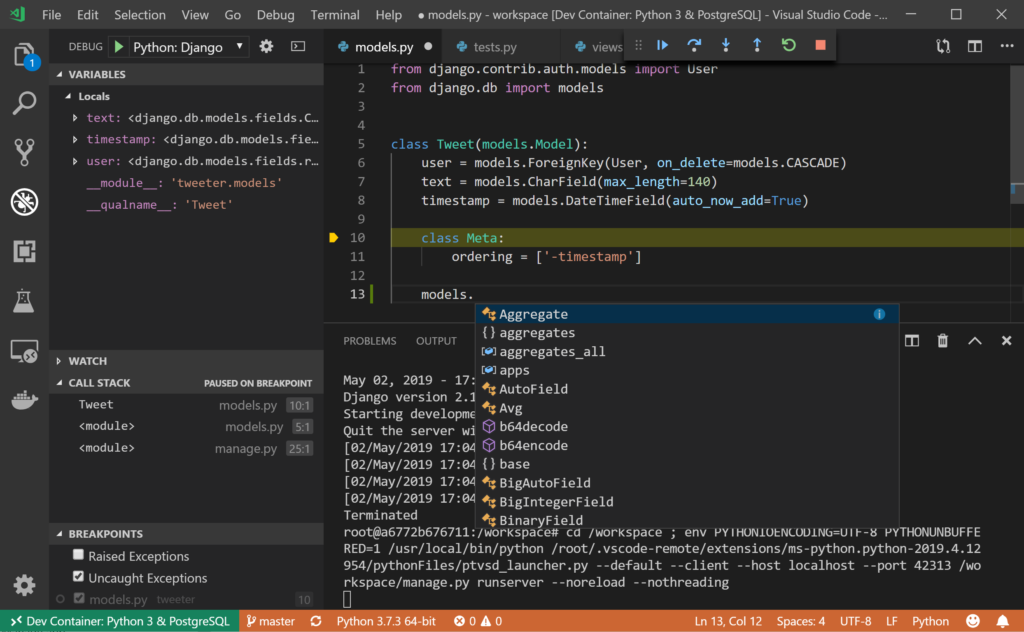
Python
Today at PyCon 2019, Microsoft’s Python and Visual Studio Code team announced remote development in Visual Studio Code, enabling Visual Studio Code developers to work in development setups where their code and tools are running remotely inside of docker containers, remote S...
like this?
(I'm actually searching around atm)
Looks like VS code has great integration of docker for development
desert oar
does docker have incremental builds?
gilded dagger
I mean if I have to re-build whenever I change dependencies and that's it it's not too bad tbh
desert oar
yeah and you probably shouldnt change deps that often
if you need to experiment use a virtualenv
then do actual dev and research work in a container
i dont hate that
easier to reproduce than trying to keep a lockfile version controlled
hollow quartz
I want to do linear regression but I have a nominal variable. Do I have to use OneHotEncoder or is StringIndexer sufficient? I use pyspark
 dense rose
How would I normalize values such that they lie on a logarithmic curve between 0 and 1?
Okay it seems that applying a log first and then just normalizing works pretty well.
 velvet compass
New article by Kirit Thadaka. 👀 Do the rewards of Data Science outweigh the risks? 🤔 What do you think?
https://www.kite.com/blog/python/future-of-data-science

Data scientists walk a fine line moving forward. Technological advances are often countered by specific concerns, like gender bias and privacy.
velvet compass
I did not (: my posts are more nuts-and-bolts
desert oar
this would be like in 1835 writing an article about the rewards and risks of chemistry
velvet compass
^^ That's a pretty darn good analogy!
silent swan
but salt, don't you know the singularity is just around the corner?
quartz stream
import pandas as pd
df = pd.read_csv('sample_data/california_housing_train.csv')
df = df.loc[]
what do I write if i wanna find multiple values
eg from longitude I want -114.56 and 114.57
and from latitude I want 33.69 and 32.76
i want all the columns of the original df to be displayed in new df
 wispy glacier
So I made a simple weight penalty mechanism on my neural network and each layer of nodes created each of these lines. Interesting, So I can mimic a linear neural network by using the same mechanism on all the layers.
surreal nacelle
Hey guys, I'm still a newbie, but I'd like to find an internship in the field in 2 months or so, (to start in 3-4), I looked at the offers online, and I feel like it gives me more than enough time to reach what the companies are looking for (for internship at least), but I'd like to build a little portfolio meanwhile, do you have some ideas about projects that wouldn't take too long to do, but have a decent weight on a resume ?
I was thinking about writing most of the basic algo from scratch, to show my understanding of them and of the maths behind, what do you think ? (maybe make a nice notebook for each algo or something like that)
Thanks 😃
desert oar
@quartz stream 1) its still unclear what youre asking, and 2) i am a volunteer and i can't help everyone with everything, nor should i be expected to
quartz stream
Lol
okay
def chunk_preprocessing(chunk, id_colname, col_value):
  if(len(col_value) == 1):
    return chunk.loc[chunk[id_colname] == col_value]

  else:

    for i in col_value:
      df2 = chunk.loc[chunk[id_colname] == col_value]
      df1 = pd.concat([df1,df2]).drop_duplicates().reset_index(drop=True)
    return df1

chunk_preprocessing(df,"latitude",[32.79,41.84])
I want something like this
@desert oar if user wants multiple values he can get the rows from single column
I only tagged you because you knew about the problem
native lark
@quartz stream i suggest you stop pinging individual helpers, "salt rock lamp" is not the only person that can help you
quartz stream
Alright !
Nevermind
got the answer
col_value = [32.82,41.75]
subsetDataFrame = df[(df['latitude'].isin(col_value))]
 royal mango
desert oar
royal mango
desert oar
most people
desert oar
if you already know programming, https://fast.ai is good if you want to get into deep learning right away
grizzled folio
Hmmph, I suppose just opening ~400 files over network-attached storage is going to take a while no matter what
 prime plover
anyone can recommend a good place to learn how to build AI and machine learning?
desert oar
@prime plover what is your background? math? programming?
lapis sequoia
Would you guys recommend the tensorflow library for getting started with AI and machine learning?
desert oar
i dont think the tensorflow new user experience is very good
probably stick with keras tbh
lapis sequoia
Okay thank you
desert oar
people tend to like pytorch although i havent used it much at all
lapis sequoia
What are the real differences between them all and why don’t you recommend tensorflow
desert oar
tensorflow 2.0 will be a lot saner, but tensorflow 1.0 was really complicated
and pardon my language but the docs were/are shit
all the information is technically there but good luck finding any of it when you need it
lapis sequoia
Okay
desert oar
@lapis sequoia that said, tensorflow is probably still more widely used, and i think a lot of new models come out in TF versions first
surreal nacelle
https://www.humblebundle.com/books/data-analysis-machine-learning-books?hmb_source=navbar&hmb_medium=product_tile&hmb_campaign=tile_index_4
Humble book bundle, bunch of really good o'reilly books for next to nothing 😃

Humble Bundle
Pay what you want for awesome ebooks and support charity!
silent swan
USE. PYTORCH.
(unless you need to build super-scalable stuff)
(like, really REALLY scalable stuff)
(like train on >8 separate machines type of stuff)
silent swan
even in terms of new models, that's not entirely true
models coming out of google, like 95% of them are in TF (conversely, 95% of facebook models come out in pytorch, but also google has a much, much larger research lab)
for more broad research though, I would estimate about 65% pytorch 35% TF, from what I've seen (not based on hard statistics)
researchers generally like pytorch more, unless they're doing something that really requires scale
(I'm aware of the overall project statistics of TF vs pytorch, but github projects =/= new research)
 fierce shadow
hey when I find the derivate of f(x) = x**2; the derivative turns out to be 2x. When I try to find the derivative of f'(x) = 2x; ;then again derivative comes 2x, however if I apply the power rule, it turns out to be 2. Am I making mistake here ?
def f(x):
return x*x
def derivative(x):
return (f(x+h)-f(x))/h
print (derivative(derivative(100)))
Output : 400.0010.... (cuz i took h as 0.001)
Whereas it should be coming 2 I guess..
desert oar
@fierce shadow try this:
def derivative(f, h=1e-7):
    def ff(x):
        return (f(x+h) - f(x)) / h

def square(x):
    return x**2

print(derivative(square)(4))
print(derivative(derivative(square))(4))
 quaint ruin
Hey, trying to use DecisionTreeClassifier from sklearn and I'm fitting my model and predicting result and then trying to get the accuray:
from sklearn import preprocessing
from sklearn.model_selection import train_test_split
from sklearn.tree import DecisionTreeClassifier, DecisionTreeRegressor
from sklearn.metrics import accuracy_score
from sklearn import tree

# some features are better using LabelEncoder like HouseStyle but the chance that they will affect
# the target LotFrontage are small so we just use HotEncoder and drop unwanted columns later
encoded_df = pd.get_dummies(train_df, prefix_sep="_", columns=['MSZoning', 'Street', 'Alley',
                                                       'LotShape', 'LandContour', 'Utilities',
                                                       'LotConfig', 'LandSlope', 'Neighborhood',
                                                       'Condition1', 'Condition2', 'BldgType', 'HouseStyle'])
encoded_df = encoded_df[['LotFrontage', 'LotArea', 'LotShape_IR1', 'LotShape_IR2', 'LotShape_IR3',
           'LotConfig_Corner', 'LotConfig_CulDSac', 'LotConfig_FR2', 'LotConfig_FR3', 'LotConfig_Inside']]

# imputate LotFrontage with the mean value (we saw low outliers ratio so we gonna use this)
encoded_df['LotFrontage'].fillna(encoded_df['LotFrontage'].mean(), inplace=True)
X = encoded_df.drop('LotFrontage', axis=1)
y = encoded_df['LotFrontage'].astype('int32')
X_train, X_test, y_train, y_test = train_test_split(X, y)
classifier = DecisionTreeRegressor()
classifier.fit(X_train, y_train)
y_pred = classifier.predict(X_test)
classifier.score(y_test, y_pred)
# print("Accuracy is: ", accuracy_score(y_test, y_pred) * 100)
but I get ValueError: Expected 2D array, got 1D array instead:
I'm not sure why y_pred or y_test needs to be 2D if anyone can clarify but I'm also getting this error after reshaping them with (-1, 1)
anyone got an idea?
silent swan
hm that doesn't sound right
both y_pred and y_test are 1D, and you're sure the error shows up on the last line?
quaint ruin
yes
I changed the score line to: classifier.score(y_test.values.reshape(-1, 1), y_pred)
because in the docs its says that the test sample shape needs to be shape = (n_samples, n_features)
so no I get y_test shape as (365, 1)
and now I get the following error:
ValueError: Number of features of the model must match the input. Model n_features is 9 and input n_features is 1
silent swan
It looks like you're misusing .score?
for .score you're supposed to supply X_test and y_test
it's a shorthand for predicting and computing accuracy in one step
 coral surge
anyone have the answer to this
coral surge
how so
silent swan
I would help, but don't we have rules re: homework/tests?
anyway, if we were to do elimination
one of those is not a supervised modeling method
one of those should not be used with only 1k examples
but the other two answers I can find some argument for either
so I don't like this question
coral surge
i dont like it either
grizzled folio
sigh there's no winning with parallelisation, is there? use threads and get killed by GIL locking, use processes and get killed by serialisation
silent swan
use GPUs, get killed by bank account
grizzled folio
GPUs aren't great at opening files...
silent swan
that's also true
grizzled folio
also not really, I have a decent GPU in my workstation, and access to batch GPUs otherwise 😉
how does the prun's ncalls column work? 3020684/828 for pickle.py:457(save)
ah, recursion
supple ferry
Hey there! Anyone knows alternatives to R t.test() in Python?? Scipy has it, but it does not support alternative hypothesis.
t.test(b$Sepal.Length, mu=5.6, alternative="greater")
you can do this in R, but not with Scipy
stats.ttest_1samp(df.sepal_length, popmean= 5.6, alternative = "greater")
TypeError: ttest_1samp() got an unexpected keyword argument 'alternative'
 random jasper
Sorry if this is not that correct channel, but does anyone have any experience in quadratic programming? Specifically the quadprog package? I'm trying to convert matlab to octave/python however there is one matlab function, "quadprog" that does not work directly in octave, and I am recieving buffer errors when trying to use the quadprog package in pythno
desert oar
it doesn't assume normality as such, but the student-t distribution is symmetric. so yes that works
supple ferry
@void anvil I am afraid I did not quite understand what you meant. Can you give maybe a code sample for that?
Scipy does test for two sided afaik, not less or greater.
So greater and less are just the same thing then? visible confusion it maybe because I worked today more than usual and brain refuses to process
desert oar
that said, if you have 1-sided test your alternative hypothesis is often a lot saner
the problem with NHST is that the null hypotheses aren't "fuzzy"
either you reject or you dont
im not sure what the solution is. but i havent read anything coherent or useful about making the null hypothesis itself "fuzzy", rather than fudging it by treating p-values in the Fisherian sense of weight-of-evidence-against-the-null, which just fails in large, low-noise samples
supple ferry
thanks for the clarification!
I am still digesting all these
can any of you explain me what this code does in the background ?
maybe i can understand better knowing the steps behind
t.test(a$Sepal.Length, mu = 5)

One Sample t-test

data:  a$Sepal.Length
t = 12.473, df = 149, p-value < 2.2e-16
alternative hypothesis: true mean is not equal to 5
95 percent confidence interval:
 5.709732 5.976934
sample estimates:
mean of x
 5.843333

t.test(a$Sepal.Length, mu = 5, alternative = 'greater')

    One Sample t-test

data:  a$Sepal.Length
t = 12.473, df = 149, p-value < 2.2e-16
alternative hypothesis: true mean is greater than 5
95 percent confidence interval:
 5.731427      Inf
sample estimates:
mean of x
 5.843333
So, I am using iris dataset and sepal_length as my test subject
@void anvil , tagging you because of the discussion above
@desert oar , if you can also help, that would be super
desert oar
R eh?
desert oar
well, do you know how a t test is done?
supple ferry
as alternative hypothesis being mean greater than 5
desert oar
more generally, do you know how hypothesis testing actually works?
desert oar
hypothesis tests work by constructing a test statistic with a known probability distribution
then estimating the distribution
and then finally computing the probability of the observed value of the test statistic
so you need to do the same:
- compute the test statistic
t - estimate the parameters of the correct probability distribution, in this case student-t
- compute the probabiilty of
T >= twhereTis distributed according to the student-t distribution you fitted in step 2
supple ferry
Okay. I will generalize what I understood from technical point of view
stats.ttest_1samp(data.sepal_length, popmean= 5.9)
Out[9]: Ttest_1sampResult(statistic=-0.8381239979992521, pvalue=0.40330353059421875)
Here my alternative hypothesis is that mean is not equal 5.9
if my alternative hypothesis was mean is less than 5.9
it would be 0.4033 / 2 = .2017
and if alternative hypothesis was mean is greater than 5.9
it would be 1 - 0.4033 / 2 = .7983
is it right ?
desert oar
scipy might have it
supple ferry
this was indeed scipy, but it only tests for alternative hypothesis != popmean
 solar torrent
Hey does anyone know how to go about extracting the first observation for each unique value in a column?
I've googled and looked through StackOverflow but nothing
I've thought about using drop_duplicates on the specified column, but I can't figure out if the function always retains the first value
nevermind, figured it out
grizzled folio
@solar torrent enlighten the rest of us?
solar torrent
I sorted by a time column as a new df, then pd.drop_duplicates specifying keep='first'
on a specified subset (which is the first arg of the drop_duplicates function)... so in this way you can get the first observation for each unique value
grizzled folio
nice one
surreal nacelle
Hey, I've been intensively learning maths for the past 2 weeks or so, and until then I aimed at being capable to solve every calculation by hand for linear algebra and calculus. I am now wondering if that is the good strategy to adopt. Do I really need to know how to do everything by hand ? Or is knowing what everything represents and when to use it what really matters in the context of machine learning/deep learning ? I feel like using wolfram alpha should be good enough if I know what to ask it 😄
I would add that I want to get a job in the field as soon as possible.
tight sparrow
anyone here playing with google colab?
Im trying to get my gpu to work with it
as you can see here its working in jupyter but not on colab
 tulip estuary
@tight sparrow Your GPU or Google's GPU?
tight sparrow
my gpu
tulip estuary
ah, never done that 😃 Just used theirs.
tight sparrow
i know i can use goggles in notebook settings but still no dice
my gpu is a 1070 i no longer game with so i might as well use it
tulip estuary
Got it. Can't help on that, I haven't tried using my local GPU (mostly because I don't have one 😃 )
tight sparrow

Stack Overflow
I am working with tensorflow 2.0 beta, and while i managed to get my GPU working on anaconda through a few youtube tutorials I am unable to get my gpu running in google colab. I know google has the
posted to stack
 olive robin
Can someone explain why you transpose W to x in the z = wTx + b equation?
Is this just a fancy way of applying/multiplying the weights to all the features?
silent swan
it depends on how the dimensions of the respective vector/matrices are set up
but roughly yes
good to always know the dimensions though
olive robin
What's happening from lines 20 - 75 in this code?

GitHub
A set of examples around pytorch in Vision, Text, Reinforcement Learning, etc. - pytorch/examples
what are all the parser.add_argument's doing?
grizzled folio
defining command line arguments, see the argparse library
solar torrent
does anyone know if you can customize jupyter notebooks so all of the columns of an output df shows up, even if you have to scroll?
I hate when it has these ellipsis in the middle of the df
solar torrent
@grizzled folio thank you soooooo much
solar torrent
hey can you guys help me conceptualize something real quick
I need to figure out the speed traveled, by comparing detections points and at the coordinates of different towers (imagine a bird flying and pinging different towers as it goes)
so I have this df...
I need to isolate, by tagID (first col) - when the detections change from being detected at one tower versus another (tower names in the second column)... so in this way I could calculate the distance traveled over a certain amount of time
but I'm stuck because one tagID can be hit by several different towers before it switches to another. I'm not sure where to go next or what sort of function I could use
btw the df is sorted by the time column
grizzled folio
"can be hit by several different towers before it switches to another" not sure what you mean by that
solar torrent
see rows 5 and 6 as an example - we see that the bird (by tagID) is detected by two different towers at that time (tower names and coordinate points change, shown in columns 2, 4-5 respectively)
does that make sense?
actually wait
see rows 3 and 4
sorry
I think I figured it out.
maybe I could drop_duplicates on the second column and keep the last values
why not drop duplicates by timestamp?
because some of the towers still give hits at the same location, even as a different time
the towers signify a change in place - so I need to observe difference over space
Ok next dilemma
how would I go about calculating speed by these matching tags...?
like throughout a whole df.
googling for functions now...
oooooh you meant sort by ID and time.... gotcha
grizzled folio
if I have an xarray DataArray, say with dimensions (T: 168, Y: 520, Xp1: 881), can I somehow drop all the data, and make it (T: 0, Y: 520, Xp1: 881) (or something to that effect). I think pandas indexing might be similar? -- I really just want to exploit xarray to get me metadata, and then put some different data in its place
maybe this is the wrong way to be doing this..
 frigid elk
what are the thoughts on DataQuest?
considering giving it a go just to build some foundations
 dreamy tartan
Hi,
I have a problem with the unbalanced dataset. I have labelled text data and im trying to do classification. The dataset has 3 label and labels are not equal to each other. (label 1: 2.3k, label 2: 1.2k, label 3: 0.5k) I can say results are fine for label 1 and 2 but label 3 is very bad in the confusion matrix. What can I do to improve the results?
 polar acorn
Depending on what you are using for classification you may be able to do something like sample so that the classes are evenly distributed across each batch or weighting class 3 higher.
Some quick googling gives me these two articles. They might provide a good starting point.
https://machinelearningmastery.com/tactics-to-combat-imbalanced-classes-in-your-machine-learning-dataset/
https://towardsdatascience.com/dealing-with-imbalanced-classes-in-machine-learning-d43d6fa19d2

Machine Learning Mastery
Has this happened to you? You are working on your dataset. You create a classification model and get 90% accuracy immediately. “Fantastic” you think. You dive a little deeper and discover that 90% of the data belongs to one class. Damn! This is an example of an imbalanced...
 dreamy tartan
Thank you. I will try to do sample if it wont work than i'll try to create synthetic data.
dreamy tartan
@void anvil i was thinking about it but i'll lose so much data in case of undersampling thats why oversampling can be solution for me maybe. Im searching about it.
desert oar
@dreamy tartan i've seen it done where you oversample and then undersample to reduce the size of the data set back to what you originally had
Also depending on the classifier you are using sometimes you can re-weight the loss function with class weights
Eg naive bayes and logistic regression can do that
dreamy tartan
I used SMOTE for over sampling and its looks like results are acceptable. Maybe i can improve the results with working on pre-processing section.
hollow quartz
Hi do you a library using to visualise decision tree from pyspark
 charred onyx
Hey guys should skip some machine learning concepts and learn deep learning or learn the entire thing.
desert oar
@charred onyx depends on what you want to achieve. if you are interested in computer vision, speech, etc. then yes you can skip stuff like gradient boosting and more advanced probability/stats and start learning deep learning (although you should 100% plan on covering the probability/stats material later)
olive robin
what does it mean to seed training?
desert oar
where did you see that phrase
olive robin
GitHub
A set of examples around pytorch in Vision, Text, Reinforcement Learning, etc. - pytorch/examples
line 80
olive robin
oh ok, thank you
silent swan
seeding does not slow down training
it's setting it to deterministic that does
basically there's a mode where CUDA forces its computations to be deterministic (same input = same output always), but that comes at a computational cost
important if you're numerically reproducing work, but not so important if you're just trying to train a model
olive robin
what does same input = same output mean?
silent swan
if you applied the same computation to the same inputs you will always get the same result
you may think "wait, why would applying the same computation ever lead to different results?"
one example (may not be the only case, but worth keeping in mind), is that GPUs essentially do parallel computation, and then combine the results
because of limited floating point precision, adding the same numbers in different orders can lead to different results
so CUDNN into deterministic mode would force the numbers to always be added in the same order, which makes it deterministic but is also slower
olive robin
ok so it's a method of making results more accurate?
silent swan
it's for exactly replicating results
there're different specific reasons for doing, e.g. debugging, comparing models, etc
I'd say that unless you know you need it to be deterministic, you don't need to worry about it
good to know that numerically your results may vary though
agreed for algorithm, not so much for academia imo
if you're getting within the same ballpark of results, people don't really care that it's numerically the same
if anything, being "robust" to initialization is seen as a plus, in some areas
polar acorn
I thought setting the seed was mostly about getting the same random initialisation in a deep model.
How much does the other sources of randomness influence the model?
silent swan
for common models, it should matter very little, but there're some models that are especially brittle
polar acorn
With dropout it might make a difference though.
silent swan
dropout is a separate thing, it's intended randomness
and that should also be controlled by the seed
polar acorn
Also if you're using mini batch or even SGD it will probably be significant.
silent swan
that would also be controlled by the seed
polar acorn
Of course. What I'm commenting in is that the first thing you mentioned when asked why to set the seed was randomness stemming from parallel computing. I would assume the initialisation and the batch sampling are adding significantly more randomness to training and those would be the first thing a beginner should think about when learning about setting the seed.
Though I haven't really done any testing to compare how much each of these sources contribute randomness to the training, so what do I know.
silent swan
ah, specifically I was commenting on "why does setting the seed it cause slowdown", which led to discussion of the non-seed randomness
good info going all around
 exotic cedar
is anyone familiar with colab
it seems to be having trouble recognizing my local gpu
olive robin
wait holy crap
you can just import the loss and optimization functions from torch?
You don't have to build anything yourself?
https://github.com/pytorch/examples/blob/master/imagenet/main.py#L168 ; lines 168 - 173
GitHub
A set of examples around pytorch in Vision, Text, Reinforcement Learning, etc. - pytorch/examples
exotic cedar
yes
all modern deep learning frameworks have that kind of implementation doe
criterion = nn.CrossEntropyLoss()

#create optimizer object
learning_rate = 0.01
optimizer = torch.optim.SGD(model.parameters(), lr=learning_rate, momentum=0.9)```something like that
polar acorn
lol work with whatever gets you where you want. Disregard fanboyism 🙃
silent swan
naw, fanboyism can be a great impetus for work
"you think language X is so great because it has lib Y? well I'm gonna port lib Y to my favorite language Z. take THAT."
polar acorn
Sure sure it might have it's use. But one shouldn't limit oneself by it needlessly.
exotic cedar
anyone used colab before :3
 tame merlin
o.o
solar torrent
I use colab all the time
 gaunt blade
Do I need math knowledge to use tensorflow for AI? 🙃
 sullen wing
well for machine learning algorithm, yes you need math
apart from that no you only need to python syntax
 eternal cargo
hey , does anyone knows about any package to detect emotion analysis from a text?
 wicked flare
http://www.nltk.org/howto/sentiment.html This perhaps?
eternal cargo
@wicked flare hey thanks for it. but it just gives us 3 basic emotions. i want more elaborate like joy,anger fear. like -ve emotion can be fear or anger.
wanted to classify that
wicked flare
That sounds like a very challenging problem.
lapis sequoia
Mobile legends
eternal cargo
okay, so now like i have to detect a text if its a question or a general text or some sort of order to someone. any idea how to detect that in a text?
polar acorn
You could gather a lot of labeled text find a pre-trained model and do some transfer learning. But if you're just getting into ml this might be a big project. Why are you doing this again? Is it for your own amusment/learning or are your trying to solve a real life problem?
polar acorn
I mean with enough time and strong enough will you could probably make something that does this (somewhat poorly probably) without an intro to ML. But if this is something you intend to use and it needs to fulfil some criteria then you should take some time to get the basics of ml down before or while you're doing this.
Or you could just slap together some regex based heuristics or whatever.
desert oar
@eternal cargo detecting if it's a question isn't a sentiment analysis task, but there probably some pre-trained models you can start with
spacy for example ships a model with part of speech detection
eternal cargo
@polar acorn okay cool . so basically i need to learn ML to deliver a somewhat accurate model for that
@desert oar like detecting a sentence , if its question or normal speech or just an order to someone. i've searched in spacy but didnt find any. can you help me with a link i guess?
desert oar
@eternal cargo spacy doesnt have it out of the box. but it has the ability to let you train a text classifier based on it https://spacy.io/usage/training#textcat

Training spaCy’s Statistical Models
spaCy is a free open-source library for Natural Language Processing in Python. It features NER, POS tagging, dependency parsing, word vectors and more.
so you can label a bunch of sentences and classify them accordingly
stanford corenlp might have something useful as well
there are also lots of "traditional" NLP or linguistics tools available:
https://stackoverflow.com/q/3573872/2954547
https://stackoverflow.com/q/4083060/2954547
Stack Overflow
Is there an open source Java library/algorithm for finding if a particular piece of text is a question or not?
I am working on a question answering system that needs to analyze if the text input b...
Stack Overflow
How can I detect if a search query is in the form of a question?
For example, a customer might search for "how do I track my order" (notice no question mark).
I'm guessing most direct questions w...
eternal cargo
wow. i think i have to start learning ML. its pretty great. thanks a lot btw
surreal nacelle
Hey, I'm working on implementing machine learning algos from scratch, and I'm currently doing linear regression, I'm using a formula from the course on multivariate calculus I followed on coursera, but I can't find the name of the thing! Does that speak to any of you guys ?
fierce shadow
Hey can anyone help me good course for machine learning ? I am learning it from scratch..
silent swan
that's your regression coefficient
desert oar
@surreal nacelle that's the ordinary least squares estimate of m
surreal nacelle
Thank you, the normal equation should give similar result right ?
tight sparrow
@surreal nacelle https://www.khanacademy.org/math/statistics-probability
https://www.youtube.com/watch?v=hQxRv8DOnts&list=PL2jykFOD1AWazz20_QRfESiJ2rthDF9-Z&index=32
https://www.youtube.com/watch?v=WUvTyaaNkzM&list=PLZHQObOWTQDMsr9K-rj53DwVRMYO3t5Yr
https://www.youtube.com/playlist?list=PLnvKubj2-I2LhIibS8TOGC42xsD3-liux

Khan Academy
Learn for free about math, art, computer programming, economics, physics, chemistry, biology, medicine, finance, history, and more. Khan Academy is a nonprofit with the mission of providing a free, world-class education for anyone, anywhere.

Mathematics for Machine Learning: Linear Algebra, Module 5 Eigenvalues and Eigenvectors Application to Data Problems To get certificate subscribe at: https:/...

What might it feel like to invent calculus? Brought to you by you: http://3b1b.co/eoc1-thanks Home page: https://www.3blue1brown.com/ In this first video of ...

oh and download this

Speed up, slow down, advance and rewind any HTML5 video with quick shortcuts.
surreal nacelle
Thank you for this, I actually followed the coursera LA and MC courses, and watched part of 3b1b serie, haven't done much statistics tho
desert oar
dont neglect stats too long
you can kinda fudge past it at first, but youll quickly start to feel very lost if you neglect it
surreal nacelle
The next course is on PCA, which I don't know anything about, is that stats ?
desert oar
that, or you wont feel lost, but you will start having problems and not understadnding the problems
PCA is a traditional stats technique. you can learn and understand it on a mechanical level without stats, but there is a statistical perspective to PCA that is useful to understand
surreal nacelle
Alright, just finished the two courses on coursera after 2 intensive weeks, thought I could allow myself to take a little break from mathematics 😄
desert oar
logistic regression is also a stats thing. it's a probability model, that's where the loss function comes from. you dont strictly need stats to understand logistic regression, but it will make more sense and you'll feel more empowered if you understand the stats behind it
fortunately there is a lot of stats that isn't "heavy math", it requires some basic algebra but there are some important concepts that aren't necessarily that complicated from a mathematical perspective
surreal nacelle
I remember liking stats in highschool
silent swan
stats is great
silent swan

Please help pandas by taking the 2019 User Survey! #pydata
 Twitter
polar acorn
Twitter
polar acorn
👍 answered.
silent swan
I'm gonna go in and suggest to deprecate access columns as attributes
wait
Pandas is capitalized wot
ok I'm assuming it's a mistake, everywhere else it's all lower case
desert oar
I mean, it's a proper noun. Stylizing the names of computer programs with lowercase is a 40 year meme that should probably go away
solar torrent
hey can someone tell me if there's a function available for this before I embark on trying to write a function
I'm trying to calculate the distance and speed through a succession of points
initially I set up the variables using this
df_over1['lon0'] = df_over1.groupby('motusTagID')['recvLon'].transform(lambda x: x.iat[0])
df_over1['t0'] = df_over1.groupby('motusTagID')['ts.h'].transform(lambda x: x.iat[0])```I'm trying to think of how I can iterate through them, but by ID... so then I can calculate the distance and speed in succession
it would helpful if I could do .apply like one a range of rows
but I've never seen code like that so I'm guessing there's another way or that I'm thinking about it wrong
maybe I could split all of the IDs into separate dfs
desert oar
@solar torrent what do you mean "in succession"?
you want to know the distance and travel time (implying speed) between successive pairs of points?
solar torrent
@desert oar meaning over a period of time, at each of the different locations
as it stands, my code just calculates it based on the original starting point
so I was thinking the solution has something to do with assigning the intermediate variables throughout "succession" (over time)... but I can't think of how I can extract a single value by groups since each of the IDs has a different number of rows... without breaking them out into different dataframes
desert oar
i still dont understand what you're trying to do
solar torrent
Ok one second
For each ID, I want to assign lat0,long0, and t0 - to each of their rows… essentially in this screenshot I’m trying to replace the values on the right with the values on the left (see colored boxes)… so when I calculate the distance across - I get different distances and speed throughout time, in succession
notice how the values for lat0,long0,th0 all match to the very first row
so... I'm asking how would I extract the individual values in this way, by groups
desert oar
so you want to calculate the distance between 18552 and 18553, for example?
solar torrent
yes
solar torrent
I've come across this
desert oar
yeah 1 sec
let me cook up an example
data = # your dataset

data['times'] = data['ts.h'].diff()  # assuming the column is already datetime and not a string

def great_circle_distance(coords):
    lon0, lat0, lon1, lat1 = coords
    return # i can't remember the formula off the top of my head

coords = data[['recvLon', 'recvLat']]
coords = coords.join(coords.shift(), rsuffix='_prev')
data['distances'] = coords.apply(great_circle_distance, axis=1, raw=True)
something like that @solar torrent ?
solar torrent
yes, that looks right! @desert oar
I'm gonna check out the .shift calls and "rsuffix" on .join... I'm not familiar
I've already got the Haversine formula for the coordinates and everything else. thanks a lot
desert oar
df = pd.DataFrame({'B': [0, 1, 2, None, 4]})
df['C'] = df['B'] + 100

print(df)
print(df.shift())
just for illustration
 heavy crow
Dont really know where else to post this, but it has something to do with science and data is involved haha
Im trying to create a multithreaded variant of the A* pathfinding algo.
And there are a few ways I can do that
But I think im doing it wrong in general.
I have been creating a thread for a function call and then letting it run.
But ofc the creation of the thread takes time and in the end its around 10x slower than the non threaded version
I have heard of worker pools etc and was hoping someone could explain that to me:)
Ping me please!
grizzled folio
@heavy crow what does the simplified pseudocode version of your algorithm look like? i.e. at what level are you multithreading the pathfinding?
lapis sequoia
Hi. I have some issues with training a deep learning model.
I'm doing binary classification on time series. The problem is that the accuracy (and loss) fluctuates a lot. It will go from 50% to 60% to 98% and then back down to 50% again, and just get stuck there.
lapis sequoia
There is only 1 feature
heavy crow
Its just normal A* @grizzled folio
And I was going to have a pool of workers all taking from the open heap
Its more of a question of how I am supposed to use threading
desert oar
The GIL will bite you here
That said a ThreadPoolExecutor is probably the best option. But again it probably won't make your code run any faster because of the global interpreter lock
Can use a ProcessPoolExecutor but then IPC might become a bottleneck
!d g concurrent.futures.ThreadPoolExecutor
 arctic wedgeBOT
class concurrent.futures.ThreadPoolExecutor(max_workers=None, thread_name_prefix='', initializer=None, initargs=())```An [`Executor`](#concurrent.futures.Executor "concurrent.futures.Executor") subclass that uses a pool of at most *max\_workers* threads to execute calls asynchronously.

*initializer* is an optional callable that is called at the start of each worker thread; *initargs* is a tuple of arguments passed to the initializer. Should *initializer* raise an exception, all currently pending jobs will raise a [`BrokenThreadPool`](#concurrent.futures.thread.BrokenThreadPool "concurrent.futures.thread.BrokenThreadPool"), as well as any attempt to submit more jobs to the pool.... [read more](https://docs.python.org/3.7/library/concurrent.futures.html#concurrent.futures.ThreadPoolExecutor)!d g multiprocessing.Pool
arctic wedgeBOT
Sorry, I could not find any documentation for multiprocessing.Pool.
desert oar
theres almost always a better way
if yo'ure looping over values, use .map
if yo'ure looping over columns use .apply on the dataframe
desert oar
why not just do that all in one function?
def process_column(y):
    y = y.copy()
    null_frac = y.isnull().mean()
    if null_frac > 0.3:
    # ...
    return y

df_processed = df.apply(process_column)
yeah something like that
df[i].isnull().values.any() can be just df[i].isnull().any()
 mossy dragon
O.o
 silk forge
import pandas as pd
from sklearn.feature_extraction.text import TfidfVectorizer
from sklearn.preprocessing import LabelEncoder
import numpy as np
from sklearn.naive_bayes import MultinomialNB
from sklearn.metrics import confusion_matrix , accuracy_score , recall_score , f1_score  , precision_score
from sklearn.model_selection import train_test_split

data =pd.read_csv(filepath_or_buffer="C:/Users/admin/Desktop/Artifcial intelligence/ML/data/Classifcation/SPAM/spam.csv" , encoding= "ISO-8859-1")
data = data.rename(columns ={"v1":"type" , "v2":"msg"})

x = data.msg


enc = LabelEncoder()
data.type = enc.fit_transform(data.type)
y = data.type
trainx , testx , trainy , testy = train_test_split(x , y , test_size=0.2 , random_state=8)

cv = TfidfVectorizer(min_df=1,stop_words='english')
trainx = cv.fit_transform(trainx)

testx = cv.transform(testx)

clf = MultinomialNB()
clf.fit(trainx,testx)

predy = clf.predict(testx)

print(predy)
C:\Users\admin\PycharmProjects\leaarning\venv\Scripts\python.exe "C:/Users/admin/PycharmProjects/leaarning/text class.py"
Traceback (most recent call last):
  File "C:/Users/admin/PycharmProjects/leaarning/text class.py", line 26, in <module>
    clf.fit(trainx,testx)
  File "C:\Users\admin\PycharmProjects\leaarning\venv\lib\site-packages\sklearn\naive_bayes.py", line 588, in fit
    X, y = check_X_y(X, y, 'csr')
  File "C:\Users\admin\PycharmProjects\leaarning\venv\lib\site-packages\sklearn\utils\validation.py", line 724, in check_X_y
    y = column_or_1d(y, warn=True)
  File "C:\Users\admin\PycharmProjects\leaarning\venv\lib\site-packages\sklearn\utils\validation.py", line 760, in column_or_1d
    raise ValueError("bad input shape {0}".format(shape))
ValueError: bad input shape (1115, 7458)
help
lapis sequoia
Probably, before your data be able to predict response, u have to correctly shape using reshape function maybe? idk .
 maiden phoenix
How does image recognition work? Is it just training a neural net to recognize similar images?
earnest prawn
The "just" and the "similar" part are the interesting things about it but yes more or less
@maiden phoenix
maiden phoenix
i meant in a nutshell, yes :P
thank you! it's starting to seem interesting to me. kinda surprised it took so long
earnest prawn
to be honest, image related stuff is one of the few areas where you have more than enough data to do cool stuff with it
maiden phoenix
such as checking if something is a hotdog or not
earnest prawn
in the end you're building a model whihc tries to output a probability distribution over several classes for your input or just give an answer to a yes or no question like you just asked how you build that model and how exactly its trained is the interesting part
silk forge
okay so i made this spam/ham classifier
import pandas as pd
from sklearn.feature_extraction.text import TfidfVectorizer
from sklearn.preprocessing import LabelEncoder
import numpy as np
from sklearn.naive_bayes import MultinomialNB
from sklearn.metrics import confusion_matrix , accuracy_score , recall_score , f1_score  , precision_score
from sklearn.model_selection import train_test_split

data =pd.read_csv(filepath_or_buffer="C:/Users/admin/Desktop/Artifcial intelligence/ML/data/Classifcation/SPAM/spam.csv" , encoding= "ISO-8859-1")
data = data.rename(columns ={"v1":"type" , "v2":"msg"})

x = data.msg
cv = TfidfVectorizer(min_df=1,stop_words='english')
x = cv.fit_transform(x.values).toarray()


enc = LabelEncoder()
data.type = enc.fit_transform(data.type)
y = data.type.values


trainx , testx , trainy , testy = train_test_split(x , y , test_size=0.2 , random_state=4)


clf = MultinomialNB()
clf.fit(trainx,trainy)

predy = clf.predict(testx)


cm = confusion_matrix(y_pred=predy , y_true=testy)
prec = precision_score(y_pred=predy,y_true=testy , average="micro")
rcl = recall_score(y_pred= predy , y_true=testy, average="micro")
f1 = f1_score(y_pred=predy,y_true=testy, average="micro")
print(f"confusion matrix \n \n {cm}")
print(f"precision_score : \n {prec}")
print(f"recall_score : \n {rcl}")
print(f"F1 score : \n {f1}")
all this seems to work fine
this is my output ```py
confusion matrix
[[941 0]
[ 37 137]]
precision_score :
0.9668161434977578
recall_score :
0.9668161434977578
F1 score :
0.9668161434977578
but now i want to predict a single message
so i defined a function that vectorizes functions and predicts it
def encodetext(message):
    msg= cv.transform(message)
    pred = clf.predict(msg)
    if pred != [0]:
        print("spam")
    else:
        print("ham")
encodetext(["FreeMsg Hey there darling it's been 3 week's now and no word back I'd like some fun you up for it still? Tb ok! XxX "])
but this function classifies every message as HAM
silk forge
nvm lol i figured it out
lapis sequoia
import android.app.Activity;
import android.widget.TextView;
import android.os.Bundle;```Python needs this
It does only import in-build functions
I'm too lazy for pip
That's why I use C#
THIS AIN'T DATA SCIENCE
 vapid wren
why are all weights adjusted during the learning process of a perceptron (w_new = w_old + (Y - y) * x)? Is it not enough to adjust the weight of the bias neuron (threshold value (theta [w0]))?
 verbal bison
Afternoon everyone, would anyone be able to provide/speak to a few Machine Learning terms I'm having difficulty finding definitions for?
earnest prawn
@verbal bison just ask instead of asking to ask
@vapid wren you're adjusting weights, or even have weights in a perceptron so you can build functions which have many many many paramters, your approach would just throw parameters away that doesn exactly make sense.
For example when trying to find a simple function for a line I doubt you can work with
f(x) = x + 2 * t
I'm quite sure you'd love to have a parameter before x as well wouldnt you?
(yes the t is supposed to be a metaphor for the weight of constant value of a bias neuron here)
 onyx moth
hello guys I want to learn machine learning from A - Z well with that I mean I want to learn from somewhere where they start at A and very basic. Where could I do that? Suggestions to a course/videos?
 torn musk

khan academy goes quite advanced and most of its courses are relevant: eg statistics calculus and linear algebra
but it also starts very basic
 quasi nacelle
Hi i am have a large dataset, and i wanted to do basic analysis first, it seems a bit overwhelming as it is now.
I have 4272, 104 #rows X columns and I would like to plot how the overall data is looking. so i could get a visual representation on which columns are missing the most data - any ideas?
torn musk
How to get this to output 64x64 images? https://pandas.pydata.org/pandas-docs/stable/reference/api/pandas.DataFrame.describe.html
 storm gate
Best way to replace an entire row in pandas with a new row by row index?
desert oar
@storm gate data.loc[row_index] = new_row
storm gate
matrix = pd.read_excel(path)
d_path = r'D:\AtomProjects\clean_genes\genes_by_index_dupes_with_avereages.txt'
dupes = ast.literal_eval(
    open(d_path, 'r').read())
for gene in dupes:
    matrix.loc(dupes[gene]['rows']) = dupes[gene][new_vals]
() vs []
desert oar
also what data type is dupes
storm gate
It is a dict but I call a list
desert oar
i see
also why in the world are you storing data as literal python code
if its a list of dicts wouldnt you just use json
storm gate
im storing it as text for now
storm gate
dude im new to this
desert oar
yeah definitely
if it's just dicts and lists of strings, numbers, Nones, etc
json is the way to go
storm gate
that and firebase
desert oar
what kind of backend
quasi nacelle
Hi there...In a dataframe I want to drop everything but columns that begin with MTX
df_MTX_time = [df.loc[:, df.columns.str.startswith('MTX')]
but I also want to keep the very first column called UID - can i do that in one line ?
quasi nacelle
or should I add the column after and if with .loc 0 ? or would that make further problems ??
please help me out
desert oar
option 1:
df_mtx = df[['UID', *df.columns.str.startswith('MTX').tolist()]]
option 2:
df_mtx = df.set_index('UID')[df.columns.str.startswith('MTX')]
@quasi nacelle ^
silent swan
oh snap, didn't realize you could do *args for indexing
desert oar
im not
['UID', *df.columns.str.startswith('MTX').tolist()] is a list
[['UID', *df.columns.str.startswith('MTX').tolist()]] is indexing with said list
@silent swan
silent swan
oh, I guess *args for creating the latter part of the list then
desert oar
yep
grizzled folio
Pandas and friends feel like they could be such powerful DSLs
desert oar
@grizzled folio pandas is heavily inspired by R, which is basically a statistics DSL
the whole concept of a data frame i think originates with R
grizzled folio
oh, that's true
it is nicer having a general programming language behind things, rather than R
desert oar
exactly. i think thats a big part of what pushed people away from R and towards Python/Pandas
grizzled folio
but also I interact mostly through the strange panda--ish abstraction of xarray
afaik R definitely doesn't do that
desert oar
in R you can have named rows, columns, etc
in arbitrary dimensions
but xarray is a lot more performant
R has data.table for big tabular datasets, but it has no equivalent of xarray for "lower level" performance
also multiple competing/incompatible sparse matrix implementations
grizzled folio
yes, none of that means anything without performance... lazy loading, dask integration, blahblahblah
desert oar
R really sucks for general scientific computing
grizzled folio
oh that's fun
yeah, I've heard that. if you're doing stats, primo, otherwise not so
grizzled folio
also has a pretty plotting grammar
desert oar
its a fun language to hack with
honestly, matplotlib gets you up and running faster
i used to love R plotting but i think matplotlib is way easier to deal with once you learn the data model
grizzled folio
matplotlib is more intuitive in most cases, but ggplot can do some very clever things
desert oar
ggplot is another story
its a gem, and the failure to replicate its success in Python is kind of confusing
the API is very un-R and something you could easily implement in Python
grizzled folio
but nobody has?
desert oar
matpltolib already has a grid-like system
there were some port attempts but afaik they all lost steam
at least one of them was commercially backed (y-hat)
(who also developed rodeo which was like a shitty version of rstudio or spyder)
grizzled folio
I find that somewhat surprising...then again the hard part is the actual plotting, not so much the grammar
desert oar
yeah
i think maybe because matplotlib is "easy enough"
eg. you can .groupby your dataframe and loop over it
python people are used to doing things with 50 key strokes when you could use 20
 vale hedge
Does anyone know how to figure out what libraries like BLAS I should use?
vale hedge
so i can run stuff like numpy faster
grizzled folio
@desert oar haha, true. and with lots of extra brackets, splats, etc.
vale hedge
i think they need binaries for doing Linear algebra etc
grizzled folio
I suppose you could compile numpy with a different BLAS implementation (I think our HPC uses MKL)
sullen wing
Hmm, did you try pypy out?
grizzled folio
intel distributes numpy build with MKL, I think?
desert oar
@vale hedge if youre using conda on an intel machine, the MKL version will be installed by default
sullen wing
It's pretty fast last time I give it a try
grizzled folio
I don't think numpy on pypy is as fast as cpython
desert oar
@sullen wing numpy passes everything off to BLAS anyway
vale hedge
oh im on AMD do i need to install something else?
sullen wing
Ah, rip
desert oar
@vale hedge it should probably detect that and install the openblas version which is noticeably slower
but still good enough for most cases
grizzled folio
are there no atlas versions?
desert oar
not prebuilt that i know of
@grizzled folio i think the issue with pypy is there's more overhead, so if you do a lot of matrix ops in a hot loop it's slower
bigger problem with pypy is zero cython support
which is fine obviously cause pypy itself is good for that
grizzled folio
yeah, I was thinking of the overhead. the native stuff is going to be the same regardless
vale hedge
what does cython support mean?
desert oar
but if you wanna do fast non-vectorized stuff on a numpy array with pypy idk how youd even do it
does numba work on pypy?
@vale hedge cython is a python-like language that compiles to a CPython C extension
grizzled folio
my intuition says no
are you actually doing heavy enough linear algebra that this matters?
desert oar
yeah looks like you need to hack numba to get it to work https://www.embecosm.com/2017/01/19/running-numba-on-pypy/

Embecosm
Summary Numba can be modified to run on PyPy with a set of small changes. With these changes, 91.5% of Numba tests pass. Execution speed appears to be similar to using Numba on CPython, with a smal…
vale hedge
oh default python is cpython and it compiles to C right?
desert oar
no
grizzled folio
default python is interpreted, but the interpreter is written in C
vale hedge
what are all the pyc files?
desert oar
they are CPython "bytecode"
vale hedge
oh ok
desert oar
cpython is a bytecode interpreter
vale hedge
so kind of like java?
desert oar
yes
except unlike java the VM isn't part of the spec
rather it's an implementation detail
@grizzled folio the biggest difference i noted between openblas and mkl was in SVD computation time
vale hedge
I see
vale hedge
how do you guys use numba?
desert oar
i dont really have a need for it
grizzled folio
I don't, I just make sure to write vectorised code most of the time
desert oar
but its for when you want to implement simple iterative algorithms using numpy arrays or python lists
eg you can probably implement something like Kmeans with it
stuff that doesn't vectorize well but does use uniformly typed numerical data in arrays
vale hedge
oh ok
grizzled folio
I wonder how it'd go on this particle advection problem...
desert oar
what is the problem
grizzled folio
rk4 advection of particles interpolated on a prescribed velocity field
we use it on ocean velocity data we generate offline for analyses
vale hedge
is advection same thing as convection?
grizzled folio
convection can be a subset of buoyancy-driven advection
but you can also get diffusive convection
desert oar
heh i dont know what any of that is. what computationally does it entail?
vale hedge
guessing its a huge matrix of numbers and you have to calculate differentials
grizzled folio
rk4 is just fancy integration, you could do forward euler like dx/dt = vt => x^{n+1} = x^n + v dt
so you just need to be able to interpolate velocity at an arbitrary position
(rk4 just adds the complexity that you interpolate in time too)
vale hedge
are you doing implicit or explicit methods?
grizzled folio
this is explicit, the velocity field is usually generated by a semi-implicit method so it's reasonably stable
vale hedge
what kind of numerical precision do you need?
grizzled folio
32-bit is usually fine, depending on how the velocity fields are staggered
vale hedge
what kind of objects are you modeling around and what are you doing for grid system
grizzled folio
what do you mean?
vale hedge
do you need to model fluid flow around islands or other objects?
grizzled folio
yeah, we'll use realistic ocean bathymetry in a lot of cases
vale hedge
oh have you done much numerical methods before?
do your velocity fields change over time?
would numpy work for this project?
grizzled folio
in this case, the velocity fields do change over time, but they're discrete snapshots. numpy alone wouldn't work, because it can't do the interpolation of velocity
I expect the advection alone could be vectorised over arrays of particle positions though
grizzled folio
non-vectorised python is insufferably slow
I guess the interpolation could be done in numba, then the rest would be straightforward
vale hedge
scipy might have runge kutta implementations
vale hedge
oh do you want to animate it in python too
onyx moth
What is the difference between labels and attributes? and what are labels exactly?
silent swan
what's the context of that question
onyx moth
@silent swan well I started on ML and they are talking about labels its not very clear what labels are. Are labels the unknown attribute?
silent swan
mm well might be clearer given more context
but likely
the goal of a standard beginner ML task is to "label" or "classify" something
so that's likely the variable/information you're trying to predict with a model
onyx moth
Linear regression only works with stuff which has a correlation with each other right?
I passed in some BTC/USDT data and it put out an accuracy of 0.99999 but you could in theorie also yourself take the open, close price and calculate the missing piece (the volume that is needed to move the price that much) yourself.
Then its more of an algo than a machine leaning? Or am I mistaken?
and with linear regression you cant predict the next days price right? (as you need to pass in all the other values and you dont have any of them)
 spark stag
u probably could if u have enough pints cuz it just calculates a gradient basically so if there is a direct relation between x and y then just put in the next value for x and u will (hopefully) get the next y value
its just drawing a line of best fit through the data assuming the variables are directly proportional
if u calculate gradient and intercept then u can predict future values
onyx moth
Bitcoins price and volume differ everyday. Can I without any data of tomorrow predict its price today? Im getting the feeling Linear regressionis used to fill in the blank when u have the rest. for example no one tells me what todays price is but I can let the code tell it to me by filling in the volume open, high and low price
spark stag
idk but if u want u can try use this and put in any numbers u got then use the prediction subroutines, just ask if u don't understand it
Data points is an array of points btw eg [[1, 3], [3, 2], [8, 6]]
 lavish agate
I'm just trying my first steps with machine learning / sklearn. I have a dataset with lots of categorical data (size, color etc. of a product) and sales as the meassure. How do you call it if I want to find out wich categories have a positive or negative correlation with sales?
so "color red has a [number] positive correlation with sales"
or... I don't know
spark stag
not 100% sure, but could u work out the average sales normally then the average sales with the chosen attributes to see if its higher or lower?
lavish agate
I guess that is the most logical but that is so normal and boring 😅
I think I try a correlation matrix and see if that's interessting
quasi nacelle
hi i have a dataframe and what to first (1) make a new df based on a row (patient) and several columns. (2) plot the normal distribution of that df. (3) can i automate it for 200 or more rows ?
desert oar
@onyx moth yes a regression model (or better yet, a time series regression model) would be the start of something like that
@quasi nacelle yes of course, you can use a for loop over .iterrows() or .itertuples() depending on what you need
@lavish agate correlation would give you basically the same answer.
there are two approaches here:
- one-hot-encode the data and take the correlation between each category column (of 1s and 0s) with sales
- one-hot-encode the data and fit a linear model with the 1s and 0s as features and sales as the target
method 2 lets you use a set of classical statistical techniques called ANOVA, but basically you're getting the same "directional" answer in both cases
@onyx moth how to approach that problem depends on what other data you have available
quasi nacelle
@desert oar thanks - sorry but could you help me .. i am really stuck ```df.SEX[df.SEX == 'Male'] = 1
df.SEX[df.SEX == 'Female'] = 2
plt.scatter(df.MTX36, df.MTX23,
c = (df.SEX), cmap="cool")
ax = plt.gca()
plt.colorbar(label="")
plt.xlabel("MTX36")
plt.ylabel("MTX23")````
i intended to convert string to int so i could use it in a color bar
quasi nacelle
okay - that s to bad
@desert oar can i color based on a cutoff value?
40 is red < is blue ?
lavish agate
@desert oar I did some googleing and tried to replicate it
onyx moth
@desert oar The only data I have is, open, close, high, low and volume but thats like todays data, I have nothing for tomorrow
desert oar
@quasi nacelle pandas has its own plotting routines. for a cutoff value you would have to make a separate bool column
lavish agate
so far it looks like this: http://dpaste.com/00YBKXM
desert oar
lavish agate

Medium
Exploring the uncharted territories where Perason's R no longer works
desert oar
df['thing_above40'] = df['thing'] > 40
df.plot.scatter('MTX36', 'MTX23', c='thing_above40')
@quasi nacelle
@lavish agate that's for correlation w/ the entire categorical feature. what i described is for individual categories. also that article is for association between two categoricals
that said it's a great article and thank you for sharing it
@onyx moth yes if you have that data going back a long time you can use linear regression. you can also consider an AR model where you use yesterdays bitcoin price to predict todays
lavish agate
I will look into it, thanks
swift karma
how would you describe computational problems to a five year old?
desert oar
what kind of computational problem
lavish agate
@desert oar so just that I understand the article right, the function cramers_v computes the correlation between two dimensions. now I would need to do that for each pair and put that in a table of some sort?
basically, how did he create this picuture:
desert oar
no thats specifically not what V does
 compact thistle
Hey guys, I'm not even sure if it's right to post it here. I'm doing my own personal project using Amazon Customer Reviews dataset (https://s3.amazonaws.com/amazon-reviews-pds/tsv/index.txt) from AWS public data registry.
It's a gigantic dataset divided in 53? product categories. If it helps when I parse it in pandas dataframe, it's gonna look like the attached.
What I want to do with this dataset basically is that I want to build a recommendation system. I'm not familiar with recommendation system but I find it interesting and thought I could probably build it with this massive dataset I have got.
I'm not sure if the dataset I have has enough features to build such. I'd like to hear what you guys think. Thanks!
silent swan
you probably could! (not like an amazing one, but good enough for a fun project)

Collaborative filtering (CF) is a technique used by recommender systems. Collaborative filtering has two senses, a narrow one and a more general one.In the newer, narrower sense, collaborative filtering is a method of making automatic predictions (filtering) about the interes...
compact thistle
@silent swan Thanks man, I'm just starting to read up what approaches they have with recommendation system building and I'm just checking my dataset if I have enough for inter-categorical(since there's 52 more) prediction. I believe collaborative filtering has to do with analyzing other customer's purchase patterns right?
 prisma verge
any good courses on basics for deep learning? preferably, not too much in depth and with less math stuff
i wanna get into it as a hobby and wanna find a way where i could dash into it on the basics, and when i get more experienced at math, get into it deeper maybe, haha
is http://fast.ai good perhaps?
Making neural nets uncool again
surreal nacelle
https://www.youtube.com/watch?v=Ul0Gilv5wvY
This is so cool

We present a real-time character control mechanism using a novel neural network architecture called a Phase-Functioned Neural Network. In this network struct...
prisma verge
thank you!
onyx moth
is reinforcement learning already like in the NN and deeplearning box or is it still just outside of that in the ML
if someone answers this plz @ me as im gonna go sleep now
earnest prawn
@onyx moth it's certainly not deep learning only, however most modern successes in that area are made using Deep learning, at the moment especially with LSTM based networks
desert oar
how would you go + or - then with no win or loss?
does the team win or lose as a group?
because then you can still implement MMR
+5 if you win (as a team), -5 if you lose (as a team)
i dont know of any literature on it though, would be curious
desert oar
so you need 2 scores then, right?
for matching players use euclidean distance on score "vector" maybe
would have to start tweaking relative scores a lot
how does it work in DND AL if someone is a dick
hm
i was asking about your case specifically though
what's this for?
yeah i feel like you end up with the same kind of +/- MMR/Elo system
but instead the size of the +/- is determined by the gap between your skill and your teammates' skill
whereas something like a personality score would be absolute increments
quartz stream
Any idea on how to get started with a voice authentication project
All I want is a python program which can detect a person based on voice
any kick start is appreciated 😛
hollow quartz
Hi, can I use postgressql in a datascience project?
polar acorn
Sure. Then again you could probably do a data science project with crayons and a piece of paper. So a better question might be if you should.
desert oar
Thats like asking if you can use timing belts to drive to the store
onyx moth
if I want to do reinforcement learning is qlearning the way to go? Or is there another way?