#data-science-and-ml
1 messages · Page 199 of 1
 deft harbor
 opaque vine
Anyone with pandas experience and willing to help out?
I've got a huge dataset, looks somewhat like this - and I don't have any clue on where to begin. I'd like to do some analysis on for example what are the most commons procedurecodes on an invoice IF invoice has X procedure code, etcetera. Anyone? 
Got 0 experience from pandas, let alone doing analysis with python, I can write some very basic stuff, but I can't seem to find any reasonable tutorials for what I want to do, perhaps I can't type the question well enough
 craggy geyser
Hi! I have a quite big sqlite database that has a timestamp column with Unix UTC timestamps with seconds resolution. I am creating a plotly-dash web application where I am using pandas to read from the database to a dataframe. I want to keep the timestamp column, but I also want a column for datetime. This is quite easy and fast for me, I do it like so:
import pandas as pd

# [...]

df["Date"] = pd.to_datetime(df["timestamp"], unit="s", utc=True)
df.Date = df.Date.dt.tz_convert(tz)
Where I also conver the timezone to the local timezone. But I've noticed that the plots in my dash applications operate a lot faster if the datetime column is represented as strings instead. So I do the following:
df.Date = df.Date.dt.strftime("%Y-%m-%d %H:%M%S")
But this operation is very slow for a large dataframe. Is there a faster method? It seems that df.Date.astype("str") is slightly faster, but not by a large margin, and the end format is also on another form than I'd like. Any help with this would be great 😃
@opaque vine For a brief introduction, I would reccommend checking out https://www.datacamp.com/community/tutorials/pandas-tutorial-dataframe-python 😃

DataCamp Community
Explore DataFrames in Python with this Pandas tutorial, from selecting, deleting or adding indices or columns to reshaping and formatting your data.
opaque vine
@craggy geyser yeah i suppose I'll need to, i've been going through different tutorials and or projects, but i'm guessing the stuff that i'm looking to do and solve with python are more advanced than the stuff that I find from tutorials etc. well got to keep on pounding through i suppose
craggy geyser
@opaque vine Sounds like you want to do some sort of apply https://pandas.pydata.org/pandas-docs/stable/reference/api/pandas.DataFrame.apply.html
or just filtering and then handling, like so:
df[df["Procedure code"] == "ALE01"]
but I don't know, it's not very clear to me exactly what you want to accomplish, and I'm not an expert either
opaque vine
tbh I don't even know what to call all the stuff that i'm looking to do, I can do a lot of my work in excel and/or powerbi, but i'd love to learn python
yeah i'll keep on browsing, cheers
 lapis sequoia
how can i make it in a pandas dataframe that when i add a new value the oldest one is getting removed? like i want to have a dataframe of 10 values and when i add a new one, the oldest get removed?
 supple ferry
@lapis sequoia is it going to be a big one?
You can do like
df = df.tail(10) every time you add some row.
Sorry from mobile it is not easy to format the code
This is just a quick workaround
lapis sequoia
what does that do @supple ferry
opaque vine
gives you the bottom 10, so I guess whenever you add a new row it goes to the bottom, and by using df.tail(10) it shows you the last 10
lapis sequoia
yeah but it should be removed so i don't end up with a huge dataframe
opaque vine
well given that whenever you append(?) new stuff to the dataframe it goes to the bottom, you should be able to drop the first row after?
Edit 27th Sept 2016: Added filtering using integer indexes There are 2 ways to remove rows in Python: 1. Removing rows by the row index 2. Removing rows that do not meet the desired criteria Here is the first 10 rows of the Iris dataset that will ...
im learning as we speak so take it with a grain of salt, but yeah you can always drop the first row like that
lapis sequoia
oke cool thanks
 olive willow
guys need help, I've a quite large dataset about Pokémon's an am preforming analysis on it.
but I don't know how to create a function to get the needed result
import csv
import operator
from pprint import pprint
with open(r'E:\CODING\code_projects\[DATA]\pokemon.csv', newline='') as f:
    f.readline()
    Total = sum(int(row[4]) for row in csv.reader(f))
    arg_Total = Total / 721
print(Total)
print(arg_Total)

strongest = []
with open(r'E:\CODING\code_projects\[DATA]\pokemon.csv', newline='') as f:
    f.readline()
    for row in csv.reader(f):
        if int(row[4]) > 600:
            if len(strongest) <= 11:
                strongest.append([row[1], row[4], row[2]])
            else:
                pass
    pprint(sorted(strongest, key=operator.itemgetter(1), reverse=True))
this is the current code
and output:
301339
417.94590846047157
[['Arceus', '720', 'Normal'],
 ['Mewtwo', '680', 'Psychic'],
 ['Lugia', '680', 'Psychic'],
 ['Ho-Oh', '680', 'Fire'],
 ['Rayquaza', '680', 'Dragon'],
 ['Dialga', '680', 'Steel'],
 ['Palkia', '680', 'Water'],
 ['Giratina', '680', 'Ghost'],
 ['Slaking', '670', 'Normal'],
 ['Kyogre', '670', 'Water'],
 ['Groudon', '670', 'Ground'],
 ['Regigigas', '670', 'Normal']]
the func I need is, you see the [0,3] index in the output in the list. It's a name, 'Normal'.
and for the others also
I want to group every Pokémon which has that type
there are in total 721 Pokémon's and I want to know which type is on average the strongest/best
but first I need to group them and idk how
lapis sequoia
seems like you're trying to sort by strongest?
read it as a dataframe
import pandas as pd
it'll be a lot easier
lapis sequoia
why
olive willow
idk he told that this is better
lapis sequoia
uhh
olive willow
yhh uuuhhh
lapis sequoia
no it's not.. what's your end goal
olive willow
I've 3 questions to answer
-What are the top 10 pokemons?
-Which Pokémon type is the best
lapis sequoia
df = pd.read_csv(file_name_here)
olive willow
-what makes the strong Pokémon's different from the weak ones, and has it to do with their type?
lapis sequoia
top 10 pokemon.. just sort the dataframe by the second column and limit to 10
olive willow
yh
lapis sequoia
for which pokemon type is best.. do group by and aggregate the second column and find the type with the highest aggregate
for the third question.. im not sure..
olive willow
yh I know what to do, but not how, so lemme dive into this
lapis sequoia
gl
olive willow
thanks!
 void anvil
Quick question about train sets. Do they always end up with 100% accuracy?
              precision    recall  f1-score   support

        -1.0       1.00      1.00      1.00     16593
         1.0       1.00      1.00      1.00     17145

   micro avg       1.00      1.00      1.00     33738
   macro avg       1.00      1.00      1.00     33738
weighted avg       1.00      1.00      1.00     33738
Assuming you don't choke prematurely
olive willow
mostly not, highest you could get is 99.9 but thats a fully trained
 desert oar
depends on the model and the problem
 karmic geyser
I'm not sure where this really fits, but I want to apply a bandpass filter to a continuous audio signal in python. Is there any good tutorials on implementing a bandpass filter in software? I tried using scipy.signal stuff but it doesn't seem to be working correctly, it seems to just be lowering the volume of everything rather then the frequency band I want..
 warm orbit
try https://plot.ly/python/fft-filters/#bandpass-filter or https://stackoverflow.com/questions/12093594/how-to-implement-band-pass-butterworth-filter-with-scipy-signal-butter ?
Learn how filter out the frequencies of a signal by using low-pass, high-pass and band-pass FFT filtering.

Stack Overflow
UPDATE:
I found a Scipy Recipe based in this question! So, for anyone interested, go straight to: Contents » Signal processing » Butterworth Bandpass
I'm having a hard time to achieve what seemed
karmic geyser
Yeah I used the 2 functions at the top. but it doesn't seem to be working.
of the first link you said before you removed comment
warm orbit
yeah i realized that was the same thing you said you tried already
karmic geyser
Yeah, I will try messing around with the stuff in those links again. pretty much I'm trying to get a stereo input split it into 5 channels, 2 being mid range, 2 being high frequency, and then 1 channel being a combined signal with a low pass filter for a subwoofer, then outputting it through the soundcard to speaker amplifiers.
I have done it all but the actual lowpass + highpass + bandpass part.
supple ferry
I have a dataset like this. Index ranges from 0 to 406907.
   individual  choice  pred_full  pred_base
0     9710535       0   0.002726   0.001284
1     9710535       0   0.003087   0.001897
2     9710535       0   0.002884   0.001778
3     9710535       0   0.005785   0.004427
4     9710535       0   0.004033   0.002241
5     9710535       0   0.003827   0.002918
6     9710535       0   0.003576   0.002734
7     9710535       0   0.060620   0.042998
8     9710535       0   0.032249   0.022193
9     9710535       0   0.002046   0.001186
I want to group this dataset by individual, but also have a second level index which ranges from 0 to the size of that group. How this can be done in Pandas??
individual   number choice  pred_full  pred_base
9710535            0   0   0.002726   0.001284
                              1    0   0.003087   0.001897
                              2   0   0.002884   0.001778
                              3   0   0.005785   0.004427
                              4   0   0.004033   0.002241
@supple ferry you can use .groupby(level=...) to group using an index instead of a column
desert oar
That's a good question
Probably not, but you can try it
If you need to turn an index into a column use .reset_index
supple ferry
if i reset the index, it will restore the grouped column
desert oar
@supple ferry which columns do you want to group on?
im confused
i thought they were both index columns
void anvil
@supple ferry df.sort_values([('Group1', 'Group2')], ascending=False)
index = pd.MultiIndex.from_tuples(tuples, names=['Group1', 'Group2'])
pd.MultiIndex.from_product(iterables, names=['Group1, 'Group2']
pd.MultiIndex.from_frame(df)
depends on how you want to set it up
desert oar
...i wouldnt do that
df = pd.DataFrame({
    'individual': ['a', 'a', 'a', 'a', 'b', 'b', 'b', 'b', 'c', 'c', 'c', 'c'],
    'x': np.arange(12) + np.arange(12)/12,
    'y': [-1.0, -1.0, -1.0, 4.0, 4.0, 4.0, 4.0, 5.0, 5.0, 5.0, 5.0, 6.0]
}).set_index('individual')

df.set_index('y', append=True) \
    .groupby(level=['individual', 'y']) \
    .agg({'x': np.mean})
@supple ferry ^ maybe that helps
supple ferry
@desert oar , thank you for the suggestion!
It does not quite produce what I intend to. What I want to have, also another column besides y which is just sows the indexes of y values per group, so, in this case, it will just repeate 0, 1 for every group:
this is the output I got with your help:
                         x
individual y
a          -1.0   1.083333
            4.0   3.250000
b           4.0   5.416667
            5.0   7.583333
c           5.0   9.750000
            6.0  11.916667
I guess I'm still not totally clear on what your data looks like then
You posted an example but it looks like there is more to your actual data than what you posted. Unless I misunderstand the example
supple ferry
I will come up with an example now
desert oar
Thanks, not trying to be obtuse or anything, it's just sometimes difficult to describe these things in words
supple ferry
   individual  choice      pred
0           a       1  0.246645
1           a       1  0.530894
2           a       0  0.751739
3           a       1  0.902380
4           a       1  0.096860
5           a       1  0.153920
6           b       1  0.653829
7           b       0  0.349955
8           b       0  0.407649
9           b       0  0.402111
10          c       0  0.532963
11          c       1  0.263130
12          d       0  0.564971
13          d       0  0.226155
14          d       1  0.090390
15          d       1  0.682873
16          d       0  0.078723
17          d       1  0.963183
18          d       1  0.068704
@desert oar , this is basically how my data looks like
I want the output to have the column individual as its index, but also second index which is like the index I have now, but starting from zero for every group
group - > every unique individual
desert oar
oh thats easier
def process_group(grp):
    grp = grp.reset_index(drop=True)
    grp.index.name = 'id_in_group'
    grp = grp.drop('individual', axis=1)  # drop 'individual' since this will be added as an index by the .groupby() operation
    return grp

mydata.groupby('individual').apply(process_group)
@supple ferry ok fixed up. try that ^
supple ferry
@desert oar , this is exactly what i wanted!
thank you!
can you explain me a bit your approach too ?
because I may do some similar but not identical things with my df
because for me it was difficult to build an approach to the problem
desert oar
yeah thats fair. pandas is a very big library
mydata.groupby() produces a sequence of dataframes, right?
(technically it produces a DataFrameGroupBy object but you dont need to care much about that)
so mydata.groupby(...).apply() accepts 1 argument, a callable. and that callable itself must accept 1 argument, which is the data frame corresponding to one group
so whatever you put in .apply() gets applied to each group one at a time
then they get concatenated back together
supple ferry
split-apply-combine
desert oar
precisely
so within each group, im doing this:
- reset index so that it's sequential within the group starting from 0 (this is kind of a trick, ill elaborate after)
- i set the index name just so it looks nice in printouts and can be easier to manage and keep track of
- i delete the "individual" column from the grouped data, because i know that the
groupbyoperation by default adds the grouping columns as an index
supple ferry
aply works with groupby objects exactly like it works with rows, yes.yes, the step 1 is crucial. i was thinking about setting multi index, but failed to do it with column and array
desert oar
the reset_index trick works like this:
- the default index for a dataframe is sequential starting at 0
- inside
.groupby, the original dataframe indexes are preserved - so if you just delete the original index with
.reset_index(drop=True), no index remains, so the default 0,1,... index is added; this is preserved in the result of the groupby.apply operation
cool
supple ferry
wow
nice
this is what I call 100% complete help
not only shows how, but also shows why
desert oar
i try 😃
pandas docs can be very dense. so i understand why these things are non-obvious
 woeful ether
test = pd.Series([0,1,"test",3])
test.append(pd.Series([4,5,6]))
Why does this not add to the Series?
supple ferry
@woeful ether , it works for me
In [29]: test = pd.Series([0,1,"test",3])^M
    ...: test.append(pd.Series([4,5,6]))
Out[29]:
0       0
1       1
2    test
3       3
0       4
1       5
2       6
dtype: object
wtf..
spent hours trying to add something to a series
and it doesnt work no matter what I do
how can it work for you and not me?
rage
 daring spindle
Are the keggle micro courses a good idea for starting?
After that doing some tournaments.
To practice.
olive willow
sure every kind of practice is good
desert oar
what's a micro course?
lapis sequoia
You guys are mostly discussing ML algorithms right, and how to implement them....?
desert oar
not necessarily, but that's on-topic here
lapis sequoia
I am just starting with machine learning, and I cannot understand shit what most of the doubts or messages are here..
People talking about topics I never heard of...
How long will it take to be familiar with all these topics?
 dense rose
You'll never be familiar with all of them tbh
desert oar
it takes a long time
better to focus on one or two things to start
and expand from there
a lot of learning new topics involves learning the math
so if you are good with math and know the basics, its easier to learn new things
olive willow
just a question I'm 14 and am going really fast into data science. but how the hell am I supposed to learn calc and gradient descent for example. For online courses? or ask my teacher
because I will have to learn it if I continue on my current pace of learning in like 1 to 2 years
to learn ML and neural networks
I'm extremely good in math but the vocab is the main problem and that I've to learn it on my own
any tips?
void anvil
@olive willow you're better off just treating it as a black box for now. Learn vocabulary related to the models and their use and ignore the math for a bit.
void anvil
[0,1,2,3]
olive willow
just a list
void anvil
a vector is a quantity with a magnitude and direction
olive willow
how would you write a 2d vector, just two list inside one?
 lean ledge
@olive willow you can learn all the fundamental maths through Khan academy and MIT OCW
desert oar
"take your time" @olive willow 😃
 stoic beacon
I'm stuck. I'm starting to get into ML and I have a work related dataset that I'm trying to do a basic linear regression on. My plot won't work because x and y aren't the same size because one is 2d and one is 1d. This makes sense. But then I'm not sure how best to plot my data. I'm trying to predict the number of cases by the day of the week and date (or days since the start date - I had to use this to make the date into some numeric value). My code is here (sorry for no actual code). If you can provide me with any information that will help like what graph I should use or any other helpful info I'd really appreciate it. My brain is dead from trying to grasp all of this

GitHub
Contribute to Tyr4el/CasesLinearRegressionML development by creating an account on GitHub.
If you do help, can you just @ me please? I'm away from my PC and won't be able to readily read what you post and it may be hours later or tmrw
 mossy dragon
@stoic beacon So you are saying your regression won't work because you have two explanatory variables? That shouldn't be a problem if you are doing multiple linear regression.
I'm also not sure why your scaling the data; It doesn't seem necessary to me in this case. (Although I'm not familiar with regression in python so someone else please chime in if im wrong!)
olive willow
guys do you need Quadratic algebra for data science?
mossy dragon
wat
olive willow
this, one sec
mossy dragon
data scientist is a really big umbrella term
you need to find out specifically what you want to do so you can figure out what you need to learn
 foggy sky
You guys have worked with Kalman Filters?
olive willow
mostly analysis and ML/deep
so not the last two
so mostly data science analytics
but what's the diffrence between a data analyst and data scientist
there're not the same
foggy sky
So, you have work with kalman filters?😂
olive willow
me no dude sry
foggy sky
Well kalman filters it's a statistical method that works well when sensors fail... reduce noises basically
olive willow
so it compares the new sensor log and if it's way different than the previous ones, the new log gets adjusted ?
something like that
foggy sky
Something like that... but its predict online and offline... so it will work even if the sensor are not working for a small period of time
foggy sky
Yeah, but I'm trying to predict bus arrival time with it using a library on python called pykalman...
foggy sky
No, I can import pykalman... it have the functions that I need
olive willow
oohh sure, ahhaha
foggy sky
But I really don't understand how to use it 😂
olive willow
isn't it better to create a ML program to predict the upcoming time?
\
mossy dragon
what are you trying to use it for
olive willow
he wants to predict a bus arrival time using pykalman
foggy sky
I'm using big data
foggy sky
So... have some GB of data XD
olive willow
yh hahahah
foggy sky
Yeah, csv
olive willow
I bet from Kaggel
it would be easier using ML I think but aren't there any yt tutorials about pykalman?
foggy sky
XD
lean ledge
@foggy sky I've worked with Kalman filters
What about em?
Kalman filters are about state estimation for processes with linear dynamics with Gaussian noise. You'll have to talk me what the state in your bus system would be and how you plan on figuring out system dynamics
foggy sky
I already have the data ready
I already have the data ready
But I don't know how to use the function in pykalman
@@lean ledge
What do you use to create the kalman filter?
I really don't know to much about it... that's why I'm asking for some help😂
lean ledge
@mossy dragon Yes. I am on a lot of servers
@foggy sky to create the Kalman filter, you need a model of the system dynamics
mossy dragon
i thought you were in the data science or the statistics server but i guess not
wierd im 100% sure i met you somewhere else
mossy dragon
O
foggy sky
@lean ledge but, what library or in what language did you create it?
lean ledge
It doesn't really matter, all of them will do the same thing mathematically
foggy sky
😂 right now I'm looking for the easiest one XD
lean ledge
They'll all basically require the same things
4 or so matrices
With some options here and there
foggy sky
I got the measurements matrix
But how do I get the other ones?
I have to create them for my one?? Or what?
Own**
lean ledge
@foggy sky that's why I keep saying you need a model of the system. You need to either calculate (not possible here) or learn the parameters for the state transition matrix
Given you don't have any control over the bus, you can leave the control input matrix a zero matrix
lean ledge
Might just be able to sort of guess an approximate state transition matrix based on data
foggy sky
Where I can more about it?
lean ledge
I have a feeling this is an XY problem. Why are you trying to use a Kalman filter?
Kalman filters (along with things like particle filters) are for dynamical systems
And it's for state estimation under noise
I don't think that's quite what you're using it for
foggy sky
This has been done before... using prediction models with kalman filters will give you better results...
lean ledge
You can't use anything with anything
As I said
Kalman filters are for linear dynamical systems undergoing Gaussian noise
It gives better results on things that match that description
You can't expect to jam in any model anywhere. You may be able to apply another Bayesian filter model on your problem but not Kalman filtering unless it fits that description
foggy sky
Ok... Thanks bro...
lapis sequoia
well young padawan.. for that we need to go back and understand what vectors are..

Towards Data Science
I remember a feeling of utter confusion when I first learned vector spaces in my first course of Linear Algebra. What’s a space? And what…
olive willow
I know what it is my obiwan... it's a place far far far from home with only one set of coordinates corresponding to it
you can add them together if you would want to do it
@lapis sequoia
olive willow
sure np
it has a purpose in life, a direction and a length
but how do we represent a vector in programming, just a list?? what is it good for?
what applications in programming and data science does it have
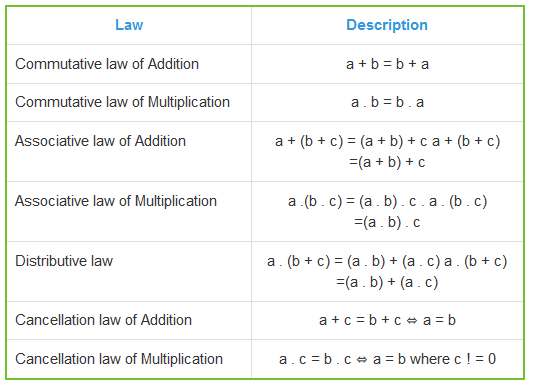
All the elements are associative, commutative, and scalars are distributive with respect to element addition
what does this mean?
and:
There’s an element in the set such that adding it to any other element doesn’t change its value
can you gimme an example of this?
and of this There’s some number (called a scalar) such that multiplying it by any other element doesn’t change the element’s value
lapis sequoia
 lapis sequoia
these illustrations will help you understand these properties better
Tutorial on vector algebra for 3D computer graphics. Highly interactive.
stoic beacon
@mossy dragon I wasn't doing multiple linear...lol. Where can I find the docs on multiple linear in sklearn? And yeah I won't scale it. I wasn't sure either
But I did think I needed to because one of my variables does get pretty large in comparison to the others
mossy dragon
if your using more than one explanatory variable you want to use multiple linear regression
stoic beacon
In the thousands while the others are 0-4 and in the hundreds
mossy dragon
you should look at the distribution first I think
if its super skewed it might be a problem
olive willow
thanks @lapis sequoia
stoic beacon
Against the number of cases
Looked like this
Can sklearn do multiple linear regression?
I can't seem to find anything on their site
Ah statsmodels seems to do it
mossy dragon
yea no i dont think your gonna get good results if thats what your data looks like
stoic beacon
I was advised to do linear first to just get a baseline
Then go from there
But if you suggest something different then that's fine
stoic beacon
Predict the number of cases per day (Monday to Friday)
I was told time series would work but I had a hard time installing prophet and idk if I'd be able to install it at work
stoic beacon
Just number of cases
Cases = tickets
I'm in tech support
Uhhh 2012
Though you can see that around that time there weren't many cases per day
0-4 maybe
lapis sequoia
well you can't use that then
stoic beacon
Why
lapis sequoia
it's not relevant.. there's no related pattern
lapis sequoia
you can use https://colab.research.google.com

for prophet
it's free.. and prophet comes installed
the data isn't that big, so this should do.. with the free runtime
stoic beacon
Gatcha
Is time series the only thing I could use in this case?
The only model that would work
I wonder what other data I could get that I can use ML on lol
From work
I have access to a lot of reports lol
lapis sequoia
depends what type of data it is..
this is historical data.. so time series for projections.. yes
stoic beacon
Alrighty. I'll give that a shot for this
Is time series considered ML or statistical analysis?
lapis sequoia
ML is statistics..
lapis sequoia
time series is more stats related.. but you can just say time series forecasting
stoic beacon
Fair enough. I'll try using that colab thing then
That should work
And I'll think of other things I could use ML for
olive willow
guys so if were talking about a 'real coordinate space' it has to be inside a tuple in python
it is a d2 array, the R2
stoic beacon
Ignore me
olive willow
sure haha
stoic beacon
A tuple can contain as many things as you wsnt
stoic beacon
I wasn't done with my thought lol. I was driving
olive willow
sure
lapis sequoia
I think you shouldn't be typing while driving..
stoic beacon
Prob
olive willow
guys so if were talking about a '2 dimensional real coordinate space' it has to be inside a tuple in python like this ([3,4], [4,3])
stoic beacon
Anyway @lapis sequoia @mossy dragon thanks for the help. Im probably a little rusty on stats. Only had a basic class in college
Don't have much free time nowadays but I'll do what I can
lapis sequoia
it doesn't take long to brush up.. I think there's free courses on udacity
with illustrations

freeCodeCamp.org News
by David Venturi
If you want to learn Data Science, take a few of these statistics classes
Image credit [http://www.123rf.com/profile_pixelsaway]A year ago, I was a
numbers geek with no coding background. After trying an online programming
course, I was so inspired that I en...
stoic beacon
Things like mean, STD dev, etc are still mostly fresh
lapis sequoia
yep that's where you start..
then there's statistical tests and stuff..
but there's a diagram ... wait
Stats tests
stoic beacon
Yeah I'm rusty on the basic ones
 proven crater
I think the [1, 1, 1] on its own is 1D
 earnest prawn
a 1d matreix would be a vector and this is clearly 2D as its a list of lists
so it is just a normal matrix
olive willow
ooohh yh sure but isn't a vector also 2d??
like [4,2]
it has a place on the x and the y asis
or am I seeing it wrong
earnest prawn
thats just a vector which happens to contain two values
it is still one dimensional
olive willow
but this would be two: ``` [[4,2],[7,5]]
the dimensions when talking about an n dimensional matrices refer to the list in list count not how many values the list contain
so a list in a list in a list is 3D
a list in a list is 2D
and a list is 1D (aka a vector)
olive willow
oohh sure thanks now I understand it
I was looking at it form a math perspective
IRL
earnest prawn
from a math perspective a matrix is still 2D and a vector is 1D
but a vector can indicate a point or something else in a 3D space if it has three values
olive willow
but if it has two values, the vector is still 1d
earnest prawn
yes
olive willow
but the values in the vector are 2d or 3d
earnest prawn
that could be a way to express it but dont nail me down on how exactly that is defined
earnest prawn
well vectors can represent lots of things like for example velocities or forces in games or physics simulations etc
olive willow
they're just datatypes?
earnest prawn
and matrices...well they have a million use cases in almost every area
olive willow
so they're just datatypes used to store other datatypes
like lists
and you can make a matrix multidimensional
earnest prawn
no a matrix is by definition a list of lists
matrices are per definition 2D
not less not more
yes but thats not a matrix anymore
olive willow
what's is it called then?
earnest prawn
thatd be a tensor
olive willow
and a tensor is a 3 or more dimensional datatype
earnest prawn
a tensor can be 1-n d
earnest prawn
i am not really into tensors but Id argue its just a special case
olive willow
sure
but if I would make a 3d graph I would use a tensor to store the x,y and z asis values
and a 2d a matrix that stores the x and y asis values
earnest prawn
you can just use a matrix for 3D graphs
matrix[x][y] = z
well thatd be a pretty bad way as you could only have natural numbers for x and y
so if youd want it more precise yes youd have to use something with more dimensions
olive willow
ok thanks @earnest prawn for the help!
and a pandas dataframe, has no dimensions right>?
and a vector can only have real numbers not even vars
?
earnest prawn
so for the pandas part i dont know really I never did pandas
and I definitely can have variables inside my vectors
earnest prawn
if you are trying to exclude the possibility that there is a complex number inside a vector I cant answer that question with any certainty because Ive never looked into complex numbers
but my first intuition would be that a complex number inside a vector would be fine
olive willow
dude I'm 14, I'm just trying to understand what you can use a vector for and also a matrix, tensor. and what can they store
earnest prawn
ohhh
earnest prawn
well you can use vectors matrices and tensors to store any numeric data you want
earnest prawn
well it can also have complex numbers I think
and yes numpy is a lib for n dimensional arrays and their manipulation
earnest prawn
complex numbers are something you dont have to understand
olive willow
but can I have an example, just to know that it's a complex number
to know that it's one when I see one
earnest prawn
the relevant part about complex numbers is that we have sqrt(-1)
olive willow
exactly that or also a different one
earnest prawn
anyways I doubt you will see any complex numbers for at least the next 4 years of your live
and no (-1)^2 would be 1, the thing about complex numbers is that they break the rule that you cant have something negative under the sqrt
earnest prawn
yes and the spceial thing about complex numbers is that they allow it
earnest prawn
i dont exactly get the transition here but yes
earnest prawn
yes
olive willow
calculus, statistics and linear algebra
olive willow
sure hahahaha
one more question:
guys so if were talking about a '2 dimensional real coordinate space' it has to be inside a tuple in python like this ([3,4], [4,3])
right?
so the R^2
olive willow
vectors
earnest prawn
thats supposed to be one vector?
olive willow
like every vector you can make with that set of numbers
 simple frigate
not exactly my defeinition of vector but okay
olive willow
hahahaha
yh those are two vectors
it's supposed to be a 2 dimensional real coordinate space
in python
like an example of one
so R^2
 reef bone
You can check out Essence of linear algebra on youtube, it's a fairly good introduction

YouTube
A geometric understanding of matrices, determinants, eigen-stuffs and more.
olive willow
yh'\
reef bone
[1, 2, 3] would be a 3D vector
olive willow
I know 3b1b
reef bone
It gives the vector's magnitudes along 3 axes
olive willow
yh
I know that
but in code, how would you represent a 2 dimensional real coordinate space
earnest prawn
im stil trying to wrap my head around what you want to express with a tuple of 2 vectors
olive willow
I sec lemme show you where I found it

Khan Academy
Learn for free about math, art, computer programming, economics, physics, chemistry, biology, medicine, finance, history, and more. Khan Academy is a nonprofit with the mission of providing a free, world-class education for anyone, anywhere.
lean ledge
@olive willow
but what's the difference between a matrix and a 2d tensor
For computer scientists who have 0 respect for mathematical definitions and grace: a matrix is a 2d tensor
For actual people who understand maths: a matrix is a representation of a rank 2 tensor. A multidimensional array is to a tensor what a matrix is to a linear transformation
A tensor is more fundamentally a linear transformation that transforms in a particular way with a chance of coordinates
olive willow
one sec searching linear transformation up
stoic beacon
Oh Raggy
olive willow
what does linear combination mean???
the ``` A1V1 + A2V2 + A3V3 ..... + AnVn
A = scalar, V = vector
earnest prawn
a linear combination is a sum of vectors which are each multiplied with a scalar, you can do some interesting stuff with that in geometry for example
olive willow
so if I've two vectors V[4,5] and A[2,7]
the scalars are 4 for x and 5 for y
and 2 for x and 7 for y
olive willow
the basis vectors
earnest prawn
5 * [1,2] + 3 * [2,10]
scalars are 5 and 3 vectors should be obvious
olive willow
yh I know that
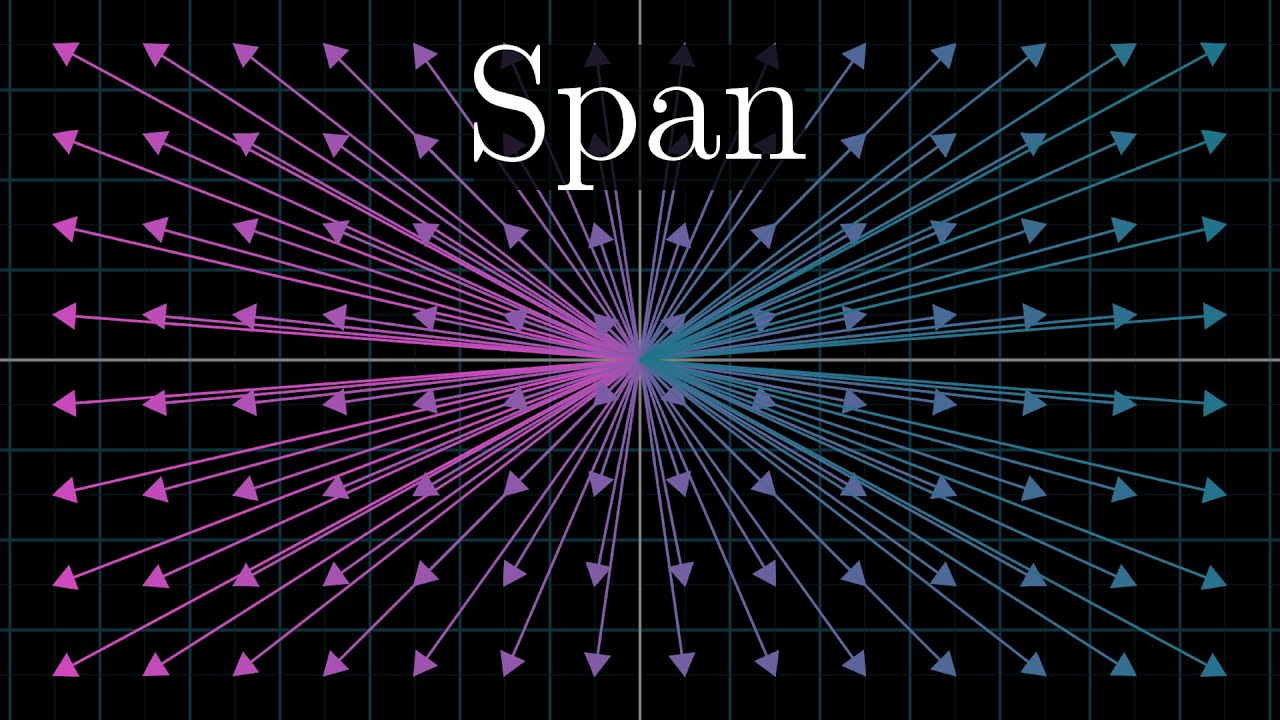
Home page: https://www.3blue1brown.com/ The fundamental vector concepts of span, linear combinations, linear dependence, and bases all center on one surprisi...
sec 40
I mean with that kind of thinking
earnest prawn
yeah he wants you to think about it as scalars
which makes sense
but they are not scalars
olive willow
oooh so it isn't like a function you really use?
earnest prawn
he is just trying to explain to you how a vector works and yes you can mathematically express a vector like he does buuuuut if youd name the elements of a vector scalars youre gonna confuse some people
olive willow
oohh sry for that
earnest prawn
especially when you bring up a linear combination before where scalars are very important
olive willow
sure
could you give my an example of this a linear combination is a sum of vectors which are each multiplied with a scalar
like the sum, are you just supposed to add them together
like [4,7] + [2,5] = [6,12]
if the have the same scalar
earnest prawn
if you multiply a vector by a scalar you just multiply each element of the vector with that scalar
and yes adding vectors works like you just showed
olive willow
but do they have to have the same scalar or not the two vectors
earnest prawn
of course not
for example my linear combination
5 * [1,2] + 3 * [2,10] =
[5, 10] + [6, 30] =
[11, 40]
so [11, 40] is the linear combination
earnest prawn
the result of it
earnest prawn
yes
olive willow
I understand now thanks dude a lot for the help you've given me!
cuz it's not that easy to understand the concepts at my age, that's why I ask so many questions
earnest prawn
(im only two years older than you, you can get there 👍 )
earnest prawn
I mean that linear combination and vector stuff is taught at schools here
(well taught to 17-18 year olds at school but still)
olive willow
yh
I'm 14
so 3 to 4 years
we currently have how to find out what the content is of geometric forms
and how to use you can say scalars to get a bigger form from the basic one
earnest prawn
do you mean volume?
earnest prawn
yes volume
 vestal axle
Hello, anyone here familiar with mean variance optimization problem together with the Black Litterman?
Aka reverse optimization
I need some help with matrix multiplications, I have a transposed matrix with 10 rows and 156 columns, which should be multiplied with another matrix that has 156 rows and 10 columns. Can I just multiply these two together, or should I transpose the first matrix again?
deft harbor
@earnest prawn where are you that they teach L.A. at 17?
earnest prawn
Nah they teach analytical geometry at 17
I was talking specifically about linear combinations and vectors
 misty sonnet
Nix is a smrt boy
stoic beacon
Probably some magnet school lol
earnest prawn
@stoic beacon no basic analytical geometry is taught to everyone in germany who visits the highest form of high school and is in the 11th grade aka usually 17 years old
stoic beacon
This is why the US is behind lol
earnest prawn
i mean we are also taught basic calculus at that age too
which does not mean everyone understands it though...
or remembers it for longer than A levels
misty sonnet
@stoic beacon I mean. Germany's unis ain't great
Americas are
It's not really fair to only compare on part of a education system
You need to compare the whole thing
And to that end: They are all crap
misty sonnet
Well, you have Switzerland
earnest prawn
what
olive willow
??
misty sonnet
Well, it's not that they are bad
They are good
I just don't think you guys have a top 20 uni?
If I am wrong: Fair play, I apologize
olive willow
hahahaha
daring spindle
Do you guys like the tensorflow ML NN tutorial?
And should I start with the google crash course before that?
stoic beacon
There's a Google crash course?
daring spindle
Yes
lean ledge
reddit
92 votes and 41 comments so far on Reddit
earnest prawn
@lean ledge and you are what type?
lean ledge
Too inexperienced so far to count as one :P closest based on description is probably 2
 fleet crag
Hey guys, I'm a bit inexperienced regarding machine learning - but is it possible to find the best combination of a,b & c in the equation y=ax^2 + bx + c with a given data set via machine learning? As of right now I'm only familiar with BNN and how to use it for image recognition, and I can't for the life of me redefine my problem such that a BNN could solve it. Unless there is another type of ML that can do this?
daring spindle
Yo should I try the google crash course
and after that do some tensorflow basics
or pytorch
depends
fleet crag
I usually go to this one
Python Programming tutorials from beginner to advanced on a massive variety of topics. All video and text tutorials are free.
@daring spindle
stoic beacon
@daring spindle what's the link for that course?
I hear good things about Keras btw
 stoic beacon
Oh nice thanks
daring spindle
Here I got send her by the tensorflow guide
so I think after this
you should do tensorflow
and then your probs set with the basics
stoic beacon
TensorFlow is a little advanced for me. Too much control and too many knobs to turn
stoic beacon
Awesome!
I'll look into these two
I may use Keras for NN stuff at first. It's also supported by Google and has good docs I think
TensorFlow seems more advanced and for fine tuning big models and atuff
lean ledge
@fleet crag yes it is but if your dataset isn't massive, just use normal equation for least squares
No need for ML when you can get an optimal answer unless it's massive dataset
fleet crag
@lean ledge Although very true, I'd love to know how. Are there any papers/articles regarding the matter?
lean ledge
Papers for ML or for normal equation? Both are pretty basic content so I won't be able to find any papers for it but I can link resources
Notes from my second year math class
fleet crag
ah thanks, I actually meant for ML. But these are nice to refresh my maths again 😃 Regarding the ML part, I'll try to research myself and see if I get my answers 😄
lean ledge
It shouldnt be very hard to do this using ML either. It's sort of just linear regression with an augmented dataset. When you have the dataset 10 = ax^2 + bx + c at x = 3, you just need to fit 9a+3b+c=10. Make your loss function, do linear regression on it with the 3 variables
[[1 x1 x1^2],
[1 x2 x2^2],
....]
multiplied by [[a], [b], [c]]
fleet crag
yea. but arent we coming back to least squares again?
fleet crag
well, I meant the method xd but I get it haha
lean ledge
"least squares problems" means "solving for coefficients for a problem that minimises L2 distance"
HOW you solve for coefficients depends
mossy dragon
couldn't you just use forward/backwards selection to figure out best variables?
lean ledge
the method i gave solves for it analytically because least squares is a simple problem in linear algebra
with a simple analytical solution
the only problem being that the analytical solution doesnt scale well to massive datasets
mossy dragon
nvm i thought you guys were talking about variable selection in linear regression
lean ledge
that's when you use ML because ML doesnt give the optimal answer usually but its an approximate answer faster
Anyways, there's a lot of resources to learn ML around. Columbia's course is my recommendation. If you dont know the basics, I'd start here @fleet crag https://www.edx.org/course/machine-learning-columbiax-csmm-102x-0?utm_medium=affiliate_partner&utm_source=CredEdLLC

edX
Master the essentials of machine learning and algorithms to help improve learning from data without human intervention.
Given you said the maths I linked is a refresher, it should be fine for you
lean ledge
nw
mossy dragon
The other day this Econ PHD candidate was telling me how there was so much bad statistics going on in the data science field currently and how that was going to change.
lean ledge
He's not wrong about bad statistics going on. Dunno about it changing any time soon
mossy dragon
Yea im wondering about that because when I look at job posts online they sometimes ask for just a CS degree, I don't think CS majors would have the stats neccessary to really excel at the field right? And im not sure its the easiest thing to learn while on the job either.
I wonder which person has a higher chance of getting an interview, a person with a stats degree or a person with a CS degree.
 silent swan
in tech A/B testing is considered its own subfield
lean ledge
@mossy dragon Dunno about interview/hiring process but out of all the quantitative STEM degrees, CS people have some of the worst maths background because at a lot of places the only requirements for maths are maybe calc 2, intro stat and discrete maths, and there's a lot less maths in CS subjects than other degrees
Since CS degrees arent really CS degrees and more software degrees, poor maths backgrounds are common
 sand reef
A question regarding HopField neural network. I have been making a small project on it, with pattern recognition of a grid of size 7x7. I am not sure why, but for some reason, the network keeps on only converging to only the latest learnt pattern. I tried the formula for updating and all on a smaller vector only implementation, and it worked perfectly there.
I would like to ask someone to see if my implementation of the formulae is correct? Or do I have it messed up?
sand reef
    def output(self, panel):
        for i in range(7):
            for j in range(7):
                panel.secondMatrix[i][j].setVal(self.matrix[i][j])

    def update(self):
        for i in range(49):
            self.matrix[int(i/7)][i%7] = self.vector[i]

    def runAsync(self, panel, number):
        for i in range(number):
            r = random.randint(0,48)
            temp = 0
            for j in range(49):
                if r != j:
                    temp += panel.learn.unwinded_matrix[r][j]*self.vector[j]
            self.vector[r] = self.sign(temp)
        self.update()
self.output(panel)```class LearnButton(wx.Button):
def __init__(self, panel, pos):
super().__init__(panel, label="Learn", pos=pos)
self.matrix = []
self.panel = panel
for i in range(7):
temp = []
for j in range(7):
temp.append(0)
self.matrix.append(temp)
self.Bind(wx.EVT_BUTTON, self.onClick)
self.energy = 0
self.unwinded_matrix = [[0 for x in range(49)] for y in range(49)]
self.unwinded_vector = []
for i in range(7):
for j in range(7):
self.unwinded_vector.append(self.matrix[i][j])
def calcEnergy(self):
pass
def onClick(self, event):
for i in range(7):
for j in range(7):
self.matrix[i][j] += self.panel.matrix[i][j].getVal()
for i in range(7):
for j in range(7):
self.unwinded_vector[i*7+j] = self.matrix[i][j]
for i in range(49):
for j in range(49):
if i != j:
self.unwinded_matrix[i][j] += (2*self.unwinded_vector[i]-1)*(2*self.unwinded_vector[j]-1)```For some reason, any pattern learnt previously is never converged to when I am running the network. It only converges to the latest learnt pattern. (Did some editing, it now converges to a combination of all the learnt states, the above code was unchanged.) Help? It only converges to the combined state.
olive willow
what is linear algebra used for in data science, could someone give me an example in code
daring spindle
The things I have seen in Andrews NG course was like theory
Like this
But I am fairly basic
olive willow
I just know vectors, linear combination, span and that's about it
matrix and tensor
also
daring spindle
I am literally 13 all the algebra I have seen came from ML courses
olive willow
I'm 14 but I know algebra but you shouldn't do ML when you're 13
you need linear algebra, calc and stats to understand it
daring spindle
Why wouldnt I may grades allow me to spend time on it and I love it
I’ll pic that up on the way
olive willow
no dude
you won't
that's almost college level
you only will know what it's about
not how to do it the right way
daring spindle
I like it. My math teacher helps me with the hard parts
olive willow
But it doesn't matter if you like it, it matters if you understand it. and if you're 13 you didn't even had linear algebra at school. I don't think even stats
daring spindle
Anyone can learn everything some faster as others. But everyone can learn
sand reef
linear algebra is just matrix and vector manipulation
its simple and anyone can learn it
sand reef
yeah, i know, i have also done ml and deep learning
sand reef
no worries, he can do it, if he likes it
olive willow
yh but look, do you even know what the symbol sigma is
daring spindle
Yes
sand reef
yeah, just don't overwork yourself
daring spindle
I learned in andrews NG’s course
olive willow
just start at the basics
learn slowly, not that you can't do it but chill you have time
sand reef
say, anyone of you guys knows about hopfield neural networks?
i srsly need help with that
sand reef
he is off
sand reef
i m literally on the end of my small project, and freakin, idk what i am calculating wrong T^T
sand reef
i guess i could try stack, but yt, nah
sand reef
i asked, they pointed me here
olive willow
oohh lol, yh sure
Idk dude
I'm learning linear algebra for data science. like data matrix and vectors
sand reef
mhm....i'll just wait for someone to help
sand reef
nice
olive willow
yup
sand reef
xD, but nah
@earnest prawn , I have been told that you could help. Could you help me with HopField Neural Network Implementation in python? I have a major issue in making of a small project.
earnest prawn
Sorry but that's something I've not heard of until today, can't help you with that
sand reef
Oh okay. Thanks anyways.
 granite basin
how would one use clustering for image data? I'm not getting very good results, even after applying PCA
stoic beacon
Generally, if a date/time is involved in your data, is it going to be better suited to time series analysis?
I'm trying to find a fun dataset to work with but keep picking ones with dates or over a period of time
olive willow
do you want a pokemon dataset?
or fifa 19 one
or world bank stats?
@stoic beacon
stoic beacon
not sure haha
stoic beacon
interesting
olive willow
yup
I just asked myself so question I would like to find the answer to
and then used that data to find them, I suggest you to do the same thing
olive willow
sure np
stoic beacon
where did you find those btw?
stoic beacon
ah okay yeah ive been there
 onyx granite
kaggle is awesome
olive willow
yh
 teal night
@stoic beacon Well what would be Your preferences to working over a dataset?
stoic beacon
@teal night what do you mean?
sand reef
If your data is sequential or the date / time is a major factor in it, yes then you can use time series analysis.
@granite basin you mean using clustering for classification? If yes, how are you taking your features? Are you extracting the features using algorithms?
lapis sequoia
is anyone alive
I'm having trouble assigning new columns
def split_semantic_path(df_rows):
  semantic_paths = re.findall(ARGUMENT_PATTERN, df_rows, re.DOTALL)
  return semantic_paths

data_df[['semantic_path0', 'semantic_path1', 'semantic_path2']] = data_df['semantics'].apply(split_semantic_path)
but it tells me those columns don't exist.. they don;t.. this call is supposed to create them
fleet crag
Is it possible train a neural network to solve an optimization problem? (even though the training of the NN is an optimization problem itself)
granite basin
@sand reef I used PCA to select the features, it does cluster the data, which is unlabeled, but with just some manual checking I can already tell that it's not very accurate
 lost sinew
how do i do a cross correlation to find the time lag/lead of my data
i have charted out the correlation between all items in a pearson correlation chart
is there a way to find a cross-correlation of each ?
lapis sequoia
you mean correlation of each item vs each other.. that's exactly what you need to do
lost sinew
avg_btc_price_usd price_usd
1 -0.057079 -0.384172
2 -0.088811 -0.110334
3 -0.047064 0.301020
4 0.003190 0.291260
5 -0.006247 0.419880
6 0.012485 0.266879
7 0.099603 -0.155015
8 0.059023 -0.206790
9 -0.001597 -0.010660
10 0.001780 -0.126942
how would i cross correlate this dataframe?
sand reef
@granite basin generally,clustering isn't very accurate in terms of image classification because of feature selection. If I am not wrong.
So it could very possibly be the features selected that might be causing an issue.
@fleet crag not sure, but if you can represent your optimization problem in such a way, I think there are some models that do converge to a global minima. Something like hopfield networks and all.
fleet crag
Funnily enough, I'm reading "Neural Computation of decisions in Optimization Problem " by Hopfield himself (1985) at this moment @sand reef
Whereas he uses a NN to solve the travelling sales man problem
granite basin
@sand reef Hmm yea I think you're right, I have an unlabeled dataset of written numbers, and a dataset of spoken numbers. The only 'labels' I have are if they describe the same thing or not. I wanted to label the images with clustering and feed this to the spoken data but accuracy is not very good
lean ledge
@fleet crag Yes, many ways for neural nets to solve optimization problems
A lot and lot of stuff that neural networks are used for nowadays used to be treated as DP problems or something equally Bellman-y
Neural networks are just function approximators. How you use them is up to you
eg. Reinforcement learning is an attempt at approximate optimal control theory. Deep RL is using NNs to (ideally) solve optimal control problems
sand reef
I see. So I am happy, that I was right. Yey!
 naive shore
hi! i'm trying to extract frequencies from short samples of data with Numpy's FFT, but seems it can't catch the wavelength marked with red or green dots. Is it mathematically impossible with FFT to do this on such a short segment?
i hope its data science sorry if im wrong 
sand reef
Fast Fourier Transformation? I know what it is and what it does, but I do not know what are its limitations. Although I can check it up though.
naive shore
well if can and if you want )
it actually registers what i need (marked with dots) but its like not the main result, just among the garbage
 stuck prawn
Guys, anyone heard about DataQuest? Is the paid plan worth to get the technical skills for a job as a fresher in Data Science field?
sand reef
@naive shore do you have the code for it? How have you generated the function for it?
naive shore
i'll give you my python with fft and a text file with the waveform ok?
==========================================================
import numpy as np
fname = "note2.txt"
with open(fname) as f:
x = f.readlines()
w = np.fft.fft(x)
freqs = np.fft.fftfreq(len(w))
#np.fft.fftshift(freqs)
idx = np.argmax(np.abs(w))
idx2 = np.where(np.abs(w)>80000)
#print(w)
freq = freqs[idx2]
freq_in_hertz = abs(freq * 44100)
print(freq_in_hertz)
sand reef
Sure. I'll try my best to see what went wrong. Although I am thinking this might be beyond me.
naive shore
its "note" like musical note pitch )
sand reef
I see. And for some reason the output is skipping two frequencies?
naive shore
not skipping but they are not returned as main one. well actually its the same freq with green and red dots
242.97
this one
sand reef
I see. So just one frequency is not being returned by the fft function?
naive shore
it is returned but its like not the main one
and it is obvious looking at waveform
idx2 = np.where(np.abs(w)>80000)
this part filters results
when 'the bar' is 80000 the needed frequency is shown among others.
but if i rise the bar so there whould be one single frequency - its not there
so i cant filter specially it
i know the exact value for this segment , but i need program to see it as the one i need too
sand reef
So, when you set value for np.abs(w) > some high value, it's not filtering out
Where it's supposed to be the highest frequency in the entire waveform?
Is it the highest frequency in the entire waveform?
naive shore
not the highest, but its still main
it leaves the higher octave of freq i need
is it how it should work?
sand reef
The np.where(np.abs(w) > 8000) would mean, all the frequencies of the waveform who have a value greater than 8000
So, only the frequencies greater than 8000 should be returned right?
naive shore
no. im not fully aware how it works, but 80000 is not a frequency limit, but kind of a number of times fft finds particlar frequency
i guess....
sand reef
So now I am confused. Doesn't FFT return all the frequencies used to make a certain waveform?
naive shore
kind of. but its several steps
the fft function returns "SOMETHING" that then be converted to frequencies with fftfreq function
sand reef
And if that is the case, then np.where(np.abs(w) >8000 ) should mean values in the array where values of the array are greater than 8000 right?
I see. Let me see what it returns.
So, fft returns some complex number values
naive shore
"This function computes the one-dimensional n-point discrete Fourier Transform (DFT) with the efficient Fast Fourier Transform (FFT) algorithm [CT]."
what the docs says/
gosh im bad at math 😃
yeah, when i red about fft i've met something about complex numbers
sand reef
And the frequencies are returned by the fftfreq function
naive shore
yes
desert oar
fft freq is the x axis of the frequency plot
sand reef
So, abs(w) = sqrt (a^2 + b^2)?
desert oar
in fact theres an example in the docs...https://docs.scipy.org/doc/numpy/reference/generated/numpy.fft.fft.html
naive shore
well yeah i took the code from examples. it shows correct frequencies, the thing is numpy doesnt see main frequency as main one
sand reef
So that would mean that your X and Y axis values, the rotating vector formed, it's length has to be greater than 8000?
naive shore
can we agree that the wavelength between dots is like the main one? or is it just my imagination 😃
sand reef
Yus
desert oar
i was confused hah
naive shore
its a signal from guitar, so that frequency is the only right one
sand reef
Stack Overflow
I'm confused about understanding FFT's and how to apply them in python. From my understanding applying an fft to a 10-pixel 1D array should contain a list of 10 numbers (+2 for the "DC" component):...
naive shore
i know cause i played it )
sand reef
This. Tells what fft returns
desert oar
@naive shore do you know what that frequency is approximately?
naive shore
242.97520661 this
it shows up but among others
if i rise the filter - it leaves the octave of that,. so like twice of that, 485.9504132
desert oar
whats the unit here?
desert oar
how are you getting that from the fftfreq output
ahhh ok
yeah signal processing is probably the one area where i'm truly newbie
In [50]: fft_freqs[data_fft > 80000] * 44100
Out[50]: array([484.61538462, 969.23076923])
yeah, almost there, just need half of that first number )
desert oar
import matplotlib.pyplot as plt
import numpy as np

with open('note2.txt') as f:
    data = np.array([float(line.strip()) for line in f])

data_fft = np.fft.rfft(data)
fft_freqs = np.fft.fftfreq(data_fft.size)

plt.plot(fft_freqs * 44100, data_fft, '.-')
plt.xlim((-10000, 10000))
plt.grid()
plt.show()
yeah @sand reef thats just numpy
if nobody can step in and figure this out, might be a good one for math.stackexchange.com
or some equivalent site. maybe stackoverflow
olive willow
what's wrong?
desert oar
signal processing. FFT isnt picking up on what ought to be the dominant frequency
sand reef
I need to know. Since things are making some sense to me now. Which statement is causing the issue? As in which print statement is getting the erroraneous part?
desert oar
trying to figure out why. this is not my area of expertise
olive willow
can you send the txt file?
desert oar
@sand reef the maximum aplitude of the data_fft in my code ought to be around 243
sand reef
I see.
desert oar
hmm @naive shore is there some reason it would double the frequency?
im wondering if maybe us in all our FFT noobness is missing something simple in how its supposed to be used
sand reef
Is the file being read right?
desert oar
yes thats what my code does
naive shore
well the guitar waveform by itself consists of the main freq and harmonics (octaves of that). so thats the difficulty
desert oar
i dont think thats it though
you were wise to realize that its about 2x the correct frequency
so i think we are just misusing FFT
sand reef
Fft is returning the amplitude times cos of phase angle plus amp times sin of phase angle right?
olive willow
what do you want the code to do?
sand reef
So, we need to max out the amplitude by np.max(np.abs(w))?
olive willow
read it and then plot it?
desert oar
@olive willow yes, but that's not the question
my code does that and it works. that's not what we are discussing
sand reef
I think I am not getting the error.... I guess.
desert oar
there is no error
the error is "why isn't this returning what i expected it to return"
naive shore
yes )
sand reef
Oh.
desert oar
fft_freqs[np.argmax(data_fft)] should be around 243
olive willow
yh there is no error
sand reef
Oh.
desert oar
and i suspect its because both arnold and i are relatively inexperienced with this and aren't using it correctly
olive willow
this is the graph?
desert oar
oh yeah the argmax is actually at 962
which is... approximately 4x the required frequency
sand reef
So, there is a different dominant frequency?
Np.argmax, it converts complex numbers to real numbers right?
desert oar
no
sand reef
By taking the square root thing.
desert oar
no
sand reef
So, what does it takes the max on?
sand reef
Yeah. It will return the argument of the max value there right?
desert oar
"argument" being a term borrowed from math
in this case it just means the position of the max in the array
as opposed to the value of the max
desert oar
data_fft is the amplitudes yes
sand reef
Yus.
desert oar
fft_freqs[np.argmax(data_fft)] is the frequency that corresponds to the max amplitude
sand reef
Wait no. Is it? I thought even rfft returned complex numbers? Whose absolute value gave the amplitude?
desert oar
oh. probbaly the magnitude of the complex number
here can do it w/ real part
fft_freqs[np.argmax(data_fft.real)]
same answer
sand reef
Please try, this if it works
fft_freqs[np.argmax(np.abs(data_fft))]
Since I am on my phone, I can't check if it works or not.
desert oar
same answer
sand reef
Fk.
Is the answer supposed to be 243?
If it is, yeah, this is beyond me then.
Sorry for not being able to help.
desert oar
yeah. again i suspect this is "user error"
4x off is too close to correct to be truly wrong

 naive shore
sory just a bad joke )
sand reef
Oof.
naive shore
doing some test with other waveforms. its always 2x with my code. probably should just divide by 2 and be with it )
stoic beacon
Halp halp I need halp
Linear transformations wuuuuut
Watching 3blue1brown on them and I'm stuck at 4:21
No link cuz I'm on my phone and for some reason Google won't include a share button that has a timestamp option
stoic beacon
I'm stuck on understanding linear transformations
sand reef
Okay....?
stoic beacon
So I need help understanding them
stoic beacon
How they're calculated and represented yeah
sand reef
You mean stuff like translation, rotation and scaling?
stoic beacon
Mhm
sand reef
Okay. I hope I don't end up talking about the ones used in graphics. Cuz I know of homogeneous coordinate system, and something like that is used.
Okay, so it goes like this.
olive willow
so linear algebra ??
stoic beacon
Yes
sand reef
Given a transformation.
olive willow
I'm also there
sand reef
If it preserves addition and scalar multiplication, it's a linear transformation.
stoic beacon
Makes sense. So how do you calculate a transformation
olive willow
so @stoic beacon you want to know how you can calculate where a vector would land after a linear transformation if you know where I and J hat land?
stoic beacon
Yep. I think I understand I just want to make sure
Also, feels bad that a 14 year old understands this better than me 
stoic beacon
Yep