#data-science-and-ml
1 messages · Page 198 of 1
 feral lodge
@ripe sundial From what I can find the Keras progress bar doesn't actually print after each mini-batch. It's supposed to update in-line, meaning we should only have a single bar that fills up progressively on the same line in the terminal. But it seems that this doesn't always work
So if you've set mini_batch to 1, then that's what's used under the hood; not 1, 23, 46, etc
If you run the same code several times you'll notice small differences in the numbers printed also, so it's just a matter of timing
Running some of my code I noticed the same. This is what I get for my own code where batch_size = 512:
1536/15000 [==>...........................] - ETA: 28s - loss: 15.2
3072/15000 [=====>........................] - ETA: 12s - loss: 14.2
4096/15000 [=======>......................] - ETA: 8s - loss: 13.59
5120/15000 [=========>....................] - ETA: 6s - loss: 12.97
6144/15000 [===========>..................] - ETA: 4s - loss: 12.39
7680/15000 [==============>...............] - ETA: 3s - loss: 11.58
8704/15000 [================>.............] - ETA: 2s - loss: 11.08```So anyway in conclusion there's no problem
 ripe sundial
Thank you very much @feral lodge
ripe sundial
Yes! The machine learning part is just a small part of it, used mostly for comparison. I also have a more statistical approach where I can count people up to 90%. An example I have a class room with 38 students, the 2 sensor algorithm manage to say 36 people on average.
How is it going with yours?
The beauty is that the data is totally anonymous on person level, so there is no way to tell say gender or skin color from the data
only whether there is presence or not and how many people there are
I have to hit the gym before a meeting, but just tag me!
feral lodge
Nice nice 😄 Mine is also going well! I'm very slow at writing the report though
ripe sundial
@feral lodge hah yea, I finished all coding about a month ago and it has been all report from there. I am currently at 60 pages. Was doing evaluation and the batch thing got my attention
when is your deadline?
feral lodge
No hard deadline, I'm working for the university and my supervisors are chill 🤓
Send me a copy when you're done, it's always fun to look through peoples' theses
 quasi nacelle
Hi i am trying to extract accession numbers looks this AB000114.CDS.1.
and writing to a file. But my code extracts the line i want
SAMPLE: AB000114.CDS.1.
i am using Regex
import re

samples = []

with open("orphans.sp") as myfile:
    for line in myfile.readlines():
        if re.search(">AB.......CDS..", line):
            samples.append(line)

print('SAMPLES: ', samples)

with open(r"file2.txt", "w") as myfile2:
    for s in samples:
        myfile2.write(s)
the file
 granite basin
if I have two unlabeled datasets split into test/training, say a set with spoken words, and a set with written words. And a list with boolean values that tells me if the word + audio match or not in the training set. What would be an applicable model to classify other pairs of audio + image as matching or not? I've tried just adding the data together and normalizing it but that obviously doesn't work. And I'm not sure what to google/stackoverflow for more information
 dense rose
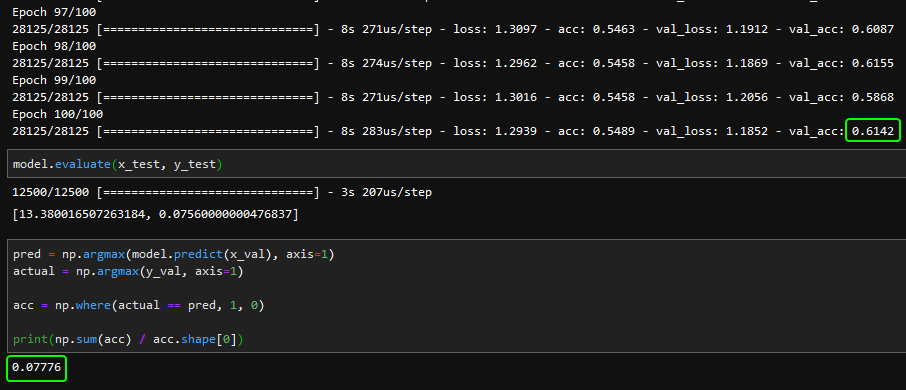
I must be doing something wrong because these should be the same number if I understand correctly.
10 category classifier.
1-hot encoded labels.

Doing it with the training data also results in about 7.5%
 lapis sequoia
hello guys, any advice for newbie to learn AI or ML?
check the pinned messages.. plenty of resources there to get you started
got it , thanks @lapis sequoia
 still otter
There is some data I want to plot in matplotlib but I'm not sure how to go about it effectively
I have thousands of individual data sets that cover a small domain, but collectively cover a larger domain, and I want to plot them all on the same graph
For example, data set A covers x 0 through 100, B covers 50 through 150, C covers 100 through 150, etc...
I'm not really familiar with matplotlib, is creating a plot for each data set the correct way of doing this? It would lead to thousands of plots on the same figure in my case
 upper stump
tested with ```python
from matplotlib import pyplot as plt
data = [[i+j*50 for i in range(100)] for j in range(200)]
for d in data:
plt.plot(d, d)
plt.show()
and didn't notice any issues @still otterI have created a pivot table which takes long to build so I've saved it and loaded it in
#create pivot table final_set = subset.pivot(index='artistName',columns='userID',values='plays_y').fillna(0)
thats what I've saved but when I load it in i need to set the values again
how do i do that?
 mighty vector
Question- I used pyinstaller on a .py that called a pickled file (sklearn MLP classifier). However the exe runa but does nothing. Any ideas? The .py file works fine, and the exe works on the original training file...
still otter
@upper stump Thanks for the snippet, it gets a bit slow to draw once enough plots are involved but it works well enough for now
 oblique socket
How can I use scipy.random to randomly sample from the sklearn boston dataset?
for example, I want to randomly sample 30 samples and targets
X, y = scipy.random(boston)
still otter
np.random.choice(boston, 30)
or possibly np.random.choice(boston, 30, replace=False) if you don't want entries to appear multiple times
lapis sequoia
What do I gotta study to get into data science ?
 silent swan
what exactly do you want to do? analytics? statistics? train neural networks? database engineering? build visualizations?
lapis sequoia
Does it require college lvl math
dense rose
...yes
still otter
you might find more prompt help in one of the help channels, since it doesn't seem like your question is specific to data science
go to #bot-commands and type !f to find an available help channel
 proud mortar
Hi, I also posted this in Help-5. Please let me know if it's not allowed to post in more than one channel.
I'm trying to create a plot from a DataFrame. Depending on a property from one column, I want to plot measurement points from another column with different colors for the measurement points as well as the error bars + error bar caps.
Issues I'm running into:
- using matplotlib.errorbar, ecolor = 'r' works and makes all the errorbars red, but ecolor = color, doesn't work and results in a black plot. Color here gets assigned either 'r', 'b', 'g', or 'm' depending on a property from one of the columns in the DataFrame.
- I can't seem to plot errorbar caps.
Interestingly enough, if I replace the ecolor=color with ecolor='r', I can see errorbar caps
 paper niche
can you show your code?
proud mortar
for artefact in range(0,30): #Plot with errorbars color = '' if df['Laboratory_y'][artefact]=='1': color = 'r' if df['Laboratory_y'][artefact]=='2': color = 'b' if df['Laboratory_y'][artefact]=='3': color = 'g' if df['Laboratory_y'][artefact]=='4': color = 'm' if df['Laboratory_y'][artefact]=='5': color = 'y' plt.plot(artefact,df['NormalizedLF'][artefact],color+'o') plt.errorbar(artefact,df['NormalizedLF'][artefact], yerr=df['RelativeError'][artefact],ecolor=color)
 reef bone
@proud mortar I'll respond to you here because someone else took #help-chestnut. I think the problem might be coming from the fact that the if statements compare against strings, but the dataframe might be integer data?
In comparison, this is what I get when I compare against strings
Confusing af, since matplot gives it colours automatically
proud mortar
Ah, I wrote '1', '2', etc in the if statements here but in reality the properties are similar to 'ABC'. I changed it out because it's sensitive information.
If I change my if statement's 'ABC' to ABC, I get "name 'ABC' is not defined"
reef bone
Try to print(color) between the last if statement and the plt.plot
See what you're getting
proud mortar
`b
r
g
m
y
b
r
g
m
y
b
r
g
m
y
b
r
g
m
y
b
r
g
m
y`
There's gaps because there's one NaN per every 6 rows
Oh wait. The plot was showing black, but I tabbed out and now it is showing at least something. I think this confirms that it craps out when it passes over a NaN
reef bone
mmm
I was going to suggest you use a default colour instead of an empty string, but you might need to look into the NaNs instead
proud mortar
There's some progress! I removed the 5 rows that contained NaNs, then reset the dataframe index and it plots this now:
 reef bone
no problem you fixed it yourself
 chrome kernel
I love ai
 hasty maple
@thin furnace look up how to use google colab https://colab.research.google.com/
 lapis sequoia
@thin furnace jetson nano.
 thin furnace
isnt the jetson nano like realy slow though
if i am not mistaken it "only" has like around 128 cuda cores
google colab is allright for somethings
but a pain in the ass to upload datasets to google drive
 hollow vapor
Quick Question.. I'm an upcoming freshman in college. I will be studying Info sec&Info Tech. Will this prepare me for this data science field if I chose this path?
 lean ledge
@thin furnace @ßtxt_rgb"404040"if_rgb"000000"ß#6167 the nano is for inference, not training. Not really comparable
thin furnace
yea i guesed so
lean ledge
@hollow vapor not unless your syllabus is full of maths and statistics which it doesn't sound like it is
thin furnace
i will be able to use a google coral edge tpu board soon
i think it might be better suited for the project i have in mind
hollow vapor
@lean ledge ok
dense rose
Can anyone help me with why my Keras model shows drastically different accuracy when evaluated on the training data than it does in the training history?
lapis sequoia
you gotta be more specific buddy..
what is the model for.. how does the data differ.. show some code... and maybe a screenshot
dense rose
The data doesn't differ
It's the same data.
Shown here validation data but same thing when I evaluate training data.
 heavy tundra
So, I want to try starting a personal project where I take data from a game on Steam and just play around with data analysis, but I don't know where to start. All I want is to read and store the inputs from a game on Steam into maybe an Excel sheet, Python, or R, anything really. Is something like this possible, and is it feasible for me to do without having any experience modding games or anything?
 desert oar
thtas a good question. i dont know the answer but maybe you can start by looking up how openai does it?
it probably depends on the game engine
that said openai might be parsing dota replay files. not sure
heavy tundra
think I might just ask someone who's done something similar
desert oar
always a good idea
 earnest prawn
So I got a question regarding reinforcement learning. So as far as my very raw knowledge of this topic goes the environment has a certain action space the agent, let it for example be a neural network, has to pick an action from. What I dont understand however is what happens if hte action space changes (because for example some actions became illegal) because the neural network is still going to output a fixed sized vector but I gotta map that vector to a vector which changes its size over time, can anybody explain to me how that is usually handled?`
desert oar
good question tbh
that might be a better question for a dedicated machine learning chat
https://rml-talk.slack.com for example
the super quick and dirty solution would be to hard-code those outputs to 0 before applying softmax
or if you can't do that, hard-code to 0 after softmax then renormalize the vector
earnest prawn
im gonna try that, thanks
And one more question , if the action space was infinite if if the rules werent there, so for example in card games where you place bets that bet could at least in theory be infinitely high but you obviously only have a finite amount of money, how do you handle that, because your approach with having a probability with each action and then reducing some to zero does obviously not work there
earnest prawn
@desert oar do you happen to know that too?
desert oar
honestly i dont know much about reinforcement learning
for regression you'd output a single value and you'd want to constrain it somewow
my suggestion was only for selecting among mutually exclusive categories
for regression you might want to use some variant of the logistic function
to be able to generate bets asymptotically close to your maximum
but these are general suggestions
lean ledge
@earnest prawn theoretically you can train your network with an output vector with all possible actions in such a way that it learns which actions aren't valid in which space. As for your second question, there's many methods which allow for continuous action spaces

Artificial Intelligence Stack Exchange
This question is regarding Reinforcement Learning and different/inconsistent action space for every/some states.
What do I mean by inconsistent action space?
Let say you have an MDP where the num...
earnest prawn
I already found a way to make it a discrete space so problem solved I guess but thanks for digging anyways! @lean ledge
 brittle fiber
i have no idea what to do on my days off of school. I have no coding project that is keeping me grinding every day.
Like i picked up the intro to ML published by O'rielly but there are no exercises in the book to show that i am doing something ohter than following along
silent swan
what's your level / what are you interested in?
brittle fiber
fairly proficient, i've taught myself most of the abstract datastructures but havent touched on algorithms too much, my math background is the strongest so im not afraid of those. I have had no industry experience as i am currently a sophomore in a statistical data science major.
i feel like shit for just going trhough the cracking the coding interview book and leetcode. I feel the need for some actual useful programming i havent been able to find a project to work on myself or with friends that is marketable
silent swan
what do you want to end up doing? research / industry / "generic data science" / SWE ?
brittle fiber
I am partial to the research side of industry.
dense rose
As an aside I'd be interested in hearing an elaboration on each of those options.
silent swan
depending on how deep into research you want to go, you'll need a graduate degree, and you need to plan for that
brittle fiber
i guess what i am shooting for is a hedge fund quant researcher
brittle fiber
right i am very aware of the path i need to take though i would feel better if i had some hands on or something of mine to show
until i get an undergrad research position, i feel the need ot be doing something on my own at least
silent swan
fwiw I never felt that the finance-side quants/techs ever cared much for side projects
depending on buy/sell-side quants, they'd rather you talk about finance research / just answer brainteasers or reason very quickly
brittle fiber
gotcha. i just feel as if i could be doing more
silent swan
instead I'm just going to tempt you into coming over to the dark side and say do the fast.ai course
silent swan
pretty good deep learning crash course
lapis sequoia
Is there a way to write math notation on this discord?
like TeXit on the Mathematics discord
 lyric canopy
No, we don't have a bot feature for that. Feel free to open an issue on our repository, though: https://github.com/python-discord/bot/issues

GitHub
Source code for our Discord bot. Contribute to python-discord/bot development by creating an account on GitHub.
 burnt ferry
there is a bot that my friend made, that does this quite well
silent swan
you simply need to ascend into a higher state of being where your mind automatically compiles tex
lean ledge
This but unironically
dense rose
What are TPUs better at than GPUs?
I've tried the TPU backend on Colab with a small convnet and it seems to perform about 20x slower than the GPU backend.
lean ledge
TPU is a specailised co-processor. Specialised hardware beats general hardware which beats software in speed, every time
It might be slower simply because there's fewer equivalent tensor cores
Or maybe that model is simply not as well suited to the TPU
Medium
I late September, Google made available their TPU as an accelerator option in Google Colaboratory. The example notebook provide…
 chilly shuttle
TPU only makes sense at scale, per dollar
nothing will trump a GTX2080 for training a convnet on a single machine iirc
the value prop is 'most cost-effective compute' not 'fastest compute'
lean ledge
how hardware works is how you design it
if you want to beat a 2080 on speed, you will
thin furnace
for deep learning would you guys recomend a rtx 2060 or would it be better to pay more for a rtx 2070?
 lucid hornet
I guess it really depends if that extra speed is worth it to you? And I personally haven't seen any bench marking statistics on those, but it just boils down to what your priorities are
chilly shuttle
it really wouldn't matter that much
a 1080ti is more than enough to play around with deep learning at reasonable training times at home, anything on top of that is just a bonus
silent swan
TPUs are extremely good at scale but hard to work with. You want a GPU. I still do toy experiments on my gtx1080 with no issues
 pastel bridge
Hello, i am new to data science and currently working on a IMU error modelling project. As a guidline I used this article: https://www.ncbi.nlm.nih.gov/pmc/articles/PMC5982094/ . I use tensorflow and keras. For now my goal is just to train RNN properly but the only information article gives is that they used single-layer LSTM with number of nodes equal to 3000. As input i have acceleration(xyz), angular rate(xyz) and time difference between this and next measurement. As output(correct answer) i use coordinates difference(xy) and heading difference between this and next measurement. All data used is normalized. And i have next question: what is correct way to give such information to LSTM: for now i just use (None, 1, 7) matrices where timesteps value is 1 and features is 7. I hope, somebody more experienced could help me. Sorry for maybe a bit broken language and thank you.
Code:
model = Sequential()
model.add(LSTM(3000, input_shape=(1, 7), return_sequences=True))
model.add(Dense(3))
model.compile(loss='mean_absolute_error', optimizer='adam')

dataset = KITTIDataSequence(r"D:\WS\DP\2011_10_03\2011_10_03_drive_0034_sync", 1, 999) #reads part of raw KITTI dataset and transforms to needed form
#in: [AccelerationX, AccelerationY, AccelerationZ, AngularRateX, AngularRateY, AngularRateZ, TimeDifference]
#out: [XDifferense, YDifferense, HeadingDifferense]
model.fit_generator(dataset, epochs=50, verbose=1, shuffle=False)
Code of data generator is here: https://paste.pythondiscord.com/iqefomurih.py

PubMed Central (PMC)
Bayes filters, such as the Kalman and particle filters, have been used in sensor fusion to integrate two sources of information and obtain the best estimate of unknowns. The efficient integration of multiple sensors requires deep knowledge of their error ...
pastel bridge
Robots positioning , using only IMU observations if you ask about that
@lapis sequoia
lapis sequoia
correct me if I'm wrong but I see it's integrating data from multiple sensors and trying to get estimates of unknowns
pastel bridge
Well, youre right, but we can use simple maths to calculate coordinates if we already know acceleration, angular rates and time between measurements. The main problem is error of specific IMU chip, so this ANN needs to be retrained using dataset collected using specific IMU
@lapis sequoia
My main problem is configuring ANN, because for now with current settings it seems to train but when i use part of dataset used by me as validation values, the results are horrible. I was thinking about adding second timestep and passing previous data as it but the LSTM as i understand shall have its internal state so it doesn't need any workarounds to get previous value.
@lapis sequoia
lapis sequoia
this is very domain specific and I can't help much without diving into it.. I'll take a look at the code and ping you
pastel bridge
Thank you, btw i think, i made a mistake and as output vector i should use not a coordinate difference but absolute coordinates so LSTM could use its state to remember dependence between observations.
@lapis sequoia
 void anvil
If I swap two rows of a matrix does the eigenmatrix change?
I’m running into a weird SVD convergence issue on np.polyfit for a linear regression and I’m pretty sure the data is resulting in an eigenmatrix with more than 1 0
T is 0..99, x is 100 values mean 4000, all unique. Calling with np.polyfit(x,t,1)
lean ledge
shouldnt be very hard to test whether elementary operations (like row changes) affect the eigenspace decomposition
eg
>>> np.linalg.eig(np.array([[1, 0],[0,1]]))[1]
array([[1., 0.],
       [0., 1.]])
>>> np.linalg.eig(np.array([[0, 1],[1,0]]))[1]
array([[ 0.70710678, -0.70710678],
       [ 0.70710678,  0.70710678]])
      2     n = x.size
      3     t = np.arange(0, n)
----> 4     p = np.polyfit(t, x, 1)         # find linear trend in x
      5     x_notrend = x - p[0] * t        # detrended x
      6     x_freqdom = np.fft.fft(x_notrend)  # detrended x in frequency domain

~\Anaconda3\lib\site-packages\numpy\lib\polynomial.py in polyfit(x, y, deg, rcond, full, w, cov)
    626     scale = NX.sqrt((lhs*lhs).sum(axis=0))
    627     lhs /= scale
--> 628     c, resids, rank, s = lstsq(lhs, rhs, rcond)
    629     c = (c.T/scale).T  # broadcast scale coefficients
    630

~\Anaconda3\lib\site-packages\numpy\linalg\linalg.py in lstsq(a, b, rcond)
   2234         # lapack can't handle n_rhs = 0 - so allocate the array one larger in that axis
   2235         b = zeros(b.shape[:-2] + (m, n_rhs + 1), dtype=b.dtype)
-> 2236     x, resids, rank, s = gufunc(a, b, rcond, signature=signature, extobj=extobj)
   2237     if m == 0:
   2238         x[...] = 0

~\Anaconda3\lib\site-packages\numpy\linalg\linalg.py in _raise_linalgerror_lstsq(err, flag)
    107
    108 def _raise_linalgerror_lstsq(err, flag):
--> 109     raise LinAlgError("SVD did not converge in Linear Least Squares")
    110
    111 def get_linalg_error_extobj(callback):

LinAlgError: SVD did not converge in Linear Least Squares```@void anvil inputs?
void anvil
t is 0..99, x is 100 unique numbers mean 4000
chilly shuttle
make our life easy and paste the code that's failing in full?
void anvil
    n = x.size
    t = np.arange(0, n)
    p = np.polyfit(t, x, 1)         # find linear trend in x
    x_notrend = x - p[0] * t        # detrended x
    x_freqdom = np.fft.fft(x_notrend)  # detrended x in frequency domain
    f = np.fft.fftfreq(n)              # frequencies
    indexes = list(range(0,n))
    # sort indexes by frequency, lower -> higher
    indexes.sort(key = lambda i: np.absolute(f[i]))

    t = np.arange(0, n + n_predict)
    restored_sig = np.zeros(t.size)
    for i in indexes[:1 + n_harm * 2]:
        ampli = np.absolute(x_freqdom[i]) / n   # amplitude
        phase = np.angle(x_freqdom[i])          # phase
        restored_sig += ampli * np.cos(2 * np.pi * f[i] * t + phase)
    return ampli, phase, restored_sig + p[0] * t

def get_rolling_fourier(close, n_predict, n_harm, fourier_length):
    fft_ampli = []
    fft_phase = []
    val = []
    for i in range(0, fourier_length):
        fft_ampli.append(0)
        fft_phase.append(0)
        val.append(0)

    for i in range(fourier_length, len(signal)):
        passed_signal = signal[i-fourier_length:i]
        ampli, phase, rest = get_fourier_extrapolation(x = passed_signal, n_predict = n_predict, n_harm = n_harm)
        fft_ampli.append(ampli)
        fft_phase.append(phase)
        val.append(rest[-1])
    return fft_ampli, fft_phase, val

len_signal = 200 #0 for everything
trans_feed = 100
trans_len = 5
predict_harm = 5

quick_test= test_df.Signal[-len_close-trans_len:-trans_len+1]

ampli, phase, value = get_rolling_fourier(close = quick_test, n_predict = predict_len, n_harm = predict_harm, fourier_length = trans_len)
Fails
chilly shuttle
when asking for help you generally want to produce the smallest possible self contained snippet that demonstrates your problem
half the time just doing that reduction will make you realize what the issue was
void anvil
It's a data issue causing 0s in the M*Mtransform matrix somehow. It runs for all but 1 subsets
I'm pretty sure: LinAlgError: SVD did not converge in Linear Least Squares
Is happening in the UV decomposition
It runs for 20,000 others, breaks specifically on the first subset there, then runs for the remaining 99
the easiest work around would be to regress x vs t then back out the t vs x regression or to replace polyfit
 trim escarp
Hi, just wondering if anyone has recommendations with regards to interpolating values from Lookup Tables in Python? I know that if we use dictionary, we can define the keys and corresponding values, but I can't seem to find an option that allows you to interpolate the values between them; for example if the values on the header are 1 and 2, and I am interested in the value for 1.5 (by doing some sort of linear interpolation).
lyric canopy
@trim escarp If we forget about the dict itself, then you have some sort of relationship where you map the keys (let's call them x) to the values (let's call those y). Do you have any idea of the relationship between x and y?
trim escarp
@lyric canopy I have included the following table for clarity. From a separate table, I have the category B and x value of 1.5, and so in the table below, we look along category B, but I then need to interpolate the value for 1.5, i.e. 150+((190-150)/2). I am looking for an efficient way of achieving this as in the separate table there are rows of categories and x values that needs to be matched to the table below so it needs to be automated. Thanks in advance for your help.
Category 1 2 3 4 5
A 100 190 250 300 400
B 150 190 210 350 490
C 80 120 150 180 200
 prisma verge
huh
people say that algorithms work faster, when computed on gpu
but... what about old GPU's?
like, if there's i7 and gt 9800, will the algorithm be computed faster on i7 or gt?
 polar acorn
Now I'm no expert but I think the biggest speed ups comes from using GPU's with CUDA. So if your GPU has CUDA it might be better. It also depends on algorithms though. In my experience GPU's help a lot for training convolutional models but for RNN's I haven't experienced the same benefits.
prisma verge
well, honestly, i'm running gts 250 here and it has 128 cuda cores
so, i guess... it can be used for ML?
even though i'll probably won't get into ml because it needs statistics math and i'm bad at that stuff
lean ledge
@prisma verge What makes some things faster on GPUs is the fact that GPU can easily run a lot of things in parallel
it has a lot of cores doing a lot of things at the same time
things that are sequential (eg, A requires B to be done which requires C to be done which requires ett etc) will be slower on a GPU
 rancid gust
Hey, can I ask a question about how to display my data like this? (the X axis)
I was able to do this using plt.xticks=([-1, -0.5, 1, 2, 4, 8, 16, 32, 64])
desert oar
@trim escarp you want linear interpolation? or something more general
@rancid gust you're using ax.set_xscale('log', basex=2)?
rancid gust
@desert oar I've tried plt.xscale('log',basex=2) but this has an weird behavior
desert oar
oh nvm
no
you want exponential scale
your data is already log scale
oh wait
hmmm. can you show the code you used for this
rancid gust
Yes sure
DeltaFF3 = np.array([-10, 20, 40, 80, 160, 320, 640, 1280]) # xdata
plt.figure()
plt.plot(DeltaFF3/20, IIP3, marker='o')
plt.grid(True,linestyle='--', which='both')
plt.xlim(-1, 70)
plt.ylim(-5, 40)
#plt.xticks([-1, -0.5, 1, 2, 4, 8, 16, 32, 64, 70])
plt.xscale('log', basex=2)
Where the xticks was used for the first image and the xscale for the second
I can't show the data I have in the IIP3 (yaxis) though
to you guys
desert oar
yeah thats fine
DeltaFF3 = np.array([-10, 20, 40, 80, 160, 320, 640, 1280])
xplt = np.arange(len(DeltaFF3))
plt.figure()
plt.plot(xplt, IIP3, marker='o')
plt.grid(True,linestyle='--', which='both')
plt.xlim(-1, 70)
plt.ylim(-5, 40)
plt.xticks(xplt)
plt.xticklabels(DeltaFF3/20)
try that
otherwise you can try some kind of 2^x x-scale but i'm pretty sure that doesn't come with matplotlib and you'd have to write it yourself (for questionable added benefit unless you plan to use it all the time)
rancid gust
it did not recognize xticklabels
desert oar
plt.gca().set_xticklabels(DeltaFF3/20)
weird that they wouldn't expose the ticklabels
i usually use fig, ax = plt.subplots()
desert oar
thats... not what i get
DeltaFF3 = np.array([-10, 20, 40, 80, 160, 320, 640, 1280])
IIP3 = np.log2(np.arange(len(DeltaFF3)))  # make up some data
xplt = np.arange(len(DeltaFF3))
plt.figure()
plt.plot(xplt, IIP3, marker='o')
plt.grid(True, linestyle='--', which='both')
plt.ylim(-5,40)
plt.xticks(xplt)
try that
desert oar
read over the code and try to understand why
rancid gust
Yes
desert oar
obviously you'll need to adjust x limits again
rancid gust
So
It got right but the tick spacing was not correct. By doing an xscale('log', basex=2) it adjusted itself but i need now figure out how to include the -0.5
Thanks @desert oar
rancid gust
I got it @desert oar thank you very much!
trim escarp
@desert oar Hi, thanks for your reply. I was looking for maybe a pre-existing Python package that could do interpolation.
desert oar
what do you mean by interpolation though
if its just linear you can use numpy or scipy
rancid gust
Hey, another question (now about jupyerLab). I am trying to enable code wrapping for the cells and I went to the user overrides in settings to do so. I found this stack overflow answer and tried both (https://stackoverflow.com/questions/48202340/enable-word-wrap-in-jupyterlab-code-editor)
{
   "codeCellConfig": {
      "lineWrap": "wordWrapColumn",
      "wordWrapColumn": 80
   }
}
And
{
   "codeCellConfig": {
      "lineWrap": "on"
   }
}
but both return the error [additional property error]. Anyone knows how to enable code wrapping in the cells?

Stack Overflow
I would like to enable word wrap for the code cells in jupyterlab, but do not manage to find how.
Already tried:
File --> Settings --> Text Editor --> User Overrides:{"lineWrap": true}, which tog...
 vestal axle
Anyone here familiar with R Studio, especially the packaged called Performance analytics?
desert oar
rstudio yes, but not that package
lapis sequoia
i'm learning how to use MLPClassifier()
If I have 4 classes to predict, do I need 4 layers?
lean ledge
you need 4 neurons on the output layer
number of layers depends on the complexity of the relationship between inputs and outputs
polar acorn
However I think sklearns MLPClassifier sets up the correct number of input and output units by itself. So all you need to give it is the hidden layers which might be whatever.
lapis sequoia
4 neurons is equivalent to 400 hidden layer sizes in sklearn?
polar acorn
What? Also most likely no? Hidden layer sizes for instance [5,6,5] means three hidden layers of 5, 6 and 5 neurons. If your input has length 10 and your output has length 4. That would make the entire network, 5 layers of 10, 5, 6, 5, 4 neurons in each layer. The hidden layers are in the middle and sklearn makes it so that the input and output matches. So you might use hidden_layers = [11] or hidden_layers = [100,100,100,100]. Experiment a bit and see what works.
lapis sequoia
What type of math should I learn to began learning ml
 snow ice
machine learning uses multiple: linear algebra, probability, calculus, and statistics
 uncut folio
Can someone tell me what a great "notebook" for a study in Informatics?
i want to still learn python in my fe
free time ^^
lapis sequoia
@snow ice my last math I took was geometry what should I learn after it
snow ice
Do you have a decent enough grasp of algebra?
uncut folio
@lapis sequoia If you can speak german i could give you the name of really great books for this ^^
lapis sequoia
I only know English
I took algebra classes yes. think it was algebra 1 a alg1b or something like that than liberal arts
snow ice
alright, i'd recommend doing a second level algebra course, then take trigonometry. Then you can move up to calculus then linear algebra
lapis sequoia
We did trig in geometry
snow ice
statistics/probability uses a lot of algebra and differential equations
was it just basic trig though? because you'll need to know it quite well ideally
uncut folio
I did find one with is similar to one of the "have to books!" for the informatics study in my country
@lapis sequoia Don´t know if the book is so good like mine but the subjects are similar
void anvil
I'm trying to plot with matplotlib but my Y axis is getting fucked up somehow.
Those first 2 values are 10000
Ah fucked up by a factor of 100 on my math
lean ledge
@snow ice statistics doesn't use differential equations at all
snow ice
In mathematical statistics it does
desert oar
if theyre asking about what they need to learn for machine learning, id says its very low on the priority list
would sooner learn stochastic processes
lean ledge
@snow ice do you have any link?
Because I know more than enough statistics and I've yet to ever seen differential equations there
And I've only come across differential equations in machine learning once in the famous neural ODEs paper (other than models for solving differential equations)
@snow ice
snow ice
I suppose it's less needed for machine learning, but differential equations are used when applying probability theory, and of course in stochastic differential equations, and econometrics
lean ledge
Stochastic DEs are way out there and won't be used in ML. When are differential equations used when applying probability theory?
Stochastic DEs aren't even relevant, they're applying statistics to DEs not DEs to statistics
I would hardly say "statistics uses a lot of differential equations"
snow ice
Fair enough, I suppose it was poor wording on my part. I should have said "statistics uses a lot of algebra and can use differential equations"
lean ledge
When does statistics use differential equations?
snow ice
I'm heading out of work now though, so farewell for now
lapis sequoia

Facebook's Pythia deep learning framework, which is now available in open source, is designed to benchmark natural language processing and vision AI models.
 gloomy snow
Why do u need to know calc for ml?
gloomy snow
@snow ice
earnest prawn
well things like the gradient descent are technically based on calculus
lean ledge
@gloomy snow you need a bunch of calc for ML depending on what you're doing
Optimisation by gradient descent is basically the foundation of the majority of ML

Towards Data Science
In the last few months, I have had several people contact me about their enthusiasm for venturing into the world of data science and using…
gloomy snow
Uhg
I love calc
And thing its really interesting and all.. i just always make simple mistakes
But dont mess up on hard parts
lapis sequoia
hi y'all can anyone give me a hand? i'm being dumb lol
here's the code -> https://pastebin.com/fDbgRxGD
implementing a simple perceptron, and I keep getting this error when multiplying my inputs and weights
that's what they look like
sorry new to this ty y'all
lean ledge
Whatever operation you're doing requires the last dimension of the first array (3,1) to be the same as the first dimension of the second array (3, )
lapis sequoia
👌 ty fixed it with flatten
 supple ferry
Or you can use reshape((1,-1)) @lapis sequoia
lapis sequoia
👌 ty
 pulsar jolt
Hello, may i get some help with adding an ai to my code>
 misty sonnet
@pulsar jolt AI's are really, really hard
If your teacher didn't want you to make one, don't
pulsar jolt
but we need to make one
misty sonnet
You could however make a "impossible to beat computer"
misty sonnet
No, not at all
AI's need to be taught stuff, this is done with matrices and hard maths
Not for a beginner in python
pulsar jolt
ok
 fervent mesa
i have done it in js
pulsar jolt
so can we make it then?
fervent mesa
very easy ...

GitHub
ai-flappybird-clone-tensorflow.js-phaser3. Contribute to rankuptuts/ai-flappybirdclone-tensorflow.js-phaser3 development by creating an account on GitHub.
pulsar jolt
is it possible to be made?
misty sonnet
@fervent mesa He needs to do it in pygame I think
fervent mesa

GitHub
PyCon 2003 paper and related resources about teaching Python to high school students with PyGame. - nyergler/teaching-python-with-pygame

GitHub
Minimax is a AI algorithm. Contribute to Cledersonbc/tic-tac-toe-minimax development by creating an account on GitHub.
mix these 2
dense rose
What class is this for?
pulsar jolt
computer science
dense rose
Hmm I'm thinking that your teacher wants you to make a simple rule based computer opponent.
dense rose
Yeah I wouldn't really say this is a data science thing.
pulsar jolt
um arc?
fervent mesa
..
desert oar
@tidal remnant think of a linear model
 tidal remnant
like y = x?
tidal remnant
ok isn't the error for the output neuron just the difference of it and the desired output?
tidal remnant
ok and then you go backwards through each of its connections
tidal remnant
ok
desert oar
this is just a linear model
no neurons no network
y = b1 * x1
that model is pretty easy, if x1 goes up by 1, then y1 goes up by b1
right?
tidal remnant
ok sure
desert oar
so what does that mean for when x1 is 0
tidal remnant
oof
desert oar
did you just answer your own question? 😛
tidal remnant
I'm super bad at math
desert oar
did you pass 5th grade
you can do this
think less
plug 0 in
what's what's b1 * 0
tidal remnant
but my problem with the biases concept is that the system seems like it would work without it
no I got that
lol
desert oar
lol alright
so lets push onward
what happens if you're modeling ice cream sales as a function of outdoor temperature
tidal remnant
positive slope
desert oar
sure
let's for illustration rescale and center y and x1
so that y = 0 means you're at mean ice cream sales for the year
and x1 = mean temp for the year
units are standard deviations
in this model
y = b1 * x1
you are forcing y to be at its mean whenever x1 is at its mean
i.e. you are forcing y to be 0 whenever x1 is zero
with a bias term, i.e. an intercept
y = b1 * x1 + b0
you don't have that problem
tidal remnant
what do means have to do with neurons
desert oar
cause a typical fully connected neuron is just a linear model
a multilayer perceptron is literally just linear models stacked on top of each other
desert oar
yes. this is why it's important to know the math and not just the code for machine learning
what's the equation for the output from a node
tidal remnant
ohh ok
wait maybe I don't understand what a layer is
is that one column of neurons?
tidal remnant
right I know those are kind of lame but good visualization
desert oar
yeah its fine
so pick one of the nodes
assume no non-linearities like cnn or max pooling
nodes/neurons w/e
you have a vector of input to the node x, what's the equation for the output
at least, what's the most common one
tidal remnant
well it's all the values of last layer's nodes times their weight.
That sounds like a multidimensional linear model though
since there's more than one mode
node*
tidal remnant
so what is the bias
desert oar
whether you treat it as a bunch of separate linear models with 1 output, or as a single linear model with multiple outputs, it's the same thing at the end of the day
the bias... is part of the linear model
and you use it because otherwise you get really bad linear models
tidal remnant
what part. what other part of a linear model is there besides y = mx + b whatever
desert oar
...what's b in mx+b?
desert oar
...the bias
tidal remnant
why do you need that
desert oar
did you understand my explanation of why you need it in a linear model?
(equivalent to a one-layer neural network with a linear activation function)
because the explanation is exactly the same, at least for the output layer. imagine if you omitted the bias/intercept (i.e. forced it to be 0) in the output layer. then your network outputs are all constrained in this really weird artificial way to be centered around 0
tidal remnant
what's wrong with that?
chrome kernel
Can neural networks be displayed graphically in python?
tidal remnant
you can display anything you want graphically in any turing complete programming language
desert oar
def linreg(x, y, intercept=True):
    xmean = np.mean(x)
    ymean = np.mean(y)

    if intercept:
        x_minus_xmean = x - xmean
        b1 = np.sum( x_minus_xmean * (y-ymean) ) / np.sum(np.square(x_minus_xmean))
        b0 = y - b1 * xmean
    else:
        b1 = xmean*ymean / np.mean(np.square(x))
        b0 = 0

    return b0, b1

x = np.arange(5)
y = x * 3 - 2

fig, ax = plt.subplots()
ax.scatter(x, y)

b0_intercept, b1_intercept = linreg(x, y)
_, b1_nointercept = linreg(x, y, intercept=False)

ax.plot(x, x*b1_intercept + b0_intercept, '--r')
ax.plot(x, x*b1_nointercept, '--b')

plt.show()
@tidal remnant
run that
and you tell me, which model is better
heh i think i actually did something wrong in the code but, it still illustrates the point
desert oar
you ask, why do you need the bias
thats why
without the bias you're pinning the intercept at 0
tidal remnant
around zero*?
desert oar
you're pinning the intercept to zero
convince yourself that at least in the output layer it's necessary
tidal remnant
if you have the bias you're just pinning it to a different number?
the bias number
desert oar
no
the bias is learned
thats the point
the bias is a learned parameter of the model
so the model figures out where to pin itself
 worn field
Hey! I'm wondering how to make something like this in python. When I do this as a single series, I rely on my np.random.seed to be able to replicate the initial randomness. But how should I go about in doing 1000 "replications"? Using 1000 "random" random.seeds from one initial random seed?
For a single series: ```
np.random.seed(666)
data = np.random.randn(500, 1)
data[200:401] = data[200:401] * np.sqrt(1+lambda)
and loop it all with the different lambdas
just using range(1000) for different seeds seems meh
I think I have a clue on how to get "random" numbers but how will I be able to reproduce it?
worn field
I' just gonna leave it at this: ```
import numpy as np
seed random number generator
np.random.seed(666)
size
n = 10
seeds for step 2
values = np.random.randint(0, 1645333507, n)
print(values)
data = []
for value in values:
    np.random.seed(value)
    new = np.random.randn(500, 1)
    new[200:401] = new[200:401] * np.sqrt(1)
    data.append(new)
print(data)
but for 1000, and for all lambdas
@ me if you have some suggestions 😃 highly appreciated
 tawdry sedge
I have been using seeds but what is it for ?
and my pygame env crashes when my nn runs but the text version of the game runs fine

GitHub
Contribute to NiksanJP/Snake-Game-DQN development by creating an account on GitHub.
 manic mason
seed allows you to get repeatable "random" numbers
So each time you start the app again you will get the same results in the same order, if the seed is the same
What is the exact error message that it crashes with?
tawdry sedge
cheers
Anyone know how I can get started with NEAT
I know RL but I wanna learn NeuroEvoloution things
 amber umbra
would this be the place to ask for help with a merge sort?
earnest prawn
im not exactly sure if you should ask here, however there is no channel specifically for algorithmic questions so either here or some helpchannel should be fine @amber umbra
amber umbra
Thanks, do you think you could give me a hand? I've done this in javascript, though it's been awhile. I'm getting a depth error right now and I can't quite figure out why.
earnest prawn
!t ask
 arctic wedgeBOT
ask
Asking good questions will yield a much higher chance of a quick response:
• Don't ask to ask your question, just go ahead and tell us your problem.
• Try to solve the problem on your own first, we're not going to write code for you.
• Show us the code you've tried and any errors or unexpected results it's giving
• Keep your patience while we're helping you.
You can find a much more detailed explanation on our website.
amber umbra
def merge( arrA, arrB ):
    elements = len( arrA ) + len( arrB )
    merged_arr = [0] * elements

    for item in range(0, elements):
        if item < len(arrA):
            merged_arr[item] = arrA[item]
        else:
            merged_arr[item] = arrB[item - len(arrA)]
    return merged_arr


def merge_sort( arr ):
    pivot = arr[math.floor(len(arr)/2)]
    print(pivot)
    arrL = []
    arrR = []
    for item in range(0, len(arr)):
        if item < pivot:
            arrL.append(arr[item])
        else:
            arrR.append(arr[item])
    if len(arrL) > 1:
        arrL = merge_sort(arrL)
    if len(arrR) > 1:
        arrR = merge_sort(arrR)
    arr = merge(arrL, arrR)
    return arr
Traceback (most recent call last):
  File "recursive_sorting.py", line 32, in <module>
    print(merge_sort([1,3,2,4,6,5,4,3,2,1]))
  File "recursive_sorting.py", line 26, in merge_sort
    arrL = merge_sort(arrL)
  File "recursive_sorting.py", line 26, in merge_sort
    arrL = merge_sort(arrL)
  File "recursive_sorting.py", line 26, in merge_sort
    arrL = merge_sort(arrL)
  [Previous line repeated 992 more times]
  File "recursive_sorting.py", line 17, in merge_sort
    print(pivot)
RecursionError: maximum recursion depth exceeded while calling a Python object
i got it
 stoic beacon
I have a super dumb question
I have the historical data for my department that includes the number of cases/tickets opened by day and I'd like to use that data to predict future opened cases during the week. I'm trying to figure out if Prophet is good for this or if sklearn will do the trick. It seems Prophet was designed for this kind of thing but reading the docs, it only seems to take one y and I'd like to use a few to try to predict y_hat
Opened Date  Day of Week  # of Cases
0  2018-12-28            4         NaN
1  2018-12-31            0         NaN
2  2018-12-31            0         NaN
3  2018-12-28            4         NaN
4  2018-12-17            0         NaN
That's an example output of the data but # of Cases isn't NaN. That was a bug that I fixed.
supple ferry
@stoic beacon you do not need to use Prophet for this specifically. There are lots of methods that could be applied to time series. You can use ARIMA method which is quite simple and straightforward
You don't need an industrial cutter for things you can do with just simple knife :)
 brazen moth
Hi guys, I'm learning neural networks with Keras, I've tried to make a test set and then make a prediction on that and it worked fine, but is there a way I can easily make the user insert an input, not a list? Because right now mymodel.predict() takes in a py.array
earnest prawn
model.predict will always take an array, (even a numpy one) that is how the function is defined, youll have to get the user input into a form suitable for model.predict simply
brazen moth
Maybe like this? test_data.append(input(str(i) + ': Enter data: '))
earnest prawn
thatd hardly work as input returns a str and your network will most likely require some form of numbers
you could also just read in a file with the data if you wanted for example
brazen moth
I use a scalar object to fit_transform it
earnest prawn
no thats not what i meant
what your code above would do is generate a list of strings which is most certainly not what you want
you gotta type cast it into an integer or a float (or maybe even make a list out of it using .split and type casts)
brazen moth
got it, weird thing is that it works if the list has more than 1 value inside
for i in range(5):
    test_data.append(input(str(i) + ': Enter person\'s age: '))
range(1) for example does not work correctly (wrong prediction)
but with range(5) or more than 1 it does work
stoic beacon
@supple ferry I'm new to this. I was hoping a library would help take away some of the harder things
desert oar
You should know the math behind whatever method you are using
At least at a cursory level
stoic beacon
I'm watching Andrew Ng's course but it's slow going
lapis sequoia
the basics are important
desert oar
I think sometimes I might come across as gatekeeping here, but really it just makes me uncomfortable seeing people using tools they don't understand
Because chances are eventually they will get an answer out of their work, but they won't have any idea how to handle it correctly or to even evaluate its correctness
stoic beacon
It's just a lot lol
I thought I understood at a basic level how neural nets worked but now that I'm not using a neural net I am a bit confused about the math behind supervised learning. Does it still use gradient descent to find a minimum value?
lean ledge
Supervised learning is a task not a model
Neural networks are still supervised learning (generally)
Supervised learning means something getting better by getting labelled data
But yes, generally most stuff that falls under supervised learning is about creating something that measures how well it performs and o ptimising your model until it optimises that
desert oar
Gradient descent is one of many methods for optimization
It happens to work well for neural networks
For other models, other methods might work better
stoic beacon
Thanks Raggy
I'm just not sure which model best fits my data. I've heard Linear Regression, Time Series Analysis, ARIMA
I know there isn't an end all be all and I could try them all but to start out lol
desert oar
Time series analysis is a general category of techniques including arima
stoic beacon
Yeah I figured
So just those two models have been suggested
I just have a feeling the math behind ARIMA may be more than I'm probably currently equipped to understand.
I generally have a difficult time understanding math lol
I did alright in high school and college but didn't go past calculus
desert oar
Understanding how the optimization is done is relatively unimportant
stoic beacon
Lol well that's good
desert oar
Just need to be able to understand what the model is doing
stoic beacon
Gatcha
desert oar
Simpler task in many/most cases
stoic beacon
I could do that
Just need to find a good place that explains what ARIMA is doing
Doesn't seem sklearn can do ARIMA either so is there a library that supports it? Also why did you suggest against Prophet?
desert oar
I didnt suggest against it
stoic beacon
Oh someone did
desert oar
Lack of arima in sklearn always struck me as weird... theres another lib for it let me find
stoic beacon
Statsmodels
stoic beacon
Yeah but then I'd have to learn a new language lol
Would linear regression be so bad for this data?
desert oar
Btw prophet probably does use arima internally
No, time series data violates some basic mathematical assumptions about linear regression

Machine Learning Mastery
A popular and widely used statistical method for time series forecasting is the ARIMA model. ARIMA is an acronym that stands for AutoRegressive Integrated Moving Average. It is a class of model that captures a suite of different standard temporal structures in time series dat...
stoic beacon
That one uses statsmodels lol
desert oar
I know I couldn't find the other library
If you really wanna get into it, I can't recommend this book enough https://otexts.com/fpp2/arima.html
 stoic beacon
I could use Prophet
Oh that does explain it well. I'll have to give it a read
I just wish prophet took in more data instead of just the dates and one y
stoic beacon
What's in chapter 9
I'm on my phone right now. Hard to look lol
What's more complicated kind of a model?
desert oar
It sounds like you want to make predictions based not only on past values but also based on other features
That's a more complicated model
stoic beacon
Yes indeed
What would that involve lol
I was originally gonna use an ANN but was advised against it
stoic beacon
@desert oar so what's the more complicated model? Ic an do some research
desert oar
hi sorry
stoic beacon
Btw here's what the data looks like
desert oar
thats just 1 series though
you can do that w/ statsmodels arima or prophet
if you need "covariates" then you should check out chapter 9 of the forecasting book
i dont know of any python implementations unfortunately
also check out chapter 12... it's just a bunch of useful tips, not very technical or mathy
desert oar
one time series
one variable
a "covariate" is something related to the variable you're trying to model
i.e. another variable you add to your model to make your predictions better
stoic beacon
Oh yeah I have those lol
i.e. day of the week
As an int
Ugh so maybe I can do a NN?
stoic beacon
@desert oar I'd like to use my other inputs so it seems I may have to either give up on this for now until I can understand more on how to implement that or use a NN maybe? Prophet can only use one y and idk how statsmodels works
My only other input is day of the week though
So maybe Prophet would do a decent job of predicting? I could use the built in holidays too
 olive willow
yo
desert oar
Yeah @stoic beacon you might have to back up and do some more research
Thats ok that sometimes how data sci goes
stoic beacon
What do you suggest I research
Cuz I'm stuck on model selection
I know time series is probably best
Or ARIMA
polar acorn
If you are new to time series and want a good enough model soon. I'd look into prophet. Read through the tutorial and try it out a bit. If you'd like to learn the classic theory of time series you should start by looking into ARIMA models.
stoic beacon
I couldn't figure out how to get Prophet installed on Windows without Anaconda lol
Is that the best way?
polar acorn
If you have a lot of time and a keen interest you could look into RNN's etc but that would be a considerable investment. If what you really want is just to a fit a adequate time series model to some data I'd go with prophet.
stoic beacon
Cuz I don't want duplicate installs of my data libraries like pandas and nunpy
Numpy
polar acorn
I remember struggling a bit with the installment to. But I think there are lot of info on getting the installation right if you look on stack overflow and similar places.
stoic beacon
I have multi variables though
Not just the one
Prophet only accepts one y
My two inputs are day of the week and cases per day
I think lol
polar acorn
Kind of confused here, y usually means your output variable. Do you want to predict cases per day? Then that is one y value per day.
If you want your model to take into account the day of the week. Then prophet can do that easily.
stoic beacon
Predict cases per day based on day of week
polar acorn
Thats no problem.
stoic beacon
For what
polar acorn
Using prophet that should be fine.
lapis sequoia
having trouble getting conda to work
stoic beacon
@polar acorn so I wanna predict cases by day of the week based on historical cases per day. That's doable in Prophet?
polar acorn
Yes
polar acorn
Good luck 😃
stoic beacon
Might just use Anaconda. Will it mess with my current installs of Numpy and whatnot?
My non-conda installs
stoic beacon
I can't seem to get Pystan to install lol
stoic beacon
Screw it ill do it via Anaconda
lapis sequoia
I have a classification problem with 5 classes and still has some major mistakes that can be solved by a human after gathering 500k samples. Is it an indication of insufficient sample or of overfitting?
I’m using XGBoost
No neural networks
Max depth 12
Estimators 300
Train acc. score: 99%
Test acc. score: 95%
Do I have to reduce complexity until train and test acc. score are equal?
stoic beacon
@polar acorn would an ANN be Overkill? Was gonna use Keras
Trying to think of a reason to make an NN for work related purposes lol
lapis sequoia
@lapis sequoia show code?
are the classes unbalanced?
what is the train test split..
what concerns you here? it's normal to have higher train accuracy than test.. but really need to see what you're doing to understand what's happening
lapis sequoia
@lapis sequoia XGBClassifier(n_estimators=500, max_depth=8, subsample=0.8, colsample_bytree=0.8, min_child_weight=100, eta=0.2, n_jobs=3)
5 classes
I just changed to 4 classes, and it predicted right
so it has something to do with the classes
lapis sequoia
do you have 5 classes in the data?
lapis sequoia
yes
np.unique gives 5 values
@lapis sequoia
this is very minimal info.. and I cant really get much context from this..
so if you heard the league of legends games, i'm trying to predict the role for each player (top, jungle, mid, adc, support) (5 classes)
based on spells, runes, and champion they're playing
can you share code Pastebin.com
sure

why have you defined carry and bot with 3?
in the role_dict
yea i tested it
5 classes vs 4 classes
I mean, if it's a different class.. shouldn't you have it as a different number
yea i know i just did a test
ok
to see if i properly predict this time
and it did
so that's why i'm thinking it's a class problem
low sample
it has ~500k samples
25 columns
train test error: 0.9471 0.94894
but it would always predict carry as jungle almost all the time
is the data unbalanced?
with a high probability
like.. do you have enough samples for each classes?
yea equally balanced
so the issue is it's not able to predict a certain class?
correct
sometimes with other classes, but it's mostly between carry and jungle
use one of the training examples..and check using that..
whether it predicts that particular class
yea i tried plenty
line 74
ok so its not able to discern the difference
but i can always fix it with logic, but i prefer to use all ml
yea
you need to encode the input data in a different way..
what are you using pca here for
was a test
it gives 0.39 on acc. score
without it it's 0.95~
i can give you the dataset if you want
i started with 200k samples and it predicted wrongly with a 0.90, so i scraped more, and added about 300k more, but the probability went higher on the wrong class
overall accuracy went up from 0.9 to 0.95 though
so you're worried about overfitting
i'm thinking i'm overfitting so i added more rows
but it didn't help with the specific rows
predicted on wrong class with 90%
and it's obvious to me it's a carry, not a jungle
two things
either you need to encode the features in a different way
or..
your features need to picked so when you train with them they will be useful for discerning the differences b/w classes
for second, you mean i have to narrow my feature list?
to reduce dimension/
and encoder, i'm familiar with one hot encoder, but do you have a suggestion for my case?
my dataset has number between 1 to 8300
so you mean to make them closer?
yes.. read : curse of dimensionality
the more dimensions you have, the more examples you need
give me an example of the features.. and I'll see if I can suggest an encoding
[81, 4, 12, 8300, 8200, 20, 4, 11, 8400, 8100, 37, 14, 4, 8200, 8300, 58, 12, 4, 8000, 8100, 126, 4, 12, 8200, 8100, 0]
or line 73
so if i'm having problems with 500k samples with 25 features, how many samples would I need to use all features?
500k samples 25k features.. 5 classes
*25 features
oops
anyway.. there's some math involved.. I need to look it up..
but, a lot
would it be reasonable at 2 millions?
and for encoder, robust scaler works?
it deals with outliers like 8300 and 1
yeah 2.5 mil seems like it a reasonable number of samples
ok i see
whats the range of values
for each feature
are they all the same
1 to 8300
no they're not
for 1 feature it can go from 1 to 400
i think that's the largest in range
but i read that xgboost doesn't need any preprocessing?
or is that a subtle lie?
depends on the application
can't use a hammer to cut wood
ah i see
ok i just did a count to see class balance
and result is
TOP_SOLO 101733
JUNGLE_NONE 129678
MIDDLE_SOLO 100609
BOTTOM_DUO_CARRY 109470
BOTTOM_DUO_SUPPORT 110553
it's not widely unbalanced, but maybe it can a problem with jungle having too much samples?
no that's a non issue
if you had 5-8 features.. this would've worked
ah i see awesome
and for the encoder, what would you suggest?
you mentioned the features represent the spells runes and champions?
yes and participantId
to tell classifier which person to predict based on the other participants' spells rune and champs
 warm orbit
oh nice role prediction?
lapis sequoia
yea
hmm you'll need to look it up.. personally, I would look again at how each feature is represented..
then look to combine them somehow if needed
gotcha
thanks for your help @lapis sequoia very much appreciated
np!
always here
 somber zodiac
is anyone familiar with Xavier initialization for weights?
desert oar
I know what it is
chilly shuttle
xavier is pretty straightforward
it's also mostly superseded by He
unless that's also been superseded and I missed it
somber zodiac
I just wanted to ask why it is 1/sqrt(number of nodes from previous layer), when, if you do the math, you find that the variance should be 1/n
Here's a link to the top result - https://stats.stackexchange.com/questions/326710/why-is-weight-initialized-as-1-sqrt-of-hidden-nodes-in-neural-networks?newreg=d84fa537b0b04797b3f4166ae8891f4b

Cross Validated
I am currently reading Make your Own Neural Network by Tariq Rashid.
He explains that instead of choosing weights randomly at a range of -1.0 to 1.0, initial weights should be in the range $ {1 ...
Also in code, I've always seen 1/sqrt(number of nodes) e.g. model['W1'] = np.random.randn(H,D) / np.sqrt(D)
@desert oar @chilly shuttle sorry to ping but any ideas?
also hi again salt rock! i remember your name. it's been a long time
desert oar
i thought it was 1/n
desert oar
i think its people being lazy about variance vs standard deviation
desert oar
do you have an example where it's used in code?
somber zodiac
Yep I'll post it
It's from Karparthy's Pong AI:
model['W1'] = np.random.randn(H,D) / np.sqrt(D)
model['W2'] = np.random.randn(1, H) / np.sqrt(H)
H, D is a 200x6400 matrix. D is the input and is an 80*80 pixel array. H is the number of nodes in the first hidden layer (200)
There is only 1 hidden layer and 3 layers in total
SO input layer has 6400 nodes, 1st hidden layer has 200 nodes, output is one node
somber zodiac
ah so would it have mattered in code? If it was /np.D would that have been fine too?
so divide by variance, not standard deviation
desert oar
N(0, s^2) = s * N(0, 1)
if that makes any sense
if you multiply a gaussian random variable by s it multiplies the variance by s^2
somber zodiac
ohh
desert oar
so dividing by sqrt(D) means dividing the variance by D
desert oar
think about "standardizing" a variable... you subtract the mean then divide by the std dev
you don't divide by the variance
that's just a special case of this rule
somber zodiac
yeah
 outer marsh
Okay so I was trying to find the coefficient of zipfs law from a set of frequencies
I tried a lot of things but eventually gave up on np.polyfit and linear regression because the data-density wasn't equal on logarithmic scale
Then I came across someone using MLE
def loglik(b):
    # Power law function
    probabilities = x**(-b)

    # Normalized
    norm_probabilities = probabilities/probabilities.sum()

    # Multiply the vector by frequencies
    l_vector = np.log(norm_probabilities) * freqs

    # LL is the sum
    l = l_vector.sum()

    # We want to maximize LogLikelihood or minimize (-1)*LogLikelihood
    return -l

s_best = minimize(loglik, [2])
They used this
But I don't get why you multiply the probabilities by the frequencies
desert oar
whered you see that?
it looks like what they're doing is, norm_probabilities has 1 element per unique word
but the log likelihood is over the entire dataset
so maybe you had 1000 occurrences of "cat"
but if you juse used norm_probabilities you'd only be including one such occurrence in the model
this way you're including all 1000 occurrences in the log likelihood
outer marsh
Not precisely
@desert oar
I know that it tries to fit a parameter to some existing data
desert oar
you understand what conditional probability is, right?
desert oar
sure
maximum likelihood estimation for a parameter b finds the value that maximizes P(y | b)
outer marsh
Oh I see
desert oar
that expression P(y|b) is called the "likelihood"
that is, you want to find the value of the parameters for which the data is the most likely
outer marsh
Yeah I see
desert oar
so if you have 5 data points y1 ... y5 then the likelihood of the dataset is P(y1 | b) * ... * P(y5 | b)
so usually we like to use log-likelihood which is log P(y1 | b) + ... + log P(y5 | b)
since thats much easier to work with
outer marsh
Yeah
So that is why they were normalizing the data? To make it into "probabilities"?
desert oar
well no
thats just the expression for zipfs law
but thats the intuition behind the expression
outer marsh
Yeah true
desert oar
that denominator is always the same for every observation, its just the numerator that changes
outer marsh
So then they multiply each rank by it's corresponding frequency
desert oar
well hold on
re: why they are called "normalized"
because the denominator is constant, you can think of the numerator as an "unnormalized" probability distribution
and the denominator just normalizes it to lie within [0,1]
the multiplication by frequencies is what gives us the log likelihood
desert oar
each element of norm_probabilities is, yes
but you only have one term per unique word
but you need one term for every word in the document/corpus
not just every unique word
outer marsh
Yeah, so you multiply the probabilities by how much they appear
desert oar
precisely
outer marsh
Ah
desert oar
rather than manually summing over all words
outer marsh
Yeah
desert oar
since frequencies here are apparently already pre-computed, it's a bit more efficient
potentially a lot more efficient actually
outer marsh
And why does minimizing the sum of those probabilities give you the best parameter?
Oh no wait
You want to maximize the sum of the probabilities
And minimize the -(sum of probabilities)
@desert oar Wait so how does negating the sum turns it into a minimization problem?
desert oar
np
fun fact: the ordinary least squares solution to linear regression is the same as the maximum likelihood solution to a gaussian linear model
so if you fit a garden variety linear regression model, you are implicitly assuming that the target variable has a gaussian distribution around yhat
outer marsh
Interesting 
desert oar
logistic regression is also maximum likelihood actually
cross entropy loss is equivalent to maximum likelihood for a categorical distribution
et al
oh and ridge regression is a bayesian gaussian linear model with gaussian priors on the parameters
😉
desert oar
thats partly why im pointing all this out -- boring old statistics is still important
even in the world of neural networks, you're just making p(y | b) really complicated
and using different methods to optimize the log likelihood
theres a lot of really nice equivalence between the "loss minimization" approach to machine learning and the probabilistic/statistical approach
outer marsh
I do think statistics is really cool
There's just a lot of other math branches that I also want to learn 
I'm a way to ambitious high school student from the netherlands lmao
outer marsh
Yeah that's true
desert oar
math aint going anywhere
outer marsh
I'm currently going through a calculus textbook next to school
And persuing programming as a hobby
But yeah, I (hopefully) have a long life before me so I have time
lapis sequoia
Any good udemy courses or courses in general
which teaches data sciences along with math?
desert oar
im not aware of any that do both concurrently
lean ledge
@lapis sequoia Learn them separately
Any resource that tries to juggle both is bound to be either too long and/or crappy in quality
 deft harbor
I think the series by imperial college of London on Coursera covers both
lapis sequoia
thanks
 young vapor
are there any strange behavious with pandas Series #median ?
i'm getting a strange result
silent swan
how so
deft harbor
Si, need more info.
 keen garnet
There are very good books about Python and data science. I have a few pdf books about programming, some are about OOP and others about Data-Science, but I'm not sure if I am allowed to share them through this server. Am I breaking any rules if I do? Just to be safe.
 heady shuttle
Has anyone here implemented a residual neural network on Keras? I have some queries..
 tranquil glade
<@&267628507062992896> <@&267629731250176001> <@&295488872404484098>
better learn to do your work
 naive swallow
!ban @tranquil glade ping spam
 vapid ibex
Pinged
arctic wedgeBOT
:incoming_envelope: :ok_hand: permanently banned @tranquil glade (ping spam).


 summer plover
!ban 566556336612179978 ping spam
arctic wedgeBOT
:ok_hand: permanently banned @tranquil glade (ping spam).
 deep mist
Lol three of us
 lunar oyster
Big oof
 queen vigil
Oof pinged 13 times
lapis sequoia
lmao
deft harbor
What an exciting life that person must live
lapis sequoia
oh.. seems he pinged from different channels..
granite basin
if I have two unlabeled datasets split into test/training, say a set with spoken words, and a set with written words. And a list with boolean values that tells me if the word + audio match or not in the training set. What would be an applicable model to classify other pairs of audio + image as matching or not? I've tried just adding the data together and normalizing it but that obviously doesn't work. And I'm not sure what to google/stackoverflow for more information
desert oar
so your dataset is effectively like this:
audio_sample | text_image | is_pair
you can train a classifier on that (ideally down-sampling the non-paired cases, which will probably be too many to even enumerate unless your data is very small)
granite basin
I down sampled it so half the data is_pair == true, and half is false
desert oar
yeah, im not really familiar with how audio classification is done nowadays, but you can probably feed them both into a model...
i wonder if it would be possible to learn by setting the image as the label for the audio or vice versa
depending on what your goal is
granite basin
I tried that but it didn't perform any better than 50%.. so it was just guessing
desert oar
whats your ultimate task?
granite basin
expose a model to a unseen dataset of 15000 written numbers and spoken numbers, and return either true if they match, or false if they dont
desert oar
hmm ok.. then maybe the classifier is the way to go
if you wanted to generate written numbers from spoken, or vice versa, then maybe youd use the bidirectional thing
granite basin
well there's no labels for the numbers so i don't think that would work
I feel like I'm missing something because everything I think of ends up with 'oh yea I dont have the labels for the numbers'
so not sure if I should just normalize the data, throw it together and then classify it as false or true, or something else
desert oar
what is the purpose of matching those 15000 pairs
granite basin
it's a graded competition in my masters, lowest error rate receives the highest grading
granite basin
well if they were labeled i could just make 2 models, one for written and one for spoken, and match the results
desert oar
oh
yeah
classifying pairs seems like a sane first approach
as long as you can come up with a way to model that. i assume a neural network is the only way to do it without driving yourself crazy
thats outside what i have experience with though
olive willow
yo guys need some help here
import numpy as np
import pandas as pd
from pprint import pprint


path = 'E:\CODING\code_projects\[DATA]\pokemon.csv'
data = pd.read_csv(path)
array_data = np.array(data)
Total = list()
# pprint(array_data[0, 4])
for array in array_data:
    Total.append(array[4:5])
pprint(Total)
output:
array([304], dtype=object),
 array([514], dtype=object),
 array([245], dtype=object),
 array([535], dtype=object),
 array([680], dtype=object),
 array([680], dtype=object),
 array([600], dtype=object),
 array([600], dtype=object),
 array([600], dtype=object),
 array([600], dtype=object)]
the thing is that I would want to add every number you see to a grand total, and Idk how to do it because it's a string and I can't convert it.
desert oar
if the numbers are beaing read as strings by read_csv, that means somewhere in your data there are strings
normally if pandas sees that all the values are numbers, it will convert to a numeric data type automatically
that said, if you just want to add a series use pd.Series.sum()
olive willow
nwm I have the answer
desert oar
ok... well whatever you're doing, it looks way more complicated than it needs to be