#data-science-and-ml
1 messages · Page 197 of 1
 lapis sequoia
 rancid gust
Hey fellows data analysts, what you guys use as IDE/Text Editor?
I have been using Spyder for a while but I wanted to have only one platform for both data analysis and general programming
There is such integrated platform that has a somewhat resemblance with spyder/matlab that can be enabled/disabled whenever I want ?
 supple ferry
In a nutshell, you cant have both with full features. Spyder is very good for writing scientific code, and you can try other full IDEs like Pycharm, Vscode and etc. They also have support for scientific coding but they are not specialized
 austere raptor
Hello, using Matplotlib and numpy how can I calculate the slope of a fitted linear line I plotted?
 lyric canopy
How did you fit it?
Most OLS fitting procedures used for drawing the lines do that by first returning the slope and intercept
 dense rose
I just have a question about the Jupyter notebooks in Google Colab.
And why I sometimes get stuff highlighted pink.
lapis sequoia
can you show a screenshot
supple ferry
@lapis sequoia did you solve your prev problem?
lapis sequoia
not really no.. didnt get into it.. working on a different one now
lyric canopy
ordinary least squares
austere raptor
Alright, after looking into it, I get it, thank you. But I have one more question, is it possible to find the error of polyfit? (error of the slope/ coefficient)
supple ferry
@austere raptor those models are fit making several assumptions. One of them is the error term is normally distributed.
lyric canopy
@austere raptor That depends on what you're trying to do. As @supple ferry said, as soon as you start talking about inference (generalizing the results beyond this sample), then the assumptions of the model get important.
austere raptor
Well for example, I am scattering the data of a physics experiment, and then fitting a linear line (polynome first degree), and I seek the slope of that line as a value, I would also like to know what is the relative error of this slope -> slope = value * (1 +- relative error )
For example I am testing Ohm's law so I'm graphing U(I), where the slope is R (resistance), I would like to also know the error of resistance (slope) value
austere raptor
Maybe I should've mentioned that the scattered points have an error too* (which is the measurment error), but that isn't the main concern right now.
as you can see the line(slope) can move anywhere between the dashed lines
When doing manually the position of the dashed line is determined by the data points which deviate most from the fitted one, and if data points themselves have an error, the dashed are gets bigger
Is there any way to caluculate this... I hope I am displaying my problem clear enough.
supple ferry
@austere raptor , Yes, you can have it. Usually, regression outputs not only coefficients, but also their coinfidence intervals, aka, bounds. You can take lower bounds and get your lower line from it, then take your upper bound and get upper line
there may be a ready function for that, but I couldnt come up with one from top of my head
austere raptor
@supple ferry what is the "Std. Error" in that picture?
lyric canopy
It's the estimate of the standard deviation of the sampling distribution of the coefficients
Which sounds complicated, but it's not that difficult
austere raptor
yea, isnt that the thing I'm lookiing for?
supple ferry
the thing you will need is confidence interval part for every coeff
there you can see actual value, then minimum and maximum
lyric canopy
It may be, but once you get to this point, your assumptions become important
austere raptor
the confidence interval is in absolute value right?
lyric canopy
I'm not sure what you mean by "absolute value" in this context
austere raptor
relating to the coefficient...
anyway this is probably what I'm looking for, will check later, thank you for the help.
supple ferry
so your lower bound equation for line will be: -0.0070411 * weight + 36.22283
lyric canopy
So, assuming that all the assumptions hold we need for an accurate estimation of the confidence interval, then we can say that if take a lot of samples and repeat this process (calculating the coefficients, the std.errors) for every sample, that we will "catch" the true population slope within those two boundaries 95% of the times.
Whether or not this specific confidence interval has done that, we don't know
Now, this is strictly frequentist statistics, but that's what we're doing here
supple ferry
again, assuming that your error is normally distributed.
It can be not the case, but for 95 % of time we presume it is
austere raptor
yes, I see...
 inland loom
Is there anyone here proficient in Spark, specifically PySpark, that would be able to assist me in taking a 1 column data frame and splitting it into a 2 column data frame? I'm working with a SMS Spam Collection data set and I'd like to split the data frame into the columns [labels, sentence]
lapis sequoia
how many rows do you have..
inland loom
around 5.5k, but i found a solution - used Spark CSV by Databricks, didn't realize it would also work for text files
lapis sequoia
that's not a lot of rows.. you dont need spark for that... you could do that with Sheets :v
 spare arch
if I train a pre-trained tensorflow model this is alter the weights correct?
how do I get the weights after I train my model
 atomic blade
can anyone suggest a better/simpler visualization library than plotly? it does the trick, but I am limited to a certain number of API calls. I need to graph and embed mysql db data into a flask app template
dense rose
@lapis sequoia https://i.imgur.com/6HuWDBT.png
 supple ferry
@atomic blade Seaborn. If you prefer grammar of graphics, then there is an Api for Vega library for python. Forgot its name
 void anvil
Seaborn or matplotlib. Seaborn looks way better and has a lot more customizability, but it is a tiny bit harder to use.
 nimble field
hey im trying to do a thing that looks at a player name and school and catagorizes it using networkx
import pandas as pd
import networkx as nx
import matplotlib as mb
# Ignore matplotlib warnings
import warnings
warnings.filterwarnings("ignore")

df=pd.read_csv("CollegePlaying.csv")
df.head()
g=nx.from_pandas_edgelist(df,source='playerID',target='schoolID')
nx.draw(g)
plt.show()
here is my code but it doesnt draw, any ideas?
spare arch
does anyone know
how to get the weights of a tensorflow object detection model
after you've trained it
lapis sequoia
hey everyone, weird question, but does anyone have any resources on writing / building data science programs? I do a lot of ad-hoc sort of data pulls / manipulation but I'm curious about what else is out there
if that makes any sense
 shadow surge
Guys i need help graphing my logistic regression function
X = X_train
Y = y_train
# Plot the decision boundary. For that, we will assign a color to each
# point in the mesh [x_min, x_max]x[y_min, y_max].
x_min, x_max = X[:, 0].min() - .5, X[:, 0].max() + .5
y_min, y_max = X[:, 1].min() - .5, X[:, 1].max() + .5
h = .02  # step size in the mesh
xx, yy = np.meshgrid(np.arange(x_min, x_max, h), np.arange(y_min, y_max, h))
Z = classifier.predict(np.c_[xx.ravel(), yy.ravel()])

# Put the result into a color plot
Z = Z.reshape(xx.shape)
plt.figure(1, figsize=(4, 3))
plt.pcolormesh(xx, yy, Z, cmap=plt.cm.Paired)

# Plot also the training points
plt.scatter(X[:, 0], X[:, 1], c=Y, edgecolors='k', cmap=plt.cm.Paired)
plt.xlabel('Sepal length')
plt.ylabel('Sepal width')

plt.xlim(xx.min(), xx.max())
plt.ylim(yy.min(), yy.max())
plt.xticks(())
plt.yticks(())

plt.show()
Im getting a key error here
it thinks x has 2 features when its expecting 3000
that is because x is CountVectorizer that i used to transform the data
How the heck do i fix this
shadow surge
Mind if i get some help in creating a graph for my logistic regression model???
shadow surge
here we go
from sklearn.feature_extraction.text import CountVectorizer
cv = CountVectorizer()

X = cv.fit_transform(dataset['_ingredients'].values)
y = dataset.cuisine.values

print(cv.get_feature_names())
print (X.shape)

for multi_class in ('multinomial', 'ovr'):
    clf = LogisticRegression(solver='sag', max_iter=100, random_state=42,
                             multi_class=multi_class).fit(X, y)

    # print the training scores
    print("training score : %.3f (%s)" % (clf.score(X, y), multi_class))

    # create a mesh to plot in
    h = .02  # step size in the mesh
    x_min, x_max = X[:, 0].min() - 1, X[:, 0].max() + 1
    y_min, y_max = X[:, 1].min() - 1, X[:, 1].max() + 1
    xx, yy = np.meshgrid(np.arange(x_min, x_max, h),
                         np.arange(y_min, y_max, h))

    # Plot the decision boundary. For that, we will assign a color to each
    # point in the mesh [x_min, x_max]x[y_min, y_max].
    Z = clf.predict(np.c_[xx.ravel(), yy.ravel()])
    # Put the result into a color plot
    Z = Z.reshape(xx.shape)
    plt.figure()
    plt.contourf(xx, yy, Z, cmap=plt.cm.Paired)
    plt.title("Decision surface of LogisticRegression (%s)" % multi_class)
    plt.axis('tight')

    # Plot also the training points
    colors = "bry"
    for i, color in zip(clf.classes_, colors):
        idx = np.where(y == i)
        plt.scatter(X[idx, 0], X[idx, 1], c=color, cmap=plt.cm.Paired,
                    edgecolor='black', s=20)

    # Plot the three one-against-all classifiers
    xmin, xmax = plt.xlim()
    ymin, ymax = plt.ylim()
    coef = clf.coef_
    intercept = clf.intercept_

    def plot_hyperplane(c, color):
        def line(x0):
            return (-(x0 * coef[c, 0]) - intercept[c]) / coef[c, 1]
        plt.plot([xmin, xmax], [line(xmin), line(xmax)],
                 ls="--", color=color)

    for i, color in zip(clf.classes_, colors):
        plot_hyperplane(i, color)

plt.show()
Problem is its saying x has 2 features per sample
expecting 3051
X here is a count vector
 analog helm
anyone worked with Perlin noise before? A while ago I was fiddling around with perlin noise, and managed to get nice greyscale images like you see online. Now I'm re-implementing it within a larger library, but trying to test it, I'm getting more or less garbage.... I remember you had to be very fiddly with the inputs you gave to the perlin function. No whole integers, have to increase your coordinate values very slowly... so I'm not sure if I somehow broke something in implementation, or just am having a complete brainfart and forgot how to step through the coordinates to get coherent noise.
I have the following bit of code:
from module.perlinmodule import PerlinModule
import numpy as np
from PIL import Image

height = width = 512
    perlin = PerlinModule(seed=783)

    noise = np.empty((width, height))

    for x in range(width):
        for y in range(height):
            noise[x, y] = perlin.get_value(0.0199+(x/0.0199), 0.0199+(y*0.0199), 0.0199)

    img = Image.fromarray(noise, 'L')
    img.show()```

But I get more or less garbage. Example of the output: https://i.imgur.com/PwZpVmj.png
Zoomed in a bit (the image its self, not "scaling" the noise): https://i.imgur.com/XIl8hFW.png

So pretty much just white noise, with those strange vertical bars.
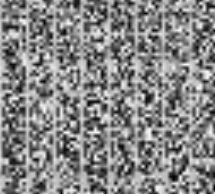
I'm using the straight, textbook implementation of perlin noise, no octave stuff here.
is my looping structure sensible here? Ie, i must have broke something on the actual perlin implementation side? Or am I doing something dumb with the way I loop through the values
 dim beacon
@analog helm we probably need to know about your PN implementation
analog helm
Literally just straight ported it from the man himself: https://mrl.nyu.edu/~perlin/noise/
I can show code if you want, but first wanted to make sure that my loop structure was sensible, and if it were, would point towards a PN implementation problem.
dim beacon
@analog helm why the x / 0.0199 though?
analog helm
The only things I (knowingly) changed in the implementation was to provide a randomized 0-255 table shuffle based on seed, and changed the grad() function to use if blocks rather than the overly complicated bitwise stuff
and as I remember it, perlin noise is very "low frequency". If you step by whole numbers, the noise is very "fine grained"
dim beacon
yeah but why a division instead of a multiplication like you did for y?
analog helm
so if you want something like this: https://flafla2.github.io/img/2014-08-09-perlinnoise/raw2d.png
you need to step through the coordinate system fairly slowly
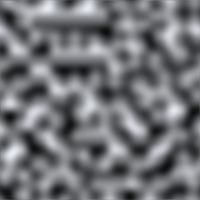
Woopsies. Yea, that's a booboo, but that isnt the main issue. I was toying around with stuff trying to get it to work, and forgot to change it back to the right operator. I fixed it just now and reran it, and my result looks exactly the same as before
dim beacon
please show your PN code anyway
analog helm
is just under 100 lines more than i should be pasting in directly?
analog helm
its longer than the original implementation for a couple reasons, I'll just paste it into a pastebin

like I said, I use that "lookup table" in grad rather than Perlin's fancy bitwise stuff, since this way is much faster to calculate
so that adds more lines
dim beacon
uh
wtf is that 💀
       return lerp(w, lerp(v, lerp(u, grad(self.table[aa], xf, yf, zf),
                                    grad(self.table[ba], xf - 1, yf, zf)),
                            lerp(u, grad(self.table[ab], xf, yf - 1, zf),
                                 grad(self.table[bb], xf - 1, yf - 1, zf))),
                    lerp(v, lerp(u, grad(self.table[aa + 1], xf, yf, zf - 1),
                                 grad(self.table[ba + 1], xf - 1, yf, zf - 1)),
                         lerp(u, grad(self.table[ab + 1], xf, yf - 1, zf - 1),
                              grad(self.table[bb + 1], xf - 1, yf - 1, zf - 1))))
straight from Perlin's implementation!
dim beacon

Perlin noise is a type of gradient noise developed by Ken Perlin in 1983 as a result of his frustration with the "machine-like" look of computer graphics at the time. He formally described his findings in a SIGGRAPH paper in 1985 called An image Synthesizer. In 1997, Perlin w...
try to use this one as a reference
that kind of code is impossible to read
analog helm
fair enough, i know i got it to work before using this method, but I'll try this way
its exactly the same result?
dim beacon
well, that's a classical implementation
you also have the "theory" just above, so that you can understand it and understand the algo
analog helm
wow, this is quite a bit different. It doesnt even seem to use a byte table?
analog helm
are they straight up different noise algos, or does the one shown on Wikipedia provide the same exact results, just with a more optimized method?
dim beacon
nah they are a bit different, they just rely on the same "basis"
I can't zoom in your picture so I can't tell, but counting the pixels between the "lines" might help you find out the origin of that issue
 heady bone
PunchFox you're getting vertical bars?
analog helm
that, and just getting garbage noise in general
dim beacon
that may be caused by a rounding issue at some point
heady bone
Is your array uint8
analog helm
tthe one I fill with noise? I didn't supply any arguments, so I assume numpy defaulted it to float
heady bone
I remember having vertical bars sometime ago and I had to convert my images to integers 0-255
analog helm
and there are 7 pixels between each line
well, perlin function outputs values between -1 and 1 if i recall
heady bone
PIL uses integer arrays I think
analog helm
i could have sworn I was doing something similar to this, and it automatically determined the proper color ranges based on the scale of the values, but maybe I'm forgetting something and used some other method that did such for me, not straight PIL....
i guess i can try scaling it to a byte and see what happens
huh... that definitely changed the output, but not to what i expected...
got this now... https://i.imgur.com/CrlUo9A.png
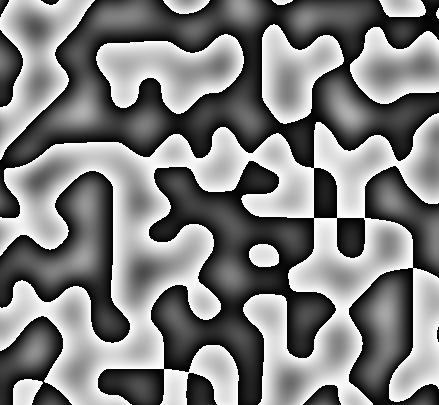
which is still not what i expected, but certainly closer to perlin noise. Looks like perlin noise with some extra processing... guess its just down to how PIL is rendering the values
now Im trying to figure out what I was using before that rendered the values on a scale....
it basically just looked at the range of values and then mapped it onto a scale so that the lowest value was black and the highest was white
heady bone
Your depths suddenly become very bright, looks like an overflow. Just a guess though
analog helm
assuming -1 to 1 values, I just did
image_map[x,y] = (noise[x,y]+1)*256
oh, wait, duh. 128
oh man, there we go!
thanks so much!
PIL would have been the last place I'd have suspected.
I'm still curious what I was using before that automatically scaled it for you, but whateverm I'm happy it's working now
heady bone
Well I was having this problem and I wasn't using any noise so I thought it would be that. 🙂
analog helm
great intuition then, haha! Thanks
not related, but holy crap, I really do see why everyone does their noise in other languages.... python is slow as hell for this.
I remember this taking a fraction of the time in Java. Oh well.
dim beacon
yeah bare Python is not adapted to heavy computations
you may try PyPy or Numba to improve this
but most of the time we use NumPy for heavy computations
analog helm
does numpy have the ability to "port" all that raw perlin code into numpy functionality?
my only real familiarity with numpy so far is in its arrays
I was thinking of using Cython or something, but would much rather stick to base python if possible
 chilly shuttle

Stack Overflow
I'm trying to produce 2D perlin noise using numpy, but instead of something smooth I get this :
my broken perlin noise, with ugly squares everywhere
For sure, I'm mixing up my dimensions somewhere,
also with numba+gpu you can produce perlin noise interactively if you felt like it
shadow surge
Hey guys can i get some help in plotting my logistical regression classifier
it keeps saying X = 2 Features and expecting 3051 which is correct it does have 3051 features
from sklearn.feature_extraction.text import CountVectorizer
cv = CountVectorizer()

X = cv.fit_transform(dataset['_ingredients'].values)
y = dataset.cuisine.values

for multi_class in ('multinomial', 'ovr'):
    clf = LogisticRegression(solver='sag', max_iter=400, random_state=42,
                             multi_class=multi_class).fit(X, y)

    X = cv.fit_transform(dataset['_ingredients'].values)

    # print the training scores
    print("training score : %.3f (%s)" % (clf.score(X, y), multi_class))

    # create a mesh to plot in
    h = .02  # step size in the mesh
    x_min, x_max = X[:, 0].min() - 1, X[:, 0].max() + 1
    y_min, y_max = X[:, 1].min() - 1, X[:, 1].max() + 1
    xx, yy = np.meshgrid(np.arange(x_min, x_max, h),
                         np.arange(y_min, y_max, h))

    # Plot the decision boundary. For that, we will assign a color to each
    # point in the mesh [x_min, x_max]x[y_min, y_max].
    Z = clf.predict(np.c_[xx.ravel(), yy.ravel()])
    # Put the result into a color plot
    Z = Z.reshape(xx.shape)
    plt.figure()
    plt.contourf(xx, yy, Z, cmap=plt.cm.Paired)
    plt.title("Decision surface of LogisticRegression (%s)" % multi_class)
    plt.axis('tight')

    # Plot also the training points
    colors = "bry"
    for i, color in zip(clf.classes_, colors):
        idx = np.where(y == i)
        plt.scatter(X[idx, 0], X[idx, 1], c=color, cmap=plt.cm.Paired,
                    edgecolor='black', s=20)

    # Plot the three one-against-all classifiers
    xmin, xmax = plt.xlim()
    ymin, ymax = plt.ylim()
    coef = clf.coef_
    intercept = clf.intercept_

    def plot_hyperplane(c, color):
        def line(x0):
            return (-(x0 * coef[c, 0]) - intercept[c]) / coef[c, 1]
        plt.plot([xmin, xmax], [line(xmin), line(xmax)],
                 ls="--", color=color)

    for i, color in zip(clf.classes_, colors):
        plot_hyperplane(i, color)

plt.show()
I have been trying this for 3 days now =*(
nimble field
why do you declare x equal to that twice?
probably not the problem just noticed that o.o
lapis sequoia
I'm trying to read a g-sheet into a pandas df. G-sheet is converted into a list of dicts with column name : value contents by gspread, after that I convert it into a pandas dataframe, but for some reason pandas sorts columns by their name. How can I prevent that?
Sheet - http://ipic.su/img/img7/fs/kiss_6kb.1556000226.png
Result - http://ipic.su/img/img7/fs/kiss_1kb.1556000371.png


Maybe I don't need pandas for this task at all, but since I started doing this I want to get to the bottom of it
dense rose
Is there anything to properly support jupyter notebooks with git?x
analog helm
is this a good place to ask about Numba, or not related?
 paper niche
@dense rose one thing that I find helps with version control is to clean the outputs of your notebook when you push it up. nbclean does this automatically for you once you set it up. makes the diff a bit cleaner

still a pain to resolve merge conflicts though
 midnight atlas
I'm encountering an error message when attempting to use CUDA with Theano, would appreciate any help
nimble field
Post it
 icy tree
good day folks, has someone a good explanation about feature types in ML? examples would be neat
or rather would you count a ZIP-Code as numerical feature or nominal feature? I'd rather say nominal but not sure
icy tree
got a link for categorical features?
 fossil hull
@icy tree how you handle categorical features would depend pretty heavily on what method your model is using, some (like decision trees) handle them more readily than others
Quick question for anyone who's compiled tensorflow before — do you remember offhand how many jobs it took in total? bezel is telling giving me [8,860 / 8,869] but the right number increases every time the left one does 
icy tree
hmm okay
fossil hull
what are you trying to do? I'm pretty new to ML but maybe i could point you in the right direction
 eager heath
Hi guys ! I wan’t to create a game with unreal engine and have a AI powered with deep learning / self learning / q learning (i’m not sure about the term but I want it to learn from saved game and learn from itself by experimenting in some form of learning world (like the AI have all function in hand and don’t know what they does. For exemple, the AI will have all move function, her current world position, her objective position and a score based on her distance from the objective point (I will not actually do that because ue4 have auto generated pathfinder but I will probably do that to learn her to shoot)). Soooo, my question is do you have any clue how to do that (I plan on using tensorflow) ? Any good tutorial ? And finally can I store the generated neutral network, distribute it over the network to players machine and have them run the AI without installing some crazy software ? 😄 Thanks you (sorry for my bad English)
(By AI learning without knowing what her doing I mean like in this video : youtu.be/K-wIZuAA3EY )
 wicked flare
@eager heath What you're asking about is not trivial. If you are serious, the best advice I can give is to learn the fundamentals of machine learning first. That would better equip you with the understanding you need to figure out how to implement your idea. Coursera has a free (I think still) online machine learning course given by Stanford, which starts on April 29: https://www.coursera.org/learn/machine-learning

Coursera
Learn Machine Learning from Stanford University. Machine learning is the science of getting computers to act without being explicitly programmed. In the past decade, machine learning has given us self-driving cars, practical speech recognition, ...
It's a full college level course, but I think you need nothing less to have a decent chance to succeed.
As for your last question, a neural network is just a data structure. You can definitely transmit the weights over the internet and run it on a client. You need the implementation of the network on the client machine, of course. I don't know what you mean by "crazy software".
eager heath
Okay thanks 😃 yeah of course I will do this step by step starting with some very simple AI. By crazy software I mean something like Nvidia Cuda or thinks like that.
wicked flare
Not necessarily, no.
 dreamy tartan
Hi everyone,
Im in trouble with feature selection. Mostly i have mixed datasets with numerical and categorical features. I was following that way, first check the correlation for numerical features and eliminate if they correlate each other. Next step was check the chi square result for categorical features and eliminate them if they p value is not less than 0.05.
But there are some missing points like i think i need the check numerical features also with their p value and if there is any way i should check correlation between categorical features.
Am i right? What are you doing when you encounter such a situation?
lapis sequoia
Hey! Is anyone here familiar with convolution in NumPy?
 neat aspen
is there a fast way to add a row to a large dataframe? i notice as my dataframe grows in size, so too do my row adds
right now i'm calling df_out.loc[df_in.index[0]] = df_in.iloc[0]
basically df_in is a dataframe of length 1, df_out is a very large dataframe
im trying to add df_in to df_out but every approach i take increases in processing time as the dataframe grows
i've guaranteed that the index in df_in is larger than every index in df_out, so, i figure a quick add right to the end should be fast
but it doesn't seem to be the case. i've already optimized this to be in-place and in-memory
append and concat seem like they would be useful, but neither of them work in-place, sothey actually are both bad options as the gc by itself takes up too much time
neat aspen
a followup to the above: i never found a way. i actually don't think there is one--if you constantly add rows to a df, no matter what, it seems to keep increasing its execution time proprtional to the size of the df. rather, i just made an empty list ddf = [] where i curated all my partial dataframes ddf.append(partial_df) (so, ending up with ddf = [pdf0, pdf1, pdf2, pdf3, pdf4, pdf5, ..., pdfn] and then just called df = pd.concat(ddf) at the end. it's faster than any row add i've found
basically, optimized concat with N 1-row pdfs > iloc row set > two-df concat (large, small)
 vale swallow
Hello, I am a bit of a newbie using Panda's Dataframes and was wondering if someone might be able to help with some basic syntax stuff?
df.loc[df.column == criteria] is my data subset, and then I want to iterate through it
df.loc[i,'column'] would be the way I have done this (within a while loop)
basically I want to combine the two
paper niche
can you be more specific about your problem or what you're trying to achieve? there should be a better way to do this than to manually iterate through the rows
 echo thorn
Is there a way to cap the size of the arrows in matplotlibs' quiver?
vale swallow
Update: solved it by just handing it off to a separate df
 jade chasm
hey guys, Im looking for a way to solve this equation with a dynamic amount of "J" criteria. aBj and ajW are known variables, the rest are not. Ive been trying for 2 days now, but I think its above my league/knowledge. If anyone has any tips that'd be greatly appredicated.
Ive been trying sympy, but I cant manage to get that to work. I thought pulp would do the trick, but it isnt a linear system 😦
the question is basically 'find E, Wb, Ww and Wj for all J"
 torn musk
@jade chasm for sympy, if it did not work simply because it did not respond immediately, just let it run for a while
does anyone have tips for working on large jupyter notebooks? because i'm working on a long project (20 pages when 'print as pdf') and its really annoying to scroll up and down all the time
@jade chasm my first instinct would be to solve it for specific values of j using sympy and then generalize that
jade chasm
@torn musk thanks for the insights. I have tried it with specific values, but cant seem to get it to work sadly.
torn musk
@jade chasm it has infinite solutions
What type of solution are you looking for? Inequalities in j+3 dimensions, or numeric values?
analytical or numerical solutions?
E, Wb, Ww, Wj = f(aBj, ajW, j)
paper niche
@torn musk do you have nbextensions installed? I use a combination of "collapsible headings" and "table of contents" for navigation within the notebook
torn musk
@paper niche yes i have it installed
i use table of contents
there were 2 versions, i was able to use the one which generates html from a javascript script, but not the one that creates a popup window
i was not able to get that one working
paper niche
oh i see. collapsible headings will keep your lengthy notebooks shorter too; that's tthe main one i would suggest you use
torn musk
i was able to use this https://kmahelona.github.io/ipython_notebook_goodies/ipython_notebook_toc.js but its not very useful
paper niche
table of contents is just there for jumping across large sections
torn musk

GitHub
Random goodies for use in iPython Notebooks. Contribute to kmahelona/ipython_notebook_goodies development by creating an account on GitHub.
paper niche
i just collapse the other headings when I'm not using them
torn musk
which one are you using
for table of contents?
dang how did you get it working
i tried but it didn't
paper niche

GitHub
A collection of various notebook extensions for Jupyter - ipython-contrib/jupyter_contrib_nbextensions
is that because you don't have this installed, or you just didn't realize this screen was an option?
torn musk
i've used extensions before
but i just used command line
i didn't know about the screen
paper niche
torn musk
oh
paper niche
it' should be on the home screen. otherwise, open up a notebook, then it's under "edit -> nbextensions config"
anyway, if you get this working, I recommend "collapsible headings" and "table of contents"; ;the combination of the two should make long notebooks manageable to navigate
torn musk
thanks i'll try it
jade chasm
@torn musk Im looking for numerical solutions
sorry for the late reply btw.
this would be an example., then the question would just be find w1,w2,w3 and ksi
I cant seem to get it to work however.
 plain parrot
Hi guys i need to pass value from sqlite3 to kivy textinput field how do i do it plz
torn musk
@jade chasm it has infinite solutions...
do you want an infinite list of numerical solutions
or do you just want like one of the solutions
jade chasm
Mhm, I believe I want to minimize E. So it is an optimization problem.
The problem is, I'm not too good a calculus, so I'm not sure how to tackle this problem I guess.
 odd crag
Anyone knows a good library to extract points in 3D form .ply format (from 3D scanner)?
for py
 blazing anchor
@jade chasm I'm not an expert on this, but maybe hill climbing algorithms would work well.
They might already be implemented in pytorch and tensorflow
Just set the error to e
Have the neurons be ws
Maybe
@odd crag plyfile or pymesh could work.
odd crag
I get a MemoryError while using plyfile
even though I have at least 10GB of free memory
size of my ply file is 500MB @blazing anchor
blazing anchor
Mqybe try pymesh. Since its more complex you may be able to partially load it
Or, is your python exe 64 bit?
odd crag
@blazing anchor ty, will do
lapis sequoia
Is it possible to get matplotlib's visual data without saving a plot as an image
like i would like to have the image data of a matplotlib chart, without saving the image
is that possible?
paper niche
define image data. you mean the data that you use to make the matplotlib plot?
lapis sequoia
no
so i have data, then i get a matplotlib chart
then i want the visuals like a png data or something from that chart
but in order to do that you'd need to do plt.imsave()
but i don't wanna save an image everytime i do that, is there a diffrent way?
paper niche
so image data = png file, but you want to automate the saving of the png image?
oh wait. you mean plt.show()?
what do you have now? can you show us your code?
lyric canopy
If you litetally want access to the byte representation without saving it, you could use a io.BytesIO object.
If it's not that or what @paper niche is suggesting, I'm not sure what you mean.
paper niche
it reads to me as if you want to see the plot, but you've been saving it as an image everytime to visualize it, instead of using plt.show()
lapis sequoia
it might be what you mean @lyric canopy 3
yes
but i don't want plt.show
because
i need the acctuall data of the visual chart
so you could get that by doing imsave
get the png file
and read the png file
but i don't wanna save everytime i do it
because i'd be saving a lot of pictures, yes i could remove them
paper niche
oh okay, then try what @lyric canopy suggested then
lapis sequoia
but it just doesn't sound efficient and i would like to know if there is another way around
yeah i am not firmiliar with a io.bytesIO?
lyric canopy
I'm on mobile and heading to a meeting, so I can't help you with it at the moment. However, there are probably a couple of examples out there, since it's often used for image data.
lapis sequoia
oki
@paper niche do you know any of the bytesio?
i just took a look at it, however it seems to be the same as PIL? also you still need a saved image for it to work if i read the docs roughly @lyric canopy
paper niche
no, not enough. though, I'm still not 100% sure what your objective is nor what your desired output is
paper niche
what's your visual? a line plot? a scatter plot? a contour plot?
lyric canopy
No, you don't have to save it to file first. The point of such an oi object is that you save it to memory rather than to disk, so you gave the bytes readily available in memory.
It's used specifically for cases where you'd otherwise would have to have a temporary file.
A lot of people use it with PIL, but that's just a common use case.
But, I'm also unsure what you actually want to do, so it may be an xy problem.
paper niche
anyway it seems like you can
buf = io.BytesIO()
plt.savefig(buf, format='png')
maybe
since savefig allows a python file-like object according to the docs
lyric canopy
Yes, that should work. Maybe you need to specify the format (PNG)
lapis sequoia
Ok so the buf = "the ram" where you save it to
lyric canopy
I think it's format='png'
paper niche
^; thanks
lapis sequoia
so whats the diffrence...? You still save it?
lyric canopy
Well, you wanted the file data in memory
lapis sequoia
also is it a png then still?
lyric canopy
Without saving it first.
It's the exact same bytes you'd have when saving a PNG yes.
lapis sequoia
well i am looking for the most efficient way where my hard drive doesn't want to kill me for making and deleting thousands of images at a time
lyric canopy
You don't use your hd in this solution.
lyric canopy
Well, you need to store it somewhere
lapis sequoia
and how do i clear the RAM from that stuff again?
lyric canopy
Just like you would with any Python object, the GC takes care of it when you lose all references to it.
This is just an object in memory, just like your dataframes, integers, and so on.
Anyway, meeting has started and I need to pay a bit of attention
 dense marsh
Hey all, I'm trying to fit data to to a a quadratic function. For whatever reason I can't seem to explain, the fitting becomes awful at best. I've peeked at a few SO threads, and most of what they suggest is to feed scipy suggested values or changing the type of function. I'm fairly confident that my suggested fit is adequate, but like I said, it could very well be wrong.
#!/bin/python
import matplotlib
import matplotlib.pyplot as plt
import scipy.optimize as opt
import numpy as np

matplotlib.use('Qt5Agg')

def func(x, a, b, c):
     return x ** 2 * a + b * x + c

data = np.genfromtxt("insertion_random.csv", delimiter=',')[:,:-1]
x = data[0]
y = data[1:]

optimizedParameters, pcov = opt.curve_fit(func, x, y[0]);

plt.plot(x, y, 'ro', label="data")
plt.plot(x, func(x, *optimizedParameters), label="fit", color="blue");

plt.xlabel('Element to sort (N)')
plt.ylabel('Time (S)')
plt.legend()
plt.show()
(Also, my data looks like this:)
32768,65536,98304,131072,163840,
5.37938,5.38561,5.38344,5.38914,5.38546,
21.5499,21.5779,21.5747,22.0149,22.3413,
50.2045,50.921,52.62,51.5093,51.2276,
90.0589,91.0799,93.5421,92.6237,91.8542,
141.611,141.546,146.291,146.75,140.739,
 chilly geyser
?? Why is your line so far from data?
dense marsh
Haha, I know right. No idea.
chilly geyser
Is it because of this --> y[0]
dense marsh
Hm?
I can't give it the entire y
ValueError: object too deep for desired array
Traceback (most recent call last):
  File "./plot.py", line 16, in <module>
    optimizedParameters, pcov = opt.curve_fit(func, x, y);
  File "/usr/lib/python3.7/site-packages/scipy/optimize/minpack.py", line 744, in curve_fit
    res = leastsq(func, p0, Dfun=jac, full_output=1, **kwargs)
  File "/usr/lib/python3.7/site-packages/scipy/optimize/minpack.py", line 394, in leastsq
    gtol, maxfev, epsfcn, factor, diag)
minpack.error: Result from function call is not a proper array of floats.
I'm not really sure, I'm not a scipy master, sorry
dense marsh
Hey dude
You're onto something
y[0] looks like this
[5.37938 5.38561 5.38344 5.38914 5.38546]
And in that case, it'd be a pretty good fit
Looks like I might need to transpose it first
So that I fit it on an entire column
There!
chilly geyser
Nice.
lapis sequoia
Is anyone of you working on some project? What kind?
And what for?
I am asking because I am just starting in data science after completing some small projects in basic Python and
But I can't seem to find anything productive(project work that counts as practical experience) to do in data science or machine learning.
I am looking for some work that I could put in my resume to get an internship or entry level job.
Can someone suggest me about it?
I can help you in your project and can learn something in return.
 elfin mantle
Hi, can anyone please help me understand why my simple rnn implementation doesnt pass, gradient check ?
I have implemented everything and yet only some parts (weights for the outputs) pass the gradient check and other weights (wah, wax) dont pass it.
I have commented everything and provided a minimal example to demonstrate this here :
my code : (doesnt pass gradient check)
https://onlinegdb.com/rkJj5PHi4
here is the implementation that I used as my guide (this is from coursera and passes all the gradient checks, however mine doesnt!! ) :
original code : (passes the gradient check)
https://onlinegdb.com/SyzETvSiN
At this point I'm completely hopeless, since I have no idea why this is not working! I have been trying to get this to work for like the last two weeks nonstop!
I'm a newbie in Python so, this could be why I cant find the issue.
I'd be extremely grateful if anyone could give me a helping hand in this.
Thank you all in advance and please excuse me if this was a long/spammy message.
 light plover
Hi, anyone here expert in PyQtGraph?
 arctic wedgeBOT
ask
Asking good questions will yield a much higher chance of a quick response:
• Don't ask to ask your question, just go ahead and tell us your problem.
• Try to solve the problem on your own first, we're not going to write code for you.
• Show us the code you've tried and any errors or unexpected results it's giving
• Keep your patience while we're helping you.
You can find a much more detailed explanation on our website.
blazing anchor
So, should I employ a standard neural net that doesn't quite fit the task at my work? Or a special neural net I mostly already made myself that fits the problem better, but is less tested?
 obtuse notch
Hey guys, I was trying to use Sklearn on Google App Engine but had issues as SKlearn has C modules. I was wondering if you know any alternatives to SKlearn which is made purely from Python? I only need to do multiregression.
chilly shuttle
you want to go the other way around and drop app engine
 oblique jackal
Does anyone have links to some (Airbnb's) Airflow projects I could study or do to get better with automating data analysis and data aggregation? Otherwise what's the best way to learn after Ive read up on the documentation?
 oblique socket
Does anyone know about Sturge's Rule?
lyric canopy
What do you want to know about Sturges' Rule, @oblique socket ?
lapis sequoia
hi
how can i determine if in my python [value, value, value] is any value higher than 1?
like i have [data,data,data, etc] and i wanna check if any of the values are higher than one
is this possible without a loop?
if so, how?
 polar acorn
You can use a list comprehension and any to do it like so: any([d > 1 for d in data]). If data is your list.
 drifting surge
How to create a plot like this https://i.imgur.com/WHcrVmm.png?
Not necessarily the same visually, just some sensible way to have text labels on one axis
 ripe vessel
Taking from the documentation of matplotlib.pyplot:
import matplotlib.pyplot as plt plt.plot([1,2,3,4])
plt.ylabel('some numbers')
plt.show()```This creates a basic line graph, documents one side, then shows it.
drifting surge
I need a label for each point (instead of x axis numbers), not just one label
ripe vessel
Looks like you're looking for Plot.set_xticklabels(label_names: iterable, rotation=int)
 craggy geyser
Anyone here with good knowledge of pandas?
I have a dataframe where I need to extract certain rows based on the value of one column. The table below is an example:
| row | ID | timestamp | ms | data |
|---|---|---|---|---|
| 0 | A | 1542654800 | 571 | 6 |
| 1 | B | 1542654833 | 570 | 8 |
| 2 | C | 1542654834 | 550 | 8 |
| 3 | B | 1542654850 | 571 | 2 |
| 4 | A | 1542654851 | 570 | 2 |
| 5 | C | 1542654851 | 550 | 2 |
| 6 | C | 1542654920 | 571 | 9 |
| 7 | B | 1542654922 | 570 | 9 |
| 8 | A | 1542654925 | 550 | 9 |
I need to exract every group of rows with three rows where timestamp is equal to each other, +- 5. So in the table, row 0 has no close matches, row 1-2 do, but they lack a third close match, while row 3-5 is valid, and row 6-8 is also valid. So from this table I would like to get out row 3-5 and 6-8 as separate dataframes.
Currently I initalize an empty python list that I fill with matching dataframes. First I extract all triplets where the timestamp is equal, so:
df_triplets = df[df.groupby("timestamp")["timestamp"].transform("size") > 2]
And then i run a for-loop of df_triplets.timestamp.unique() where I add the dataframe of each timestamp to my so-far empty list of dataframes.
I then do the same for every timestamp that two rows share: df_doubles. I then iterate through df_doubles.timestamp.unique() and I check for every timestamp if there exists a timestamp in the range 5 seconds before, or the range 5 seconds after. If it exists, I add this dataframe to my list.
Lastly I iterate through the remaining dataframe (where all timestamps are different) and check each for 1-2 before and after, and add to list.
This works, but it does seem a bit overcomplicated, and not very pandas-like. Do any of you have suggestions for better ways of doing this?
paper niche
are the timestamps ordered? i.e., in the three rows that you extract, is the middle time <= the third timestamp?
craggy geyser
yes
they should be ordered from the get-go, but in case they are not, I sort by timestamp before I do anything else
paper niche
i can give it a try, but can you provide a small example dataset?
craggy geyser
yes, sure, just give me a sec. Thank you! 😃
How would you like to get it? And what is small? < 30 rows or < 5000 rows? etc.
paper niche
hmm yeah around 30 rows should be sufficient;
ideally also let us know the desired output with that example (i.e., which row numbers are in the output)
craggy geyser
ideal output is a list where each element of the list is a dataframe of three rows from the original dataframe. Index does not matter, but the columns does. If that makes sense?
paper niche
right, ok
craggy geyser
the data is originally stored in a database, and there are some steps to extract it, but I think the easiest way will be to just make a dict which a similiar dataframe can be constructed from, but I'll ned 5 minutes
paper niche
sure no hurry
craggy geyser
ok I'm done, making a gist of the code now
I also made a list with the desired output in the bottom, where I manually extracted what I would like to have in the end
might be some mistakes since I did this manually, but should be ok
in any case, thanks a lot for the help!
lapis sequoia
hi
how should i scale all my values down to a range of -1 to 1
like i could do scaling, but i don't know the min/max of the values
supple ferry
@lapis sequoia , MinMax scaler has feature_range argument in which you can give your desired output range. From documentation :
https://scikit-learn.org/stable/modules/generated/sklearn.preprocessing.MinMaxScaler.html
Parameters:
feature_range : tuple (min, max), default=(0, 1)
Desired range of transformed data.
yes
lapis sequoia
and it will scale it to 0 and 1
supple ferry
not just one number 😃
lapis sequoia
i'd assume it would lose it's "mean"
yeah
between 0 and 1 😃
like how would it be able to maintain the mean if it doesn't know the min and max?
paper niche
@craggy geyser try
ts = df['timestamp']

last_indices = ts.index[ts.diff(periods=2) <=5]

outputs = []
for last_index in last_indices:
    outputs.append(df.loc[last_index-2:last_index, :])

print(f"Found {len(outputs)}")
for subdf in outputs:
    print(subdf)
gives me
Found 6
    timestamp  ID  data   ms
0  1542659759  33   8.2  658
1  1542659760  34   8.2  663
2  1542659760  32   8.2  642
    timestamp  ID  data   ms
6  1542661510  33   9.0  689
7  1542661511  34   9.0  687
8  1542661511  32   9.0  678
     timestamp  ID  data   ms
9   1542663549  33   8.2  729
10  1542663550  34   8.2  725
11  1542663550  32   8.2  715
     timestamp  ID  data   ms
14  1542665994  33   7.0  772
15  1542665995  34   7.0  770
16  1542665995  32   7.0  761
     timestamp  ID  data   ms
17  1542666774  33   7.6  790
18  1542666775  32   7.6  775
19  1542666775  34   7.6  783
     timestamp  ID  data   ms
20  1542667676  33   7.0  806
21  1542667677  34   7.0  802
22  1542667677  32   7.0  793
wow
supple ferry
@lapis sequoia , i did not understand your question
paper niche
basically the idea here is to use diff/do all the math on the timestamps column, then get those indices to extract out from the original df.
craggy geyser
so if I understand this correctly, ts.diff with periods=2, finds all matches where timestamp is valid, and then these indexes are used to get the actual dataframes?
yeah right
this is very nice
lapis sequoia
@supple ferry how is minmax scaling able to scale data where he doesn't know the min max of the possible data?
paper niche
right, so diff(2) calculates the difference between elements 0 and 2, and so on
checking against <=5 returns a column of boolean, which we can then extract out the indices from
supple ferry
@lapis sequoia
import numpy as np
from sklearn.preprocessing import MinMaxScaler

a = np.random.randint(0, 100, (100, 1))
scaler = MinMaxScaler(feature_range = (-1, 1))

b = scaler.fit_transform(a)

b.max()
b.min()
# should give you -1 and 0.999888 (close to 1)
@paper niche can't thank you enough! I've really struggled for a while for a good way to get the data. I tried experimenting with diff, but I did not find a good way to do it. This was beautiful
paper niche
don't sweat it, happy to have helped
supple ferry
@lapis sequoia , do you have your data? if you feed it your data it doest it itself
lapis sequoia
yes
but it's min and max are unknown, so i am wondering how its scaling data without knowing the minmax?
supple ferry
is it online? by online i mean you get new values by time ?
craggy geyser
@paper niche an additional question, if you wouldn't mind: is there a similarly easy way to change 1 timestamp to be the same as the other two? In the case where to are the same, and one is different. In the case where all three are different, setting the highest and lowest equal to the middle
I guess setting all three equal to the middle one would cover both cases
paper niche
hmm yes, I think so. lemme mull on it a little
but do you want this change reflected in the subdf's or the original df
paper niche
i think the naive way would be to hook this into the for loop:
ts = df['timestamp']

last_indices = ts.index[ts.diff(periods=2) <=5]

outputs = []
for last_index in last_indices:
    subdf = df.loc[last_index-2:last_index, :].copy()
    subdf.loc[:, 'timestamp'] = ts[last_index-1]  # <-----
    outputs.append(subdf)

print(f"Found {len(outputs)}")
for subdf in outputs:
    print(subdf)
but i'm pretty sure there;'ll be a vectorized way to do this.. it's eluding me at the moment, but i'll let you know if i think of anything
craggy geyser
Ok! In any case, this seems reasonable too. I have to do additional checks most likely, so it might be that this way is the most suitable :+1:
paper niche
ts = df['timestamp']

last_indices = ts.index[ts.diff(periods=2) <=5]
all_indices = last_indices.append([last_indices-1, last_indices-2]).sort_values()

mask_values = [i for i in range(len(last_indices)) for _ in range(3)]
df.loc[all_indices, 'mask'] = mask_values
df.head()

# replace with middle value
df.loc[last_indices-2,'timestamp'] = ts[last_indices-1].values
df.loc[last_indices,'timestamp'] = ts[last_indices-1].values

# get list of subdf
outputs = [v.drop('mask', axis=1) for _, v in df.groupby('mask')]

# ------------------------------------
for subdf in outputs:
    print(subdf)
@craggy geyser you may or may not find this more useful for your use case. at least there's no more for-loop 😃
paper niche
haha yeah, sacrificed a little on readability. but at this point it;s just a fun challenge for me
😋
craggy geyser
I'm glad that it's fun, and I'm really glad for the help too! 😃
now I just need to go through it and understand
ok, so you do like before, but now you add the index before and the index 2 places before each matched location. You then have a for-loop that goes range(number of matches). For each, you make 3x the count number, so: 0, 0, 0, 1, 1, 1, ...
paper niche
right,
all_indicesare just like thelast_indicesfrom before, just that they include the-1, and-2indices as well.- the
mask_valuesjust enumerate the subdf groups of three:[0,0,0,1,1,1,2,2,2,...], which I assign as a column to the original df.
the values will be N.A. if the row index don't correspond toall_indices. - the reason for the
mask_valuesis so that I can group-by that value later to extract out thesub-df(this replaces the for-loop)
craggy geyser
ahh
it is that last part I was starting to grasp, but not really understanding yet
paper niche
you can just print out the output after every line to track the ouputs
ah groupby returns a "zipped" list of (mask_val, dataframe)
have a look at
for _, subdf in df.groupby('mask'):
    print(subdf)
yeah I started to do that, and I was getting there. It makes sense to me! So basically, by using groupby, in the end you get all the sub-dataframes
paper niche
yep yep. the mask_vals are simply enumerating the unique "groups of three"
which we can just extract using a groupby operation
i had to drop off the mask column from every subdf as well after I was done with it
craggy geyser
very smooth, I have to say
yeah that's what you do in the list comprehension I see
I can tell you that the way you originally solved the "get groups of timestamp" problem already sped-up my code significantly! So this is hugely helpful
paper niche
sure thing, you can always just fall back on the old one if you need to do those checks you mentioned earlier; you can always optimize it after
craggy geyser
true!
the checks is also a bit tricky, at least in terms of false positives etc. Basically I need to keep all instances of ms > 990 or so, because sometimes it is correct that the timestamp is not the same. But often all 3 will have approx. the same ms value, but 1 of them will have timestamp 1 or 2 seconds drifted off. There's no universal solution, as it can theoretically happen that there should be a complete second inbetween. But I haven't really explored this yet, so it's a bit early to say
paper niche
right i see, so what we've done so far is just the "first-cut", so to speak.
interesting problem you have there!
craggy geyser
yes, it's quite interesting! Besides this last hurdle though, with the valid ms filtering, everything is ready 😃 It's for a TDOA positoning algorithm implementation
paper niche
very cool 👍
 spare garnet
Hi Group, Is there a function to spread an integer across zeroes, then repeat? For example, I have "3, 0, 0, 2, 0, 0, 0, 1, 0" and want it to become 1, 1 ,1, 0.5, 0.5, 0.5, 0.5, 0.5, 0.5
chilly shuttle
oh that's an interesting one
Stack Overflow
I have the following array
a = [1, 2, 3, 0, 0, 0, 0, 0, 0, 4, 5, 6, 0, 0, 0, 0, 9, 8, 7,0,10,11]
What I would like to find the start and the end index of the array where the values are zeros
you could build a naiive but still fairly fast solution off this @spare garnet
there's probably a pure numpy way to do this but i'm too tired to attempt
spare garnet
Thanks! I'm primarily an R person, and it's pretty quick to do it in there .
x <- c(0,0,3,0,0,2,0,0,0,1,0)
ave(x,cumsum(x))
Would be surprised if there isn't a quick way in Python as well, will give that a shot and keep on searching as well
spare garnet
ALONE, it returns the average for the vector, and replaces each point in the vector with that average
x <- c(0,0,3,0,0,2,0,0,0,1,0)
ave(x)
[1] 0.5454545 0.5454545 0.5454545 0.5454545 .....
Gotta be something like that in Python too? That might be a good starting point
chilly shuttle
i mean yes, but that won't do what you're asking for...
spare garnet
Right, not just by itself
supple ferry
In [1]: import numpy as np

In [2]: a = np.array([0, 1, 2, 3, 4])

In [3]: np.full(a.size, np.mean(a))
Out[3]: array([2., 2., 2., 2., 2.])
how does either cumsum or ave know what a consecutive run looks like and why does it care
supple ferry
@spare garnet , you mean this ?
spare garnet
@supple ferry yea! that solves the first part, that's doing what R's "ave" is doing
@chilly shuttle I'm not exactly sure how it does that
chilly shuttle
find that out, because it doesn't make sense
what does ave(x,y) do
what does ave([1,1,1]. [0,1,2]) do
spare garnet
A vector of (1,1,1)
chilly shuttle
yeah so it doesn't know anything about consecutive runs..
spare garnet
Ok, interesting
chilly shuttle
i don't see how it can do what you're asking for unless you missed a step
this is the literal translation of what you suggested but as you can see it is not aware of runs so it doesn't do what you asked for
sorry this is^
spare garnet
Haven't missed a step in the R one, ran it with a few more examples and I still getting the output I want
chilly shuttle
ok so step by step
x = np.array([3, 0, 0, 2, 0, 0, 0, 1, 0])
x.cumsum() = array([3, 3, 3, 5, 5, 5, 5, 6, 6])
m = array([0.66666667, 0.66666667, 0.66666667, 0.66666667, 0.66666667,
       0.66666667, 0.66666667, 0.66666667, 0.66666667])
going element wise,
mean of 3 and 3 = 3
mean of 3 and 0 = 1.5
so the output ends up as array([3. , 1.5, 1.5, 3.5, 2.5, 2.5, 2.5, 3.5, 3. ])
something is missing
spare garnet
Alright so....
I have no answer for how the R code is working under the hood, but I have an answer in Python now
s="0, 0, 3, 0, 0, 2, 0, 0, 0, 1, 0"
ser=pd.Series(s.split(',')).astype(int)
','.join(ser.groupby(ser.cumsum()).transform('mean').astype(str).tolist())
chilly shuttle
yuck
spare garnet
Yea not the cleanest, but did what I need
chilly shuttle
runs = runs.replace(0, method='ffill')
runs.groupby(runs).transform('mean')```if you wanna do it that way
wait that's missing a step
runs = runs.replace(0, method='ffill')
g = runs.groupby(runs)
g.transform(mean) / g.transform(len) ```However, and this is what intrigued me, if I don’t provide a grouping variable (missing(...)) it will apply the function FUN on x itself and write its output to x[]. That’s actually what the help file to ave mentioned in its description. So what does it do? Here is an example again:
that's what ave was doing
that's a really clever way to use cumsum
it doesn't care what the cumsum is, it just generates the groupings for ave
spare garnet
Gotcha. Thanks for all your help!
chilly shuttle
in entirely unrelated news, has anyone had any luck building a aws lambda or azure functions based batch ingestion pipeline?
analog helm
Hey all. I have the following code:
octaves = OctaveModule(AbsoluteModule(PerlinModule()))
noise = np.empty((width, height))

for x in range(width):
    for y in range(height):
        noise[x, y] = octaves.get_value(0.0199+(x*0.02), 0.0199+(y*0.02), 0.0199)```
Does numpy provide some manner of doing this automatically? I'm presuming if it does it will probably be considerably faster than doing it manually like thisright, but thats a base python mechanic, it will essentially end up doing the same thing I am doing here. My main concern is the process speed, hence wanting to find a solution within numpy its self, since then I imagine it will be vectorized and a lot faster
alternatively, if numpy doesn't have such an ability, I wouldnt mind some advice/suggestions on rolling my own helper function which elegantly allows me to fill up a numpy array of between 1 and 4 dimensions, with a function similar to the one above that may be anywhere from 1 to 4 dimensions its self (the example above is three dimensions, though the third is static. In the future, I'd like to have separate functions specifically for 1D, 2D, 3D, and 4D specifically). Writing a separate helper function for every case (16) is obviously not very elegant. Then I can just convert it into Cython
 orchid lintel
@analog helm I think it'd be something along these lines :
noise = np.hstack([0.0199+ (octaves [:,0] * 0.02),
                                      0.0199+ (octaves [:,1] * 0.02),
0.0199])```@orchid lintel I probably should have clarified, but octaves is a custom python object which returns values by calculating them on the fly, its not actually an array. I didn't think about how get_values might make it seem like an array its self, so sorry about that
orchid lintel
Oh, hrm.
Yeah, NumPy can't really do streams as far as I know.
some combination of itertools and this package https://toolz.readthedocs.io/en/latest/ ? @analog helm
coordinated with multiprocessing? https://sebastianraschka.com/Articles/2014_multiprocessing.html
Dr. Sebastian Raschka
CPUs with multiple cores have become the standard in the recent development of modern computer architectures and we can not only find them in supercomputer f...
how do you find the width and height?
There should be a generalizable way to just say "unwrap everything and put it in a NumPy array"
And from there you can do NumPy things
Oh wait, misunderstood what the object was.
I'd say, make a NumPy array of all the arguments, so something like this
height = 9
np.array([(0.0199+(x*0.02), 0.0199+(y*0.02), 0.0199) for x in range(width)
for  y in range(height)])```
Then make the `OctaveModule` thing a ufunc?There might not actually be a NumPy-y way to do this.
so, yeah, itertools and toolz (these let you make stuff that's easy to parallelize) and parallelize with multiprocessing
 burnt veldt
die_1 = {0: 0.5, 1: 0.02, 2: 0.02, 3: 0.02, 4: 0.02, 5: 0.02, 6: 0.02, 7: 0.02, 8: 0.02, 9: 0.02, 10: 0.02, 11: 0.02, 12: 0.02, 13: 0.02, 14: 0.02, 15: 0.02, 16: 0.02, 17: 0.02, 18: 0.02, 19: 0.02, 20: 0.02, 21: 0.02, 22: 0.02, 23: 0.02, 24: 0.02, 25: 0.02}


die_2 = {0: 0.4, 1: 0.016, 2: 0.016, 3: 0.016, 4: 0.016, 5: 0.016, 6: 0.016, 7: 0.016, 8: 0.016, 9: 0.016, 10: 0.016, 11: 0.016, 12: 0.016, 13: 0.016, 14: 0.016, 15: 0.016, 16: 0.016, 17: 0.016, 18: 0.016, 19: 0.016, 20: 0.016, 21: 0.016, 22: 0.016, 23: 0.016, 24: 0.016, 25: 0.016}

# probability of die_1 rolling >= 100 quicker than die_2
Do you know how I could calculate something like this?
 polar condor
what's happening there?
burnt veldt
Basically 0 has the highest chance of rolling, then the other numbers 1-25 are all even
polar condor
and they are rolled at the same pace and the values are accumulated?
polar condor
I mean what’s 100
burnt veldt
ohh yes accumulating
polar condor
the sum?
burnt veldt
yes sorry
polar condor
ok, I see, so we stop when either one accumulates 100
polar condor
I love the problem, but I’ve no idea
burnt veldt
😂
I'm too dumb for this shit haven't taken stats since freshman at uni
I'll repost so people don't have to scroll
die_1 = {0: 0.5, 1: 0.02, 2: 0.02, 3: 0.02, 4: 0.02, 5: 0.02, 6: 0.02, 7: 0.02, 8: 0.02, 9: 0.02, 10: 0.02, 11: 0.02, 12: 0.02, 13: 0.02, 14: 0.02, 15: 0.02, 16: 0.02, 17: 0.02, 18: 0.02, 19: 0.02, 20: 0.02, 21: 0.02, 22: 0.02, 23: 0.02, 24: 0.02, 25: 0.02}


die_2 = {0: 0.4, 1: 0.016, 2: 0.016, 3: 0.016, 4: 0.016, 5: 0.016, 6: 0.016, 7: 0.016, 8: 0.016, 9: 0.016, 10: 0.016, 11: 0.016, 12: 0.016, 13: 0.016, 14: 0.016, 15: 0.016, 16: 0.016, 17: 0.016, 18: 0.016, 19: 0.016, 20: 0.016, 21: 0.016, 22: 0.016, 23: 0.016, 24: 0.016, 25: 0.016}

# probability of die_1 accumulating >= 100 quicker than die_2
@burnt veldt , @polar condor , I just saw your question and had some free time to play with it. Made this script which imitates the game. I use NumPy to generate the experiments, record when every die gets >= 100 and then compare them by playing this game 1k times. It also outputs the plot, so you can see it yourself . Variable names are self explanatory, that's why I did not put any comments to the code:
import numpy as np
import seaborn as sns
import matplotlib.pyplot as plt

%matplotlib inline

die_1 = {0: 0.5, 1: 0.02, 2: 0.02, 3: 0.02, 4: 0.02, 5: 0.02, 6: 0.02, 7: 0.02, 8: 0.02, 9: 0.02, 10: 0.02, 11: 0.02, 12: 0.02, 13: 0.02, 14: 0.02, 15: 0.02, 16: 0.02, 17: 0.02, 18: 0.02, 19: 0.02, 20: 0.02, 21: 0.02, 22: 0.02, 23: 0.02, 24: 0.02, 25: 0.02}


die_2 = {0: 0.6, 1: 0.016, 2: 0.016, 3: 0.016, 4: 0.016, 5: 0.016, 6: 0.016, 7: 0.016, 8: 0.016, 9: 0.016, 10: 0.016, 11: 0.016, 12: 0.016, 13: 0.016, 14: 0.016, 15: 0.016, 16: 0.016, 17: 0.016, 18: 0.016, 19: 0.016, 20: 0.016, 21: 0.016, 22: 0.016, 23: 0.016, 24: 0.016, 25: 0.016}

sides_1 = np.array(list(die_1.keys()))
sides_2 = np.array(list(die_2.keys()))

probs_1 = np.array(list(die_1.values()))
probs_2 = np.array(list(die_2.values()))

def run_experiment(game_rounds = 1000, throw_count_per_round = 1000):
    die_1_results = np.random.choice(sides_1, (game_rounds, throw_count_per_round), p = probs_1).cumsum(axis = 1)
    die_2_results = np.random.choice(sides_2, (game_rounds, throw_count_per_round), p = probs_2).cumsum(axis = 1)

    die_1_got_100_at = np.argmax(die_1_results >= 100, axis = 1)
    die_2_got_100_at = np.argmax(die_2_results >= 100, axis = 1)

    die_1_won = np.sum(die_1_got_100_at < die_2_got_100_at)
    die_2_won = np.sum(die_2_got_100_at < die_1_got_100_at)
    tie_game_count = np.sum(die_1_got_100_at == die_2_got_100_at)

    print(f"Die 1 won {die_1_won} times")
    print(f"Die 2 won {die_2_won} times")
    print(f"Tie game happened {tie_game_count} times")


    ax1 = sns.distplot(die_1_got_100_at, color= "red")
    ax2 = sns.distplot(die_2_got_100_at, color = "green")
    plt.show()

run_experiment()
Die 1 won 650 times
Die 2 won 299 times
Tie game happened 51 times
So, the probability of Die 1 to win is around 65 %
Btw, I had to edit the die_2 probabiliti and add 0.2 because it was 0.8 in sum
0 has 0.6 probability instead of 0.4
burnt veldt
Geez thats awesome ty so much!
supple ferry
You welcome :)
 sonic girder
anyone had any experience using tweepy to save search results to csv, then read them out again?
burnt veldt
Do you know how I could put that in a formula form @supple ferry so its more accurate? Im doing 1_000 games and 1_000 rolls but got 43% out of randomness when it should be 50-50 (i know its because its based off luck testing but i want it to be more accurate)
Or even a way to do it quicker would work so i could do higher numbers (10_000 takes too long or maxes out my memory)
lapis sequoia
given spyder-vim seems to no longer be on pypi or on conda, is there any way to get vim keybindings on spyder other than manually installing it?
supple ferry
@burnt veldt 1k games is already included in the function as game rounds. Setting rolls to 1k I did an overkill, as, you see it did not take more, than 50 rounds to reach 100 points. You can decrease that. Honestly numpy does it fast, very fast. Unless your use case is more complicated. It should not be 50/50 because of different probabilities which makes two dice not identical
 cobalt vector
Hi, question for you. I have a dataframe that I am grouping in order to do a data operation to create a classifier. Is there a way that I can then ungroup the df and apply the classifier to every item in the grouping?
supple ferry
You can use @cobalt vector unstack() for that
dense rose
How popular are Jupyter and JupyterLab?
 lean ledge
@dense rose very
dense rose
Which one moreso?
And if the answer is just notebook, is that only because lab is relatively new? (I know that the notebook file is the same and that lab is just a new frontend to work with them)
lean ledge
Notebook is a more used but like, as you said, you can switch between them on a whim, they change nothing
I prefer Labs but recently I've been doing ML on point cloud data and pyntcloud doesn't seem to work on Labs
dense rose
Awesome, thanks.
burnt veldt
I was forced to do ML in MatLab in uni 😒
dense rose
That sounds terrible.
burnt veldt
You have no idea...
 vague jetty
Anyone have experience with the Bidirectional() wrapper for tf.keras? I'm trying to wrap it around a CuDNNLSTM, but I'm getting an error This model has not yet been built. Build the model first by calling `build()` or calling `fit()` with some data, or specify an `input_shape` argument in the first layer(s) for automatic build., which I don't get without the Bidirectional layer.
 dense rose
Not really data science but related, I found a mistake in one of my teacher's jupyter notebooks on github and he said that if we find any, to submit a PR and he'll give us extra credit.
But idk how to work with a jupyter notebook with git.
Like the mistake means his cell output is totally wrong.
Like do I just rerun the entire thing?
lapis sequoia
you can do
jupyter nbconvert —to script <NBNAME>
then git add the .py
if you dont want the output
lean ledge
Sending a pull request depends on how the prof has already done it
If the prof has output on his thing, clear all output and run from the start in the same way
chilly shuttle
huh
@dense rose is his jupyter notebook published with outputs or just code inputs?
either way, if the published artifact is an ipynb then the pull request is just a new ipynb. The only question is whether to nuke the outputs first
chilly shuttle
yeah make your change and rerun the whole thing
there's not really a good diff mechanism for notebooks with output
probably restart the kernel before re-running and saving to it resets cell counters
dense rose
Alright thanks.
 serene veldt
anyone knows a modular implementation of Q-learning in python?
need to model a custom problem so the Gym versions dont work
dense rose
What part of VS do I need to run tensorflow-gpu?
dense rose
https://i.imgur.com/QQN5FZu.png This is infuriating.

Nowhere does it say what you actually need.
I've been trying to guess what needs to be installed for an hour.
lean ledge
@dense rose honestly, just use Linux if you want to do ML stuff. It's far easier that way
It's what everyone uses
Whether because they run Linux or because they use services like AWS or GCP that use Linux or because they're part of an org with their own high performance clusters that uses Linux
dense rose
A very valid point but I'd like to get it working on Windows too if I can.
nimble field
import pandas as pd
import matplotlib.pyplot as plt
import numpy as np
df=pd.read_csv('BaseBallData.csv')
df=df[df.Year > 1999]
df=df.sort_values(by=['Year'])
team1=df[df.Tm =='Colorado Rockies']
team2=df[df.Tm =='Los Angeles Dodgers']
team3=df[df.Tm =='Milwaukee Brewers']
team4=df[df.Tm =='New York Yankees']
team1tm=team1['RA'].values.tolist()
team2tm=team2['RA'].values.tolist()
team3tm=team3['RA'].values.tolist()
team4tm=team4['RA'].values.tolist()

for year in df.Year.unique():
    print(year)
    plt.plot(year,year*2)
    plt.plot(year,year*3)
    plt.plot(year,year*4)
    plt.plot(year,year*5)
    print('darn me')

plt.show()
This shows nothing, any ideas?
chilly shuttle
wait im confused
year is gonna be like a series of unique integers
you wanna plot them all in one shot not with a series of plt.plot no?
but in general, 'shows nothing' means either you're plotting wrong, or the input is empty by the time you're doing anything. So go up and inspect your dataframe at various stages and see what it looks like
chilly shuttle

Backblaze: https://www.backblaze.com/cloud-backup.html#af9tk4 📝 The paper "MONet: Unsupervised Scene Decomposition and Representation" is available here: htt...
polar acorn
Why cant you react with emojis to posts on this channel? I would like to add a 👍 to that video but preferably without writing a new comment.
lean ledge
Mods are facists 
 stiff cliff
possibly a very stupid question, can you train a model where the xn is of varying lengths?
Lets say you want to track a basketball players production over time
and you basically want to look at their pts scored each year so per player you'll have an array of
[x1, ... xn]
but some players have only played for 3 years, where some have played for 15
is there a method of dealing with an issue like this or would i need to pad out my arrays with blank values?
to match array size
chilly shuttle
@stiff cliff before doing anything fancy you might want to just check out facebook's prophet
supple ferry
Hey there!
I have a pair of elements, (pr_id, e_id):
- pr_id is a project id
- e_id is employee id
Every project can have multiple employees working on them. If project 123 has 3 eployees working for it, I will have 3 entries each having the same project id, but different emplyee ids. It means.
My goal is to find out the number of times emplyee 1 worked with employee 2 (order does not matter, emplyee 2 working with employee 1 is still the same collaboration)
Is there a way to get it?
I have this data in the format of CSV file, pandas dataframe, list of lists, list of tuples.
Any help regarding any of these formats is appreciated
sample result should have info about two collaborating employees and its frequency for all employees
with numpy prefferably
chilly shuttle
@lean ledge ARIMA not really suitable for inherently non seasonal effects
..unless baseball players are? 🤷
lean ledge
not for the specific case, I was just throwing out general time series thingss to search up
stiff cliff
@chilly shuttle prophet looks rad, i will definitely have a play with this at work for other stuff. but not quite what I need for my nba datasets.
chilly shuttle
you can disable seasonality components in prophet, it can definitely handle your scenario (no idea if it'll handle it well)
stiff cliff
the problem is each of my x is represented by another array e.g
[1, 2, 3, 4], [3, 6, 6, 4]
chilly shuttle
what do those represent
chilly shuttle
and what's your y
stiff cliff
my y would be arr[-1]
chilly shuttle
sounds doable
chilly shuttle
i'd make y median(x)
stiff cliff
whats the logic for that?
chilly shuttle
why are you predicting their last score instead of their overall perf?
(i don't know anything about baseball)
stiff cliff
oh i just want to predict like
what theyre future performance will look like
their*
stiff cliff
hmm, what do you mean by that
chilly shuttle
as an RNN, I would approach this as
given playerId, 3 scores
predict next 1 score
chilly shuttle
no, you just need to ensure there are at least 3 scores
or 2, whatever. It's a thing you'll need to tune
chilly shuttle
it is not
stiff cliff
ive been using scikit for all of this stuff
chilly shuttle
i'd go for rnn over prophet for this
stiff cliff
for RNN type stuff do i need to go tf?
stiff cliff
ah yep cool
thats my main reason for not migrating to tf already
the learning curve seems
prohibitive
ok lemme read these keras docs
chilly shuttle
if you're not doing anything research'y groundbreaking'y, there's not a ton of reason to use tf
stiff cliff
ye i just want to gamble
hahaha
i joke, kind of
i wanna know who to pick in fantasy basketball
chilly shuttle
keras lets you quickly mess around with architectures and connecting various layers composed out of predefined nodes. TF lets you mess around with and define new nodes
 chilly shuttle
#ot
chilly shuttle
just google 'keras rnn tutorial' you'll be fine
polar acorn
@stiff cliff You might already have thought about this but in case you haven't a nice thing to do with problems like these is to have a baseline model. Compare your models y_hat to a y_hat_baseline that could either be the mean score of that player or the last season score of that player. If you can't beat your baseline your model is probably trash.
polar acorn
I once made a fancy RNN for one step ahead forecasting. And when plotting my predictions next to the real time series they almost matched up exactly. It turned out my model had just learned to repeat the last value of the real time series it had seen...
chilly shuttle
that's a pretty valid answer for 1-ahead
polar acorn
Sure but I could have saved myself both the time spent training the RNN and also the embarrassment of bragging about my very advanced deep learning model only to later come back and say never mind.
chilly shuttle
haha
one way to deal with it is to have the fitness function evaluate several recursive steps of the model and predict 2-3-whatever values
it's still a 1-ahead model but now the fitness evaluator knows more than the model does
 uncut jay
 worn field
Hi, I'm translating some GAUSS code to python but I'm stuck on this one (the loop with the supposed transposition operator)..
Anyone recognize the equation behind this code (supposedly for autocovariance in some form):
proc (1) = autocov(e);
local acov, t, j, em;
t=rows(e);
acov=zeros(t,1);
em=e-meanc(e);
j=0; do until j>t-1;
  acov[j+1]=em[1+j:t]'em[1:t-j]/t;
j=j+1; endo;
retp(acov);
endp;
The loop is a bit strange but example with t = 20 (arrays starting at 1) should be something like
acov[i+1] = em[i+1:20] ' em[1:20-i]/t
So is that
acov[i+1] = em[i+1:20] transpose(em[1:20-i]/20)
Is'nt it missing an operator? Anybody ?? 😃
Autocovariance for 1D?
I'll just use statsmodels.tsa.stattools.acovf for now 👌
@ me if anybody knows something
worn field
right
orchid lintel
Anyone know what might be up with Dask? Trying to do a parallelized read of a text file to form a bag, based on a bunch of locations of delimiters. Sometimes it suddenly can't find the file.
import dask.dataframe as dd
from dask.diagnostics import ProgressBar
import numpy as np
import dask.bag as bag

def get_item(filename, start_index, delimiter_position, encoding='cp1252'):
    with open(filename, 'rb') as file_handle:
        file_handle.seek(start_index)
        text = file_handle.read(delimiter_position).decode(encoding)
        return dict((element.split(': ')[0], element.split(': ')[1])
                               if len(element.split(': ')) > 1
                               else ('unknown', element)
                               for element in text.strip().split('\n'))


with ProgressBar():
    reviews = (bag.from_sequence(output, npartitions=104)
               .map(lambda x: get_item(f"{os.getcwd()}/foods.txt",
                                       x[0],
                                       x[1]))
.compute())```then I'll get this: FileNotFoundError: [Errno 2] No such file or directory: '/mnt/c/Workspaces/Books/Dask/foods.txt'
lapis sequoia
maybe there's no file
can you do a os.path.isfile to check if you're able to access the file
stiff cliff
Lets say objA has variables a, b, c, d, e for each year. Would it better to try predict [[a1, a2, ... an], ... [e1, e2, en]] or [a1, a2, a3, ... an]
As in try predict all the values at once for n year based on [0:-1]
or each variabl eindividually
analog helm
This isn't a Python-specific issue, but I'm getting a bit desperate, so hopefully it's ok if I ask here, but is anyone familiar with Perlin Noise? I'm implementing it in 1 - 4 dimensions. The first three work fine, but the 4th dimension seems to inexplicably produce results just outside the -1.0 to +1.0 range that all the other dimensions work in. I ported directly from Ken Perlin's own 4D example (https://mrl.nyu.edu/~perlin/noise/ImprovedNoise4D.java). So I'm not sure if this is an error on my part in reimplementation, or just an issue that comes up specifically in the 4th dimension (or dimensions past 3, I wouldnt know)
chilly shuttle
@analog helm i'd start by running the java version and checking if it does in fact meet the constraints
after that you can move on to looking for environment issues or a fuckup in your implementation
 primal kiln
can anyone provide me data set of disease symptoms?
supple ferry
@primal kiln you can look into Kaggle and or Google dataset search
primal kiln
@supple ferry can you provide me link ?
supple ferry
@primal kiln just Google :)
 viral crest
*To clarify this is an academic project so I don't believe it is a violation of rule 10, but please let me know if I'm mistaken
Hello all, could use some help collecting data for an AI project I'm working on. If you're interested in helping please checkout the link below, thanks.

reddit
**Resilient Resumes is currently looking for volunteers to aid us in the development of our Minimum Viable Product for the 2019 Nittany AI...
lean ledge
I like the tensorflow ecosystem, but prefer the pytorch API?
stiff cliff
i was looking at the different documentation at the moment
i quite like the pytorch syntax
its very nice
which do you use more frequently @lean ledge
stiff cliff
alright thanks @lean ledge
im going to try make a rnn in tf and pytorch then figure it from there i guess
lean ledge
@stiff cliff the rnn is almost 100% easier in pytorch unless you're using keras layers
RNNs have to be rolled out a specific amount
Tensorflow (at least for now) doesn't use eager execution so that's gotta be stored in a static graph
stiff cliff
Question, I'm looking at this recipe for a standard and neural network and it uses x and y to train right
lean ledge
And that makes it a bit of a toughie
 errant tangle
How hard is it to web scrape a specific website for information that i can provide from a file name?
stiff cliff
Is the file name listed somewhere on the website?
errant tangle
No i am looking for information from the website based on the file name i have
stiff cliff
Yeah that's doable
So you have a file with variables or keywords
And you wanna scrape based on. That?
Have a look at scrapy
I would point scrapy to the xpath of the relevant areas of the site where the data might be
Then use a regex search to find your keyword
And then do whatever you need to do from there
Or if it's not so many pages
Requests and bs4 probably can do the job
Then use lxml for the parser
cobalt vector
I have a problem I’m trying to solve, I have a lot of data that I’m trying to 1. Classify into groups, then 2. Predict future data elements into one of those 3 groups accurately
I was thinking of using Minibatch KMeans to cluster, use the results as labels, then use KNN to predict future results based off the labeled/classified/clustered data
PM me if you have thoughts
lyric canopy
I'd start with a book that gives you a bit of an introduction to the way of thinking
There are a couple of different choices, depending on your own level of mathematics and statistics
Two books I really like are Introduction to Statistical Learning and Elements of Statistical Learning
Both are freely available online
 reef bone
Raggy's pinned post has a link you can read to help get you off the ground
https://discordapp.com/channels/267624335836053506/366673247892275221/489981900048433162
And I can definitely vouch for Elements of Statistical Learning, great book
lyric canopy
It is difficult, but there are also many ways to approach this. To really get a good grip on it, you will need to dive into the models and the mathematics behind them as well. While some people attempt it, it's difficult to make educated decisions in your modelling process if you don't really understand what's going on or what the limitations of what you're doing are.
Some people ignore that, though, and take the approach of just running a model
lean ledge
While I think Elements of Statistical learning is good, it's too dense even for me lol. It approaches from a very "I did a PhD in statistics" way. I find Bishop's Pattern recognition and Machine learning to be a more natural introduction for those with a maths background that is decent but not statistics inspired (eg, basically everyone other than statisticians)
Otherwise, I second everything that was said
lyric canopy
I think that for people just approaching the field, Introduction to Statistical Learning gives a fairly soft introduction.
Elements is indeed a bit dense
lean ledge
I think ISL ends up leaning too much the other way. There's hardly any equations in the book. I think it's meant more for those without any quantitative skills at all, eg. Business majors or health related majors that might be exposed to ML for analytics or research but don't have any maths background
lyric canopy
That's what I mean by people just approaching the field, without a lot of background in mathematics. I think it's one of the few resources that gets the way of thinking across without being math heavy. It's by no means more than a first introduction, though, hence the emphasis on introduction in previous message.
lean ledge
When people say "introduction" in textbooks they generally mean building up foundational knowledge and skills so you can go out and do something else. I don't think ISL accomplishes that very well.
Lol the look on the face of people when they realise multiple Algebra subjects are some of the hardest subjects they'll encounter in uni
lyric canopy
I disagree with that, Raggy. An introduction should give a solid foundation in the way of thinking that relates to a field. It's not for nothing that we have linear algebra and calculus courses alongside the introduction course in our statistical sciences master.
lean ledge
I have no idea where you are but knowledge of linear algebra and calculus is an expected prerequisite here for any kind of masters in statistics or related field, given that's early uni content
And that's not my opinion, that's just what "introduction" means in science and maths textbooks in general
When I see "Introduction to calculus" I expect to be able to taught how to take derivatives and manipulate differentials and how to integrate by parts, not just learn how derivatives might be interpreted visually as slopes or how integrals are area under the curve
You only truly understand it when you combine both the geometric meaning and ideas with the equations side by side
lyric canopy
Let's agree to disagree, then. It's not what this means at the university I work at (University of Leiden), but, hey, your experience may vary.
An introduction course in statistical learning is going to be about statistical learning, not about calculus or linear algebra in itself. Those are generally bachelor courses and separate or additional courses for students coming from outside of mathematics.
reef bone
I personally found Bishop to be far less approachable than Elements, but I suppose it's really heavily individual
lean ledge
Yeah it definitely is. I think I originally said Bishop just feels more like seeing from the lens of an engineer or a physicist
Which meshes with me better
 quiet crest
how do you guys deal with duplicate data? Pandas messes up on merge
 mossy dragon
ha its funny u guys mention linear algebra and calculus
the MS stats program im going into doesn't have a requirement of linear algebra and its been bugging me a bit
 ripe sundial
Heya, I am doing CNN using Keras in Python. I have a training, validation and test split and I am wondering how I can go about using the test file? Currently I do this cc, v, xx, r = train_test_split(x_2, y_2, test_size=1) but it is not necessary to split since I want to use the entire file as test hence why I put test size to 1
This is my training and validation split x_train, x_validation, y_train, y_validation = train_test_split(x_1, y_1, test_size=0.50, shuffle=True)
paper niche
hmm? if you don't need to split then don't call the train_test_split function?
ripe sundial
   test_data = read_data("../Data/test_2.csv")
    data_len = test_data.shape[1] - 1
    x_2 = test_data.iloc[:, :-1].values
    y_2 = test_data.iloc[:, test_data.shape[1] - 1].values
    cc, v, xx, r = train_test_split(x_2, y_2, test_size=1)
    cc = cc.reshape(cc.shape[0], data_len, 1).astype('float32')
yeah then just use x_2 as it is, there's no need to do any splitting
ripe sundial
I do the reshaping, I will see if I can go without it
hmm when evaluating: score = model_m.evaluate(x_2, y_2, verbose=0) I get the following error: ValueError: Error when checking input: expected conv1d_1_input to have 3 dimensions, but got array with shape (150, 53)
    model_m = Sequential()
    model_m.add(Conv1D(filters=32, kernel_size=10, activation='relu', input_shape=(data_len, 1)))
    model_m.add(Conv1D(filters=32, kernel_size=10, activation='relu'))
    model_m.add(Dropout(0.3))
    model_m.add(Flatten())
    model_m.add(Dense(len(LABELS), activation='softmax'))
    print(model_m.summary())
    model_m.compile(loss='sparse_categorical_crossentropy', optimizer='adam', metrics=['accuracy', 'mean_squared_error'])
    history = model_m.fit(x_train, y_train, batch_size=batch_size, epochs=epochs, validation_data=(x_validation, y_validation))
That's my model
Let me try reshape the test data as I did previously
Yep that did it!
Thanks for the help @paper niche
paper niche
yeah you have to reshape it as before. np!
ripe sundial
Yep, did this x_test = x_test.reshape(x_test.shape[0], data_len, 1).astype('float32')
ripe sundial
For one dimensional CNN's (for example for sensor data) what would the feature maps contain? For 2D CNN with images one feature map contains some feature, like edges of the image. However, I am not sure what the feature would be for 1D CNN sensor data.
 quasi nacelle
where can i find a link to "how to code format here in discord" ?
 native lark
!codeblock
arctic wedgeBOT
codeblock
Discord has support for Markdown, which allows you to post code with full syntax highlighting. Please use these whenever you paste code, as this helps improve the legibility and makes it easier for us to help you.
To do this, use the following method:
```python
print("Hello world!")
```
This will result in the following:
print("Hello world!")
 spring stratus
is anyone familiar with lagrange-polynoms
i got a theoretical question that id love to be answered
i have a dataset and i want to approximate it with a polynomial function.
i saw this online but i dont know why you can do that
or to be precise why does the lagrange-polynomial function return the points in the dataset
paper niche
well, what is l_k(x_k) equal to? and what does l_j(x_k) for j not equal to k equal to?
then think about what you get if you try to evaluate p(x_k)
quasi nacelle
Hi i have a exercise that is causing me some problems. Would anyone like to help me?
paper niche
!ask @quasi nacelle
arctic wedgeBOT
ask
Asking good questions will yield a much higher chance of a quick response:
• Don't ask to ask your question, just go ahead and tell us your problem.
• Try to solve the problem on your own first, we're not going to write code for you.
• Show us the code you've tried and any errors or unexpected results it's giving
• Keep your patience while we're helping you.
You can find a much more detailed explanation on our website.
quasi nacelle
😩 i dont know were to start the code.. so maybe someone could explain how i would get started? - please dont ban me.. Construct three files from ex1.dat (using already learned UNIX techniques). Each file should contain one column of numbers from ex1.dat. Now make a Python program that sums numbers from a input file and displays the sum of the numbers. Use the 3 files you constructed as input filers and see the sums. The sums are approx. Col 1; -904.4143, Col 2; 482.8410, Col 3; 292.05150 for the three columns.
quasi nacelle
oh jesus.. i was looking at the wrong file
quasi nacelle
hi i have split the file by column using ark. Now i need to some the values.
total = 0

with open('ex1.dat_1') as infile:
    with open('results.txt', 'w') as outfile:

        for line in infile:
            try:
                num = int(line)
                total += num
                print(num, file=outfile)
            except ValueError:
                print(
                    "'{}' is not a number".format(line.rstrip())
                )

print(total)
output
can someone explain what is happening
quasi nacelle
infile
native lark
            except ValueError as e:
                print(
                    "'{}' is not a number: {}".format(line.rstrip(), e)
                )
try this
and look at the error
quasi nacelle
no that did work
quasi nacelle
uhh not sure.. something with a new line. but i dont understand the invalid literal for int()
native lark
example of integers:
1
10
5
8
examples of NOT integers:
0.2
42.4
π
quasi nacelle
i see so swiching int to float would solve this
👌
awesome i spent 50min on this little assignment... how long does it take to become proficient in python
native lark
depends on your dedication and knowledge about programming in general
quasi nacelle
months ? years ? - a life time
native lark
if you're already a master programmer yo ucould probably be there in 2 months
quasi nacelle
well john snow i know nothing
native lark
if you're learning programming with python itll take MUCH longer
quasi nacelle
why ?
quasi nacelle
it python not a good beginner language
native lark
programming languages aren't that different
yes it is
but
you still need to learn the concepts
and data structures
and ways of thinking
quasi nacelle
yes i see.. so basically i am f...ed ..
so you recommend a first course would be - learn to thing like a programmer
native lark
this course helped me a lot https://www.sololearn.com/Course/Python/

and then its just practicing your skills all the time
quasi nacelle
thanks ..
for the assignment i need to du this for 3 files.. how would you do taht ?
native lark
wrap it in a for loop that iterates over a list of filenames and uses them to open those files
quasi nacelle
uhh where would that loop start ? ```python
with open('ex1.dat_1') as infile:
could you open multipul files in that line ?
native lark
if you want to do it proper:
make your file conversion a function and call it within the for loop
or simple:
files = [
    "file1.dat",
    "file2.dat"
]
for name in files:
    with open(name) as infile:
        # ......
relevant xkcd https://xkcd.com/844/

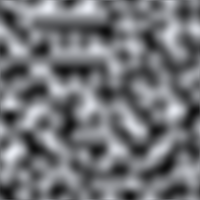


 native lark
then you need to have multiple output files as well
quasi nacelle
total_1 = 0
total_2 = 0
total_3 = 0
files = [
    "ex1.dat_1",
    "ex1.dat_2",
    "ex1.dat_3"]
for name in files:
   with open(name) as infile:
    with open('results.txt', 'w') as outfile:

        for line in infile:
            try:
                num = float(line)
                total_1 += num
                print(num, file=outfile)
            except ValueError as e:
                print(
                    "'{}' is not a number: {}".format(line.rstrip(), e)
                )

print(total_1)
files = [
    ("file1.dat", "out1.txt"),
    ("file2.dat", "out2.txt")
]
for inname, outname in files:
    with open(inname) as infile:
        with open(outname) as outfile:
        # ......
hmm i am getting an error that i dont understand
native lark
paste it
quasi nacelle
quasi nacelle
native lark
yes
quasi nacelle
ups
quasi nacelle
yes - i think i cleard that up but the error stats at for
danm ...
FileNotFoundError: [Errno 2] No such file or directory: 'out1.txt'
do i need to create the out1.txt files first ?
total=0
files = [
    ("ex1.dat_1", "out1.txt"),
    ("ex1.dat_2", "out2.txt"),
    ("ex1.dat_3", "out3.txt"),
    ]

for inname, outname in files:
    with open(inname) as infile:
        with open(outname) as outfile:
         for line in infile:
            try:
                num = float(line)
                total += num
                print(num, file=outfile)
            except ValueError as e:
                print(
                    "'{}' is not a number: {}".format(line.rstrip(), e)
                )

print(total)
add back the , 'w') at the correct open
so it knows to write in the file
not just read
quasi nacelle
okay - but it still only print out one number
total1=0
total2=0
total3=0

files = [
    ("ex1.dat_1", "out1.txt"),
    ("ex1.dat_2", "out2.txt"),
    ("ex1.dat_3", "out3.txt"),
    ]

for inname, outname in files:
    with open(inname) as infile:
        with open(outname, 'w') as outfile:
         for line in infile:
            try:
                num = float(line)
                total1 += num
                total2 += num
                total3 += num
                print(num, file=outfile)
            except ValueError as e:
                print(
                    "'{}' is not a number: {}".format(line.rstrip(), e)
                )

print(total1)
print(total2)
print(total3)
but the output is the same for all files ? -129.52179999999356
-129.52179999999356
-129.52179999999356
native lark
are you sure that your input files aren't the same
quasi nacelle
no they are different
the sums should be Col 1; -904.4143, Col 2; 482.8410, Col 3; 292.05150 for the three columns.
 silent citrus
Job title: Data Engineer is the same as Data Science?
lean ledge
Not at all
silent citrus
Could you explain please @lean ledge
lean ledge
Data scientists worry about feature engineering, data transformations, mathematical modelling and machine learning. Data engineers worry about making efficient and fast data pipelines for data scientists and for deployed models
silent citrus
Ahh. Thank you! @lean ledge
silent citrus
Oh wow thank you! Im new to python so im exploring, but im trying to obtain a job as a data engineer/backend SWE. If im self-taught, what should I focus to increase my chances to get an interview? @lean ledge
I think I found a good bunch of resources to study for technical interviews, but im having trouble thinking where to start to increase my chances to get an interview as a python data engineer/backend
lean ledge
I can't say I know much about data engineering, I lean towards data science out of the two
Soz
silent citrus
No problem, thank you! @lean ledge
 wheat wedge
Hi guys, i'm having a problem with pandas that i can't solve after a fair share of googling
Is there a way to use groupby of DataFrame in order to treat each of 3 columns as if it was ONE column?
I will try to explain with an example.
This dataframe consists of items from an arpg. Each item has either 2 or 3 mods. Mods are picked from a set of mods, there are 81 mods total. Mods cannot repeat on the same item.
This is how the dataframe looks. My goal is to do some sort of df.groupby and have the output like:
   mod      mean price
0  mod_1        80.0
1  mod_2       450.5
...
80 mod_81     1337.0
 silent swan
so "Anger 1" is one of the mods?
wheat wedge
yes
my guess would be there's probably no way to do it with built-in methods, and i would have to iterate over the dataframe, which seems to be quite against the pandas philosophy
silent swan
and you want the price average across iterms that have a mod?
wheat wedge
correct
silent swan
man I have the jankiest solution
it involves unstacking the mod columns, re-setting the index, and then joining with the price column
wheat wedge
so each entry in the dataframe would represent one mod instead of an item with 2-3 mods?
silent swan
yes, and then joining with the price column will duplicate it accordingly, getting you more or less the kind of table you want
it's so jank that I wouldn't recommend tho
otoh I'm not sure if there's another way, since you need to express that the 3 mod columns are "stackable" in some sense
wheat wedge
weirdly enough it's not even the first time i'm encountering this particular problem, and i really can't find the solution because all the keywords are leading to different questions
before this i tried parsing the imdb database, it has genres as a single column, while there can be multiple genres for a movie
i wanted to group it by genre but yeah that led nowhere
silent swan
either that or some pivot table magic, but I never used those
wheat wedge
maybe just ignoring the philosophy and iterating over the dataframe like a typical iterator could be a tolerable solution
silent swan
agreed
but if you want my jank solution
df.reset_index(drop=True)[["mod_a", "mod_b", "mod_c"]].unstack().reset_index().set_index("level_1").join(df[["price"]]).groupby(0)["price"].mean()
omg i hate it
 crude flame
Hi I don't know if this doesn't belong more into one of the help channels, but I'm having a weird issue with a kaggle challenge and it would be helpful to have someone who is familiar with scikit.learn to have a quick look at my notebook
In the competition I want to predict if a flight is delayed by 15 minutes or more and for this there is a field dep_delayed_15min that takes values Y and N so one would expect that we should map Y to 1 and N to 0 and this is also what the kernels discussing the challenge do. However if I do that, I get an extraordinarily bad result (~0.3 ROC_AUC; considerably worse than the sample submission which is at ~0.5) so now I take the opposite mapping and get a somewhat decent result.
So my guess is that I somewhere else down the line do some mistake that cancels with this inverse encoding of yes and no
I put the notebook on github for reference: https://github.com/Philipp-Rueter/MLCourse-FlightDelays-Competition/blob/master/FlightDelaysChallenge.ipynb
would be very thankful if anyone can help me out (also feel free to give general feedback, if you like)
GitHub
My go at the challenge https://www.kaggle.com/c/flight-delays-fall-2018 - Philipp-Rueter/MLCourse-FlightDelays-Competition
paper niche
@wheat wedge
df.melt(['gone', 'price'], value_name='mod').groupby('mod')['price'].mean()
you can use melt maybe
wheat wedge
@paper niche thank you, it works! yes, i was looking at melt as well but i was doing weird stuff like
df.melt(id_vars='price',value_vars=['mod_a', 'mod_b', 'mod_c'])
yeah np 👍
wouldn't that work too? you're just a groupby and mean() away from the answer
wheat wedge
yeah sure but it felt weird to assign price as an id. but now i can see you're basically doing that as well.
also apparently when you assign the id_vars, it automatically assumes the rest of the columns as value_vars, interesting
i went through quite a googling journey, from groupby to pivot_table to pivot to get_dummies (which is almost the reverse of what i needed) to wide_to_long to melt 😄
lapis sequoia
not sure if this is the right place to ask the question but I am having trouble to display a graph in matplotlib
I figured it'd be good to use subplots for a change, but then nothing will pop up on the screen when I run
import matplotlib
import matplotlib.pyplot as plt

# more code that's not relevant ...

figure, axis = plt.subplots()
axis.scatter(x = [point.X for point in points], y = [point.Y for point in points], s = 10, edgecolors='None', color = colors)
when I run this script I feel like there's a window showing up in a blink of a second, but it's almost not noticeable (as compared to the case when the two significant lines are commented out) so maybe I have to add a plt.show() or something like that somewhere in my code?
wow feeling so stupid, looks like I still have to call plt.show() although the examples I found online did not? hm... curious
lapis sequoia
where are you running it
lapis sequoia
I have a .mdl file with embeddings.. I think it's a gensim file..
how do I convert it to use with tensorflow
silent swan
is there a reason you're using tensorflow and not pytorch?
(nothing wrong with tensorflow, just that I'm more familiar with pytorch)
lapis sequoia
yes.. I don't know how to use pytorch..lol
silent swan
aha, well anyway the answer for tensorflow is very likely "extract the weights into numpy arrays, assign as variables in tf"
lapis sequoia
alrighty
ripe sundial
Hey, working with Keras to make a 1D CNN. When I set the batch_size to 1 every iteration is not 1 batch size but rather:
 1/171 [..............................] - ETA: 0s - loss: 0.0061 - acc: 1.0000 - mean_squared_error: 0.4940
 23/171 [===>..........................] - ETA: 0s - loss: 8.8820e-04 - acc: 1.0000 - mean_squared_error: 0.4991
 46/171 [=======>......................] - ETA: 0s - loss: 0.0023 - acc: 1.0000 - mean_squared_error: 0.4977
 70/171 [===========>..................] - ETA: 0s - loss: 0.0029 - acc: 1.0000 - mean_squared_error: 0.4972
 93/171 [===============>..............] - ETA: 0s - loss: 0.0027 - acc: 1.0000 - mean_squared_error: 0.4974
114/171 [===================>..........] - ETA: 0s - loss: 0.0029 - acc: 1.0000 - mean_squared_error: 0.4971
135/171 [======================>.......] - ETA: 0s - loss: 0.0031 - acc: 1.0000 - mean_squared_error: 0.4970
158/171 [==========================>...] - ETA: 0s - loss: 0.0028 - acc: 1.0000 - mean_squared_error: 0.4973
171/171 [==============================] - 0s 2ms/step - loss: 0.0027 - acc: 1.0000 - mean_squared_error: 0.4973 - val_loss: 3.4326e-04 - val_acc: 1.0000 - val_mean_squared_error: 0.4997
Epoch 4/20
Can anyone explain why this is happening?
void anvil
Yiure overfitting or cheating
ripe sundial
@void anvil I am not sure I understand. What do you mean?
My question is regarding the batch size, why the iterations are not
1/171
2/171
3/171
....
171/171
Epoch X/20
My current batch size is equal to 1
 feral lodge
He's saying your accuracy is too good, typically you won't score 100% on your validation data
batch_size is an argument of the model.fit method, is that where you're setting it? @ripe sundial
ripe sundial
Yes
feral lodge
Your data is a numpy array or?
ripe sundial
Don't mind the accuracy, it was just a random model to show the batch size thing each iteration for an epoch
feral lodge
👌
ripe sundial
data_len = dataset.shape[1] - 1
 training_data = dataset.iloc[:, :-1].values  # Take the last value = CLASS value
 training_labels = dataset.iloc[:, dataset.shape[1] - 1].values

#### Train Validation Test Split ####
from sklearn.model_selection import train_test_split
x_train, x_test, y_train, y_test = train_test_split(training_data, training_labels, test_size=0.60, shuffle=True)
x_train, x_validation, y_train, y_validation = train_test_split(x_train, y_train, test_size=0.50, shuffle=True)
That is the data
I first take the data and split it into training and test, and then take the training and split it into training and validation
Then I normalize:
 normalizer.fit(x_train)
x_train = normalizer.transform(x_train)
x_validation = normalizer.transform(x_validation)
x_test = normalizer.transform(x_test)
and finally I reshape:
x_train = x_train.reshape(x_train.shape[0], data_len, 1).astype('float32')
x_validation = x_validation.reshape(x_validation.shape[0], data_len, 1).astype('float32')
x_test = x_test.reshape(x_test.shape[0], data_len, 1).astype('float32')
So x_train.shape is (171, data_len, 1) right? What's the ìnput_shape in the first layer of your model? It should be (data_len, 1)
@ripe sundial
ripe sundial
conv1d _1 is (None, 97, 100)
conv1d_2 is (None, 88, 50)
Mind you this is on different data, with 102 samples
feral lodge
Does that data work like you expect? I know keras uses None internally to represent the batch size, but I have never seen it done manually. For me, if you have 171batches of (data_len, 1)-shaped input vectors, I set input_shape = (data_len, 1).
Not sure if that's a problem though. My code gives me errors when i use None
ripe sundial
I don't specify the None anywhere, I believe Keras does it for me
Would you like me to send the entire model?
feral lodge
Sure!