#data-science-and-ml
1 messages · Page 193 of 1
 desert cradle
 river plume
wont type casting work?
desert cradle
sure but you haven't done it in the above example
river plume
or will it be an object?
desert cradle
anyway, I think you can extract the regex i gave to get both columns at once, and use df[['Object', 'Price']]
river plume
yep type casting worked
desert cradle
i just wasn't aware of extract
desert cradle
all together now ```py
df = pd.DataFrame({'TheColumn': ['Eraser (5)']})
r = r'^(.?)\s((\d+))$'
df[['Object', 'PriceStr']] = df['TheColumn'].str.extract(r)
df['Price'] = df['PriceStr'].astype(int)
del df['PriceStr']
df
TheColumn Object Price
0 Eraser (5) Eraser 5```
river plume
thanks
 lime lava
i ended up doing it with a loop
I need a diferent kind of help now
im getting memory error trying to divide two ~1mb columns elemenwise
even if i cast them to np arrays with .values its give me such and error
while having around 32 gb of ram
oh nvm it was a different shapes problem (n,1) vs (n, )
 tulip estuary
All, I've been trying to figure out a way to do query parsing , for example ( (person="brechmos" or person="frank") and address="10 Main St") using some sort of parser. What I want to do in the end is for each term (e.g., person="brechmos") is return a Django query object Q() that I can then use in a filter.
So, in the end I suspect I will have code something like:
def NODE_person(args):
    return Q(person__icontains=args[0]

def NODE_address(args):
    return Q(address__icontains=args[0])

def NODE_and(left, right):
    return left & right # where left and  right are Q() objects from a term above

def NODE_or(left, right):
    return left | right

query = parse_expression(example_expression)
things = thing.objects.filter(query)
I have tried out many different grammar parsers (e.g., some from https://tomassetti.me/parsing-in-python/) but they all seem to have different quirks.
Could someone suggest a parser package that might seem to fit the type of query parsing I am doing? (I am happy to do the coding work :), just stuck on which package seems to make the most sense here).

Federico Tomassetti - Software Architect
We present and compare all possible alternatives you can use to parse languages in Python. From libraries to parser generators, we present all options
 left axle
anyone familiar with dictionarys?
 austere quartz
Most of us are. Go ahead and ask your question.
left axle
er trying to get a specific cell to show from an excel file
 old axle
len(np_array) should return number of items in the array, correct?
 karmic axle
Hello, Can anyone please help me in this dataframe question
I have a dataframe of this form
But why is this condition always false? (In[344])
there is df['status']!=1 in the dataframe but the size of the resulting series is zero.. Can someone please explain
 remote gulch
Hey yall, what python libraries might I use to combine a set of single channel images into a multispectral tiff/png?
old axle
@chilly shuttle no i mean one dimensional arrays
 chilly shuttle
Well yes, the shape along axis 0 of a one dimensional array is the number of elements in it
old axle
ok
 cedar light
for i in itertools.product(*map(range, c.shape)):
    c[i] = brent(self._maximum_c_obj, (l[i], h[i]))
``` iterating over every possible index tuple in a numpy arrayeven dimension-0 arrays (np.array(0) for example)
worked way better than np.nditer
here c, l, and h are numpy arrays all with the same shape (i explicitly have to handle the dimension-0 case)
 gilded dagger
Ok, maybe asking here is better. I'm looking for somebody with data science experience to peer review my code, because it's frankly disgusting though it works.
In particular, I'm interested in learning if pandas is what I should be using
gilded dagger
So here we go. Here are the two files relevant to my (coming) question:
https://pastebin.com/6W8tSvki
https://pastebin.com/CRr0b7Hg
The goal is to compute winrate per matchups in league of legends, and it DOES work
The thing is, I'm not sure about the data types I used. I made a custom class (WinrateData) to store information relevant to the winrate (in championCouplesWinrates), then it means I can't really serialise easily.
At the same time, this object does have important info for the computation.
Then for the output, since I have a dict of list of custom objects, I pretty much have to do it myself by hand writing a CSV... Which also feels very hacky.
So to anybody who knows more about available Python modules and good data structure, what's the smart way to do it?

 violet crag
is this correct formula for std deviation and variance?
x is the sample
mu is the mean
n is the no. of samples in "x"
 lyric canopy
That depends: Are you calculating the variance for the population or for a sample?
The formulas suggest you're calculating it for the population
 solar oracle
finally some statistics 😄
lyric canopy
However, @violet crag, if you're actually computing a sample sd as an estimator of the population sd, you're actually calculating the Maximum Likelihood estimator at the moment. It's biased, but consistent.
Another estimator that's often used is the unbiased estimator with n-1 in the denominator
solar oracle
^
violet crag
I am calculating of the population, I am new to this term "Maximum Likelihood estimator"
so... why is n-1 less biased, also can you explain it to me how my formula would be biased for a sample and not for the population?
lyric canopy
No, it's not biased for the sample, but let me explain.
Say, you're trying to estimate the standard deviation of a population using a sample. So, what you want is a number from your sample that estimates the parameter of the population. We call that number an estimator.
Obviously, when you draw two random samples from a population (and the population is not constant and so on), then you're probably going to observe different values in both samples. In turn, that also means that the values of the estimator you're going to calculate for those two samples are going to be different.
So, we have something called a sampling distribution of the estimator.
That's where the term unbiased comes in: If the average of that sampling distribution for an estimator is equal to the actual value of the population, then we call it unbiased.
This doesn't mean that the value of the estimator from any random sample is going to be exactly equal to the population parameter, just that if we draw an infinite number of samples from the population and we compute the estimator for every sample, the average of all those estimator values is going to be equal to the actual population parameter.
solar oracle
If you want more material look for "Bessel's correction".
violet crag
okay, gonna take me some time to soak this up
lyric canopy
Yeah. The basic idea (simplified) is that because we calculate the mean of the sample over the same points we're going to use to calculate the estimator of the variance, the sample mean usually lies closer to the points, underestimating the variance.
Now, unbiased doesn't mean it's the most efficient, but I think this is a lot of information to take in at once
violet crag
suppose we took many samples from the population, what we want is our estimators from all this samples to be closer to each other?
can you suggest me a book or video series to go through all this, haven't touched Statistics since high school, that was a decade ago
thanks you @solar oracle I am reading on it
ah I guess this is what Frank is talking about
solar oracle
Yep
 narrow grail
Good day people
Novice in Python
What book you will suggest for start in data-science?
 hardy crag
depends on what you actually want to learn
what I mean is there is a broad spectrum of topics associated with "data science and python", examples include computer vision, nlp, machine learning, Data collection and warehousing,, spark and hadoop
A site I personally think is helpful in general for beginners is python-programming.net (and the sentdex youtube channel) as well as codecademy.com
narrow grail
🙌
 lapis sequoia
Hello, anyone who can help me about Linear Regression ?
lapis sequoia
which is the best major for data science?
 tropic jay
Hey people, trying to install a particular module and for some reason I am not able to install it in my CMD.
NLTK and its as though pip is non existent, I've been at this for hrs and was hoping someone has had this issue or perhaps has the ability to help with installing this module...
tropic jay
for CMD its a syntax error
lyric canopy
Can you show me the full traceback?
tropic jay
Sorry Ves, I'm really new at this and don't know how to do that
lyric canopy
Copy everything CMD outputs after you run the ocmmand
That may help us pin down the problem
tropic jay
Right, when in python in the CMD right?
lyric canopy
Ah
You should run the pip command outside of the Python REPL shell
Just in the regular CMD
lyric canopy
Can you try that again and show me the output?
tropic jay
I have 3.7 installyd
32 bit
So pip commands here should work, as far as I understand this
lyric canopy
Yes, but I know what the problem is
The problem is that the folder in which pip is located is not added to PATH
So, CMD doesn't "know" the command
Can you do py -V for me in CMD?
lyric canopy
Which version of Python does it output?
tropic jay
3.7.2
lyric canopy
Cool
So, what you can do, is use the py launcher to use pip
You can do that by adding py -m before your regular pip command
So, py -m pip ....... with the rest of your pip command at the place of the dots
tropic jay
Alright, so it would be py -m pip install nltk
lyric canopy
Yes, let's hope it works the first try
tropic jay
alright so ill exit the python shell first
lyric canopy
Yes
lyric canopy
Sure
tropic jay
It looks like I have NLTK
lyric canopy
When you install Python, you get the option to add it to PATH, but it's not selected by default
The problem is that when you don't, CMD will not recognize the commands
However, the py launcher IS selected by default, so you can use that to still use pip
tropic jay
Right!!! I did a fresh install because when this originally worked it I had Anaconda 3 installed
and anaconda had path enabled when I did that
lyric canopy
Obviously, you can add Python to PATH manually now, but I don't work enough with Windows to assist you with that
tropic jay
So I uninstalled everything and did a fresh install and I did not add path
That makes so much more sense
I could always do a reinstall and select add to path
lyric canopy
Yes, but remember to reinstall NLTK afterwards as well
tropic jay
Yes. Alright give me a moment, thank you so much ves
lyric canopy
You can also add it to path yourself; there's probably a guide somewhere on google
No problem
tropic jay
thats where I went wrong originally.
Hey Ves, im installing all the nltk packages from their GUI
Thanks again, this was really helpful
lyric canopy
No problem!
tropic jay
Hi Ves, sorry to bother you with this again. I'm attempting an install on my laptop and im getting an attribute error
AttributeError: module 'nltk' has no attribute 'download'
lyric canopy
Is your file, or any other in the directory of your script, named nltk.py by any chance? If so, rename it, because Python is trying to use that file when you say import nltk, @tropic jay
tropic jay
Hey @lyric canopy , I've tried a few file name types. Does it matter what directory the script is saved in?
You're a wizard Ves. That was exactly the problem. It was trying for some reason to include a previous script that I had labeled nltk.py, at least I think so.
tropic jay
It's so bizzare!!
Why does it try and call from a file that you're not using?
Is there a specific reason?
 south quest
what is happening is
if you go import nltk
python checks various the current directory before the installed packages
so in that case it would import the nltk.py file as the nltk module instead of the nltk module from pip
tropic jay
OH!!!
south quest
so then when you try to use nltk.blah() it is calling the blah of nltk.py instead of nltk from pip
tropic jay
Makes total sense.
Thank's a lot for this guys I really appreciate the help as a total noob.
I plan on doing some really cool stuff with nltk and this was such a frustrating barrier.
 olive sorrel
Does anyone know of a GIS discord?
 obtuse skiff
using the sklearn sparse matrix's, I have a matrix of (1440, ) and one that is (1, 1440)
I need to resize them to be the same dimensions, so I can take the dot product, how do I do that???
 hasty maple
@obtuse skiff reshape the (1440, ) to (1440,1) and then take the dot product
 maiden lichen
Hey everyone, I'm a fairly recent college grad (about a year and a half in industry doing plug-n-play Java coding) and I liked the prospect of machine learning and I've done almost all of the IBM Data Science Professional Certificate, was this a huge waste of time/money (sans just being a random resume padder for my super crappy GPA). Any ideas for a "next step" of sorts?
 sweet scaffold
gilded dagger
sweet scaffold
gilded dagger
Hi! Anybody got recommendations for a quick read on Python's Machine Learning modules?
I'm an old man used to working with Matlab and OpenCV and am kinda lost in the sea of options that exist in Python
gilded dagger
I don't need anything anymore from those archaic times 
For starters let's say I wanted to do a linear regression where my input vector is a bunch of IDs
So I'd need to first create the data suitable for the algorithm, run it, test it. What are the tools I could use for that in Python?
lapis sequoia
could you define your goal clearly
never start with the algorithm.. ml isn't the solution for everything..
what is the goal.. what are the IDs going to tell you
gilded dagger
I have an M.Sc. in Machine Learning so I'm pretty sure I know what I'm doing, I'm just trying to know what tools exist for that in Python.
But if you want to know more, I'm working on a dataset of game replays where IDs represents items, and I want to see what kind of correlation there is between those items and the DPS in games.
To do that, I need to create input vectors to represent the IDs of the items that I want to try, and add stuff such as couples and maybe trios of items
I want to know how to do that as fast and painlessly as possible in Python
lapis sequoia
array of vectors.. numpy
gilded dagger
Is there a simple way to add square/produces of existing dimensions or do I need to loop to do it?
Let's say I have 5 items, ids 1 2 3 4 5
My vector represents if I have those items or not
lapis sequoia
normalize your arrays using scikit learn
gilded dagger
Is there a simple and easy way to add 20 dimensions that represent "1 and 2" and such?
lapis sequoia
scaling then add to array, and normalize if required..
but how would you relate the combination of items back to the DPS
or do you just want to show correlation
gilded dagger
I just want to look at the weights afterwards to have a general idea of what matters most
That's why I'm sticking to a very simple model
And all dimensions will be 0 or 1, so comparing weights together should make decent sense
I really just wanna take a look at it and see how it fits, that's why I'm searching for what's the simplest for this kind of basic prototyping
lapis sequoia
I'd have to look at some of the data to suggest..
you could look it in seaborn's heatmap to draw initial correlation
 distant inlet
Hi guys
Im very new to datascience
I have installed numpy , jupyter , sckit , pandas
Are these libraries enough for starters?
 reef bone
yeah i think that's good, numpy is one of my favourite things about python, and numpy arrays are the preferred form of input to many other libraries you will be using, so it's a good idea to get a good feel for them
jupyter is my second favourite thing about python

reef bone
yee absolutely
the only problem i've had with them is that i find the documentation to be a bit lacking in some cases
i also remember there were some concerns about their implementation of PCA i believe, but for a beginner it's a great package to get started
lyric canopy
Oh, that's new to me. I've never used it for that, but I should look into that.
For the general implementation as well? Or just stuff like catpca?
PCoA is probably of more interest to me than catpca
reef bone
it was something with the SVD solver for the general PCA implementation
it might have been addressed since, i'll see if i can find the issue on github when i get home
distant inlet
👌 👌 👌 👌 👌
Super excited
!
So do you guys share your insights on jupyter notebook or a .py file
 narrow vale
Anyone got any knowledge with sqlite3 and python? Having issues inserting into a table
lapis sequoia
Have worked a little with sqlite3, @narrow vale. Do you still need help with it?
lapis sequoia
Awesome ^^
 tight pagoda
recommend me a book or pdf of science data
old axle
whats a good source for learning pandas?
gilded dagger
Question of the day about sklearn
What is the recommended input format for data?
I'm having a list of numpy arrays as both input and list of floats as result, and it's kinda screwy
Especially when I start using preprocessing.normalise(), which returns slightly different objects
In particular, using preprocessing.normalise() on a list of floats returns an ndarray with dimensions [1, length of array], and then can't be called in the usual sklearn functions. I must be doing something stupid somewhere
lyric canopy
@old axle I'd start with the tutorial in the official documentation and go from there. The documentation is quite extensive, but it helps to practice with the tutorial first to get the hang of indicing, grouping, and stuff like that.
@tight pagoda That's not an easy question to answer as "data science" is a very broad domain and a bit of a buzz term. Without knowing what you're interested in, it's difficult to know what kind of resource will fit you. I'm more of traditional statistician, so I'd recommend stuff like Introduction to Statistical Learning and Elements of Statistical Learning, but both are not Python specific. (The former even has examples for another language, R). They are a good basis for those who want to know more of the background and want to know what they are doing instead of just learning how to call a couple of functions and then magic happens. The focus in statistical learning, although related, is usually slightly different than, say, machine learning though, as datasets are often a bit smaller. That said, I don't think the knowledge in both books (and especially the more math heavy one, Elements) is non-generalizable; far from it actually.
gilded dagger
Pandas question of the day: how do I access a row for a dataframe whose indexes are all strings?
If I do df['Manamune'] it gives me a:
pandas._libs.hashtable.PyObjectHashTable.get_item
  File "pandas/_libs/hashtable_class_helper.pxi", line 1500, in pandas._libs.hashtable.PyObjectHashTable.get_item
KeyError: 'Manamune'
But this works:
df[:'Manamune']
And it gives me the first two rows
I'm kinda lost tbh
lyric canopy
@gilded dagger Try df.loc["Manamune", :]
 languid adder
i'm using a RandomForest and I check the feature importance after it has been trained.
I notice that some features have an importance of 0. Is it safe for me to remove these features from my dataset? Will that increase accuracy or only increase speed of training?
lapis sequoia
what features..
what is your goal..
it's bad practice to start with mentioning the algorithm first..
reef bone
@distant inlet I would encourage you to get comfortable with jupyter as soon as possible, it's an invaluable tool
My workflow now for bigger projects is to have a utilities.py file which holds some of my larger functions, and import this into the notebook
That way you don't need to pollute the notebook itself and can keep it clean
Also github can read and display the notebook format so that makes it incredibly easy to share your findings with others (including the results after each cell)
I honestly cannot imagine working with tensorflow without jupyter
JupyterLab is also available now and although still an early release (I believe), it's amazing
And I haven't been able to dig up the issue with sklearn's PCA so I might have made it up , but it was mostly likely addressed already
 dusk cedar
Hello, has anyone deeper experience with Kalman filters? I want to you them using 2 signals (multiple). I have only find solutions using one. Thank you
 primal kiln
where could i find dataset for heart disease predication
 earnest prawn
heart disease prediction based on what lol
blood stuff, gene stuff, weight against height stuff
etc
lapis sequoia
Kaggle for the win~?
https://www.kaggle.com/sonumj/heart-disease-dataset-from-uci
https://www.kaggle.com/c/heart-disease


Predict the occurrence of heart disease from medical data
Altho you could just download the UCI dataset from their own site https://archive.ics.uci.edu/ml/datasets/heart+Disease @primal kiln
distant inlet
@reef bone yup!!! Already doing everything in it
primal kiln
@lapis sequoia thanks man for your response
lapis sequoia
@primal kiln There's also datasets on data.gov from the usa. Anyways, you're welcome ^^
old axle
@lyric canopy alright, i was thinking about using datacamp, do you think its a worthwhile purchase?
 stoic rune
I would like to create an environment in a project directory, which includes all files for the python environment (e.g. ./bin/). I used the --prefix command with conda but this doesn't work. How can I accomplish this?
My goal is to create individual environments for each project, so I can backup environments for reproducibility.
 polar acorn
stoic rune
polar acorn
stoic rune
@polar acorn Thanks, I've read through that and can't figure it out.
polar acorn
Oh, have you run conda create --name insert_clever_name_here in the terminal from your working directory?
stoic rune
yes, and it creates an environment in the default directory, /Users/<user>/miniconda3/envs/pythonenv
polar acorn
Aha, and you want it in the project directory?
stoic rune
conda create --prefix env_name will create an env in the directory, but it only creates a history file
polar acorn
Hmm strange, works as it should for me.
stoic rune
really? That is strange. I just get a conda-meta directory.
do you get a bin file?
folder*
polar acorn
Hmm no you're right. No actual bin folder, strange.
stoic rune
if you do conda env list the directory shows up but without a name
polar acorn
That last part doesn't seem so strange. Creating a local conda env through pycharm works as expected but the name is still empty in conda env list
 orchid lintel
@languid adder Not necessarily. Good article on this: https://explained.ai/rf-importance/index.html
stoic rune
so I figured it out. You need to append python=3.6
conda create --prefix env_name python=3.6
polar acorn
Heh, I just stumbled upon the same solution just now.
obtuse skiff
Hey, Im doing k-nearest neighbor. When I cross validate and use tfidf I get around a 78-82% but as soon as I test the real data it's around a 56%
would this just be bad luck or is it probally that Im doing something wrong?
violet crag
What value should I look here to get best flights?
because plotting these many flights is not readable
lapis sequoia
why do you need a density plot
this is not the right approach.. you've to look at what type of visualization would suit and best represent your use case
start here
distant inlet
Value error : setting an array in sequence
#numpy is imported as np

np.array(mylist)

#gives me the above value error
What's wrong
can't I set an numpy array in sequence?

lapis sequoia
np.hstack(mylist)
 dusky tide
Where would be a good place to start working with Machine Learning?
distant inlet
np.hstack gave me a single D array ..I need a double D array
lapis sequoia
then work with list of lists.. instead of what you gave
like.. what even is this
[1,2,3,[4,5,6]]
old axle
does anyone think that datacamp would be a worthwhile purchase?
it seems like it doesnt offer a whole lot for what it is but i think i learn a lot better with it idk
lapis sequoia
they offer free access for students
lapis sequoia
are you a student
lapis sequoia
it's pricey
but useful
depends on your pace
and if you can keep yourself regular
old axle
ok
lapis sequoia
is anyone available? need to talk about the best way to make sense out of some numbers
violet crag
I took mean of the delay of the airlines and displayed 5 with least mean
is this correct way to judge, how do I find out the best airline from this?
and Tron, I saw your message later, I will look into that pdf now
 supple ferry
at first sight, I would say Hawaian Airlines 😃 But I would also look into CDF and then make conclusions
lapis sequoia
@old axle hey, I haven't tried datacamp, however, if you after the knowledge, not the paper, udacity offers free courses, which, to my experience are great.
supple ferry
@lapis sequoia , second that. Also, ISL is a good friendly book
violet crag
Should I even be considering the negative values here? because it doesn't really matter how early a flight arrives
lyric canopy
@violet crag There is no single way to determine what the best airline is, as it depends on the criteria relevant to you. For instance, do you care more about average performance or about the probability of having an ultra-long delay? Maybe you're interested in the proportion of flights within a certain acceptable range of delays or maybe you want to maximize the probability of really short/no delays, but don't mind an occasional ultra-long delay.
supple ferry
it really depends on your question. If you solely concentrate on delays then yes. but early arrivals can also disrupt the plans of the passengers.
supple ferry
it may happen, but not very likely
violet crag
never heard of that tbh
supple ferry
you need kinda this. with ranges
probability of delay being in range(a, b) for every airline, and take the one with least P as the best
this is simplest approach
for this, you need to have CDF
violet crag
@lyric canopy thanks, yea, some flights can arrive really early but others have long delay, should look for that in data
@supple ferry dunno what CDF is
supple ferry
cumulative distribution function
probability of random X being lower than given A
or equal
lapis sequoia
@supple ferry what book did you mention previously, would you please help out with the author or full name? I need to work on my statistics literacy, not sure where to start...
was that the one by gareth james and other?
lapis sequoia
oh yes, that is the one! Already on it. Thanks @reef bone
lyric canopy
Introduction to Statistical Learning?
Oh
Sorry, I'm blind
This is also a very good book (and shares some authors): https://web.stanford.edu/~hastie/ElemStatLearn/
Elements of Statistical Learning
It's a bit more math heavy, though, so beware
reef bone
Yeah this one I can vouch for
lyric canopy
It's freely available on that website (pdf)
lapis sequoia
oh, great! Thanks for this one as well @lyric canopy Let me get myself learning 😉
lyric canopy
I'm much more of a traditional statistician than a machine learning expert, though. Statistical Learning is where it ends for me.
primal kiln
can anyone suggest the best data science video in youtube?
lyric canopy
Yeah, it's great
supple ferry
it is quite math heavy, yes
@primal kiln , what topic you are interested in? there are 100k videos about data science. For beginner? for math part, or for programming part
if you are beginner, I strongly advise Machine Learning by Andrew Ng on Coursera
primal kiln
@supple ferry Thanks man for your response
supple ferry
@lapis sequoia , also, pattern recognition by Bishop worth reading. It has extended sections and quite math friendly
lapis sequoia
great! Thanks for the tips! You guys are such a resource! I hope I will be able to give back one day too! 😃
distant inlet
when i use .dtype method i get dtype('0')
What does that mean? I have only numbers in my numpy array so i shud get int64 ?
reef bone
Is that an O rather than 0? Think that means object
You can define the dtype yourself
arr = np.array([0], dtype='uint8')
>>> import numpy as np
>>>
>>> class Obj:
...     pass
...
>>> obj = Obj()
>>>
>>> np.array([obj]).dtype
dtype('O')
Not necessarily. If your array is consisting of integers, it will give int32 by default I guess (maybe it is changed now).
reef bone
I also thought so but now it seems to default to 64
>>> np.array([0]).dtype
dtype('int64')
On 1.16.1
old axle
@lapis sequoia okay ill check it out if it comes to that, but ive found really great success reading the documentation and rubber-duckying it
supple ferry
Any ideas for replacing pandas groupby of dataframe with numpy groupby (i know it doesnt exist). Ideas, approaches and etc?
as result i want to get from N x M dataframe with Aunique values on one column, lets say first column, an array of size A x N x M
 rancid gust
Can I ask some questions about scipy?
lyric canopy
@supple ferry have you considered sorting, finding the first row indice of each category, and providing that as an sorted array to np.split()?
lyric canopy
No, go ahead
Don't worry, this is not a help channel with a strict one conversation rule
rancid gust
Ok
I am trying to replicate this image, to do so I created a simulink simulation but matlab don't allow me to separate Y axis, which means all my signals are superposing themselves
So I was thinking in doing it with scipy
But when I try to firstly open my .mat (the workspace I've created from the simulink)
I get this:
>>> mat = sio.loadmat('../matlab/clock_generation_wksp.mat')
/usr/lib/python3/dist-packages/scipy/io/matlab/mio.py:136: MatReadWarning: Duplicate variable name "None" in stream - replacing previous with new
Consider mio5.varmats_from_mat to split file into single variable files
And then when i try to see whats inside of my mat
I get this:
mat
{'__header__': b'MATLAB 5.0 MAT-file, Platform: GLNXA64, Created on: Wed Feb 13 20:35:46 2019', '__version__': '1.0', '__globals__': [], 'None': MatlabOpaque([ (b'clock4', b'MCOS', b'timeseries', array([[3707764736],
       [         2],
       [         1],
       [         1],
       [        21],
       [         5]], dtype=uint32))],
             dtype=[('s0', 'O'), ('s1', 'O'), ('s2', 'O'), ('arr', 'O')]), 'tout': array([[  0. ],
       [  0.4],
       [  0.8],
       [  1.2],
       [  1.6],
       [  2. ],
       [  2.4],
       [  2.5],
       [  2.9],
       [  3.3],
       [  3.7],
       [  4.1],
       [  4.5],
       [  4.9],
       [  5. ],
       [  5.4],
       [  5.8],
       [  6.2],
       [  6.6],
       [  7. ],
       [  7.4],
       [  7.5],
       [  7.9],
       [  8.3],
       [  8.7],
       [  9.1],
       [  9.5],
       [  9.9],
       [ 10. ],
       [ 10.4],
       [ 10.8],
       [ 11.2],
       [ 11.6],
       [ 12. ],
       [ 12.4],
       [ 12.5],
       [ 12.9],
       [ 13.3],
       [ 13.7],
       [ 14.1],
       [ 14.5],
       [ 14.9],
       [ 15. ],
       [ 15.4],
       [ 15.8],
       [ 16.2],
       [ 16.6],
       [ 17. ],
       [ 17.4],
       [ 17.5],
       [ 17.9],
       [ 18.3],
       [ 18.7],
       [ 19.1],
       [ 19.5],
       [ 19.9],
       [ 20. ]]), '__function_workspace__': array([[ 0,  1, 73, ...,  0,  0,  0]], dtype=uint8)}
I should have 4 pairs of signals (from matlab) that I can easily plot in matlab by doing an plot(clock.time, clock.Data)
But I have 0 idea to how to do that in python
 marble plinth
Hey Guys,
https://blog.quantopian.com/markowitz-portfolio-optimization-2/
Anyone familiar with quant finance? Can someone help me understand a piece of code that is being used in this quantopian blog. The author uses quadratic programming with an equality constraint to generate optimal weights for a portfolio given a matrix of daily returns.
In this line of code a list is generated with optimal portfolios, they are the results of the cvxopt.solver.qp class. This part I understand, minimize wTCT s.t. Ax=1. However the author then basically uses np.polyfit to fit a second degree curve to the resulted optimal portfolios for different levels of returns, this obviously gives us the efficient frontier in the markowitz theory. What I do not understand is that the author then uses the the ratios of the coefficients C / A as the optimal level of returns out of all of the possible portfolios generated in the first list comprehension loop. You can see this with these lines of code:
CALCULATE THE 2ND DEGREE POLYNOMIAL OF THE FRONTIER CURVE
m1 = np.polyfit(returns, risks, 2)
x1 = np.sqrt(m1[2] / m1[0])
If our fitted curve has the form Ax2 + BX + C, then x1 represents C / A. C in this case will represent the given level of returns when the risk is 0, the risk free rate of investment, but I dont understand why dividing this numbers by the coefficient of our highest order term gives you the BEST possible level of return out of all of the portfolios.
Many thanks!

Authors: Dr. Thomas Starke, David Edwards, Dr. Thomas Wiecki Introduction In this blog post you will learn about the basic idea behind Markowitz portfolio optimization as well as how to do it in Python. We will then show how you can create a simple backtest that rebalances it...
supple ferry
@lyric canopy they are already sorted on the values of the first column. First column are ID values and I want to split them based on this
Is it possible?
lapis sequoia
sorry if I jump into middle of convo, but since we were sharing books earlier today, here is a helpful intro book for python for data science for begginer: https://jakevdp.github.io/PythonDataScienceHandbook/
violet crag
oh thanks, Maya
lyric canopy
@supple ferry Should be possible, but I don't think there's a convenient method or function to do it for you. np.unique should be able to find the unique entries and return their indices, meaning that you can use the first indice of each entry as the point for the np.split function. I've never done it, though, so you probably have to experiment a bit. It should be very possible, though.
supple ferry
I am now trying it with pd.groupby and then iterate over the groups, convert them to arrays and apply functions. This is the first thing came to my mind. Now, I will try to play around with the approach you suggested
lyric canopy
I've just checked, np.unique already returns only the first indice of each unique element, so you should be able to directly use it for split
lyric canopy
Something like this should work, @supple ferry :
>>> x
array([[ 0,  1],
       [ 0,  3],
       [ 0,  5],
       [ 0,  7],
       [ 1,  9],
       [ 1, 11],
       [ 1, 13],
       [ 1, 15]])
>>> u, i = np.unique(x[:, 0], return_index=True)
>>> list_of_arrays = np.split(x, i[1:])
>>> list_of_arrays
[array([[0, 1],
       [0, 3],
       [0, 5],
       [0, 7]]),
array([[ 1,  9],
       [ 1, 11],
       [ 1, 13],
       [ 1, 15]])]
Please note that you have to exclude the first indice (always 0), because otherwise you'll also get an empty array as the first array in list.
violet crag
why are there dots even beyond the upper limit line? 🤔
in box plots the upper limit lie, the 4th quartile one, represents the max value, right?
polar acorn
They are outliers, look into the documentation for what quantiles are plotted.
lyric canopy
It fits the figure you showed us earlier, look at the heavy tails at the right side of the distributions.
violet crag
yea, it does 🤔
reef bone
Does anyone here have experience with both pytorch and tensorflow and prefers pytorch? And would be willing to share their views / experiences? I've heard it can be easier to work with especially in terms of NLP. It's unlikely that I'd switch at this point, but still intrigued to hear peoples experiences. Also, is there something like tensorboard for pytorch? Ideally capable of nicely running over an ssh tunnel as with tensorboard?
reef bone
Perhaps this could be good >.>

GitHub
tensorboard for pytorch (and chainer, mxnet, numpy, ...) - lanpa/tensorboardX
 brisk imp
Hi guys, I'm trying to import a local python package into a Jupyter notebook for a data science project that are not in the same folder (I'm using Anaconda).
from my-package import *
I already have a folder for my package with a setup.py and tried installing it with python setup.py develop. But I get ModuleNotFoundError: No module named 'my-package' in notebook when trying to import it.
I also tried pip3 install -e ./ --userbut same problem.
I'm a bit lost because when I do conda listmy package shows in the output. I'm I missing something or I'm not doing it the right way?
 fervent solar
i would be thankful if someone explains this or share some resource for help
earnest prawn
i mean this just explains dynamic vs static typing and then goes a bit into the implementation detail of integers in python
whats your problem in understanding that? also how is that related to #data-science-and-ml
@fervent solar
lyric canopy
It's from a book about data science, I think, because this introduces Numpy
I don't know which book, though
violet crag
learning Central Limit Theorem
and Clyde deemed one other of my plot as explicit 🤣
fervent solar
Like ob_refcent...how this is working @earnest prawn
orchid lintel
@brisk imp Not sure exactly what's up, but these links may be of use: https://blog.godatadriven.com/write-less-terrible-notebook-code https://drivendata.github.io/cookiecutter-data-science/ https://www.internalpointers.com/post/modules-and-packages-create-python-project
GoDataDrivenBlog
A project template and directory structure for Python data science projects.
Internal Pointers
A quick and dirty tutorial on how to get things done.
brisk imp
@orchid lintel thank you i'll take a look at it
earnest prawn
@fervent solar well whenever there is a new reference to the object it gets incremented when one goes out of scope or is deleted it's decremented and if it's zero the object can't be used anymore so the gc murders it but you usually don't have to bother with that
rancid gust
Fellow ECE, do you guys use a lot of python for your works?
I mean, I want to be able to plot data extracted from Cadence/ADS and also create my on data (some logic diagrams for logic ports)
lapis sequoia
Evening! I am working on my first ever data analysis project and got stuck, is it ok to ask for some help as I am a little bit confused on how to proceed.
I have three different tables that I would like to merge into one, however, the only thing that overlaps are column names and indexes, thus, I find it hard to understand how to work on visualization later on. I though that maybe it would be a good idea to reshape it.
this how it looks now, my thought is if I could turn the year into a column it would be helpful. However, I am also stuck on how to do that, stacking did not provide results as I expected- it turned the whole table into series and made it even more complicated.
polar acorn
Try production.transpose to change row and columns
lapis sequoia
@pptt thanks for the thought! Let me try this out
hummm i wonder if there is a way to have info in the way:
country 1 year1
country1 year 2
country 1 year 3
when both year and countries are a column?
supple ferry
@lapis sequoia, you wanna merge 3 tables which have a common column? Or they have nothing common at all
lapis sequoia
there is nothing in common except indexes and column names
that is why i thought having years made into column would give me some base for merging
or should i give up on merging idea all together and rather work on visualizing from three different tables?
supple ferry
You need multi index then. First level index will be year, second will be country. Then, the first column is for production values, second column for consumption
Or, you can just merge on time and country. If index doesn't exist in one table, it will be replaced with nans
lapis sequoia
yes, that is what I would like to do, but how do I multi index then? Should I not be making year into a column then?
or if I merge tables as they are I get this
country year1 production year1 consumption
that puzzles me even more of how to work on visual
supple ferry
Multi indexing will be the best option. However, if you haven't done them yet, at first sight they might seem a bit complex to query
Yet, they are not
Pandas has very good guide how to create multi index tables and query them
 void anvil
With gridsearchCV, what do you need to set for verbose?
It's incredibly unclear
I started a grid search of 200 SVMs with verbose = 1 and it's been ~3 hours without a message
A single SVM with default parameters and the same data took about 4 minutes to train
I guess I would've expected some message about progress so fa r
Fitting 10 folds for each of 20 candidates, totalling 200 fits is the only thing dropped
lapis sequoia
@supple ferry alright, let me read upon multi indexing. Thanks for the idea!
supple ferry
@fervent solar , why you don't rotate the image, so that we dont have to rotate our computers. Joke aside, you wrote int_ instead of int
@void anvil , which IDE you use? it may be that, the error doesnt show up on IDE terminal. I recently had silent errors on Spyder when doing multiprocessing
@lapis sequoia, you welcome!
void anvil
jupyter
It's not an error
it's still running
it's just not displaying any progress
which I assume what verbose = 1 would let you know
supple ferry
yes it will
in my error case, it was also indefinitely running
check the recourses
you will see if there is some computation running
supple ferry
yes
ideally
maybe try run the same script via command line
it may give you errors on command line if there are any
void anvil
It's pretty short
I can dump the text to you
    #https://towardsdatascience.com/fine-tuning-a-classifier-in-scikit-learn-66e048c21e65
    from sklearn.model_selection import GridSearchCV
    from sklearn.model_selection import StratifiedKFold

    skf = StratifiedKFold(n_splits=10)
    grid_search = GridSearchCV(clf, param_grid, cv = skf, scoring=scorers, refit=refit_score, return_train_score=True, n_jobs=-1, verbose = 10)
    grid_search.fit(X_train, y_train)

    # make the predictions
    y_pred = grid_search.predict(X_test)

    print('Best params for {}'.format(refit_score))
    print(grid_search.best_params_)

    # confusion matrix on the test data.
    print('\nConfusion matrix of Model optimized for {} on the test data:'.format(refit_score))
    print(pd.DataFrame(confusion_matrix(y_test, y_pred),
                 columns=['pred_neg', 'pred_pos'], index=['neg', 'pos']))
    return grid_search

from sklearn.metrics import roc_curve, precision_recall_curve, auc, make_scorer, recall_score, accuracy_score, precision_score, confusion_matrix

ml_params = {
    'kernel': ['linear', 'poly', 'rbf', 'sigmoid'],
    'degree': [2,3,4],
    'tol': [1e-3, 1e-4, 1e-5]

scorers = {
    'precision_score': make_scorer(precision_score),
    'recall_score': make_scorer(recall_score),
    'accuracy_score': make_scorer(accuracy_score)
}
grid_search_clf = grid_search_wrapper(refit_score = 'recall_score', param_grid = ml_params, scoring = scorers, X_train = x_train, X_test = x_test, y_train = y_train, y_test = y_test, clf = svm.SVC())```the ensemble runs, I'm trying to grid search the individual model parameters to improve the ensemble
Yeah I think something bugged out
I ended the kernel but 6 processes kept running
void anvil
@supple ferry no luck on the console doing anything different. Going to boot up an AWS instance and let it run on there
supple ferry
@void anvil , if you run it with just one parameter, does it work ?
run greed search , nut with just one set of params
void anvil
it work for clf = mlpclassifiers
supple ferry
if not, then there is something wrong in the API
supple ferry
no, i mean greed search wrapping
in your ml_params, leave out all but one set of params
void anvil
yeah su re
I'm gu essing
that it's taking forever
because the tols are much smaller
1e-4 and 1e-5
which could take forever on this dataset
because it's hard
I think default tol is 1e-3
here's what I used for mlpclassifier
#ml_params = {
#    'activation': ['relu', 'tanh', 'logistic'],
#    'alpha': [1e-3, 1e-4, 1e-5, 1e-6],
#    'hidden_layer_sizes': [[100,25,], [50,50,], [75,25,25], [50,25,10]],
#    'max_iter': [100, 500, 1000, 2500]
#}```if it works normally on mlp, it should be way faster for linear models
this behavior is strange
void anvil
SVM
is way slower than MLP
by an order of magnitude
the only issue is
Gridsearch locks the computer down while it's going
80% CPU usage
supple ferry
oh sorry, I looked at the wrong code 😄
void anvil
fitting it now:
    'kernel': ['linear', 'poly', 'rbf', 'sigmoid'],
    #'degree': [2,3,4],
    #'tol': [1e-3, 1e-4, 1e-5]
#SVC(C=1.0, cache_size=200, class_weight=None, coef0=0.0,
#    decision_function_shape='ovr', degree=3, gamma='scale', kernel='rbf',
#    max_iter=-1, probability=False, random_state=None, shrinking=True,
#    tol=0.001, verbose=False)
}```

Fitting 3 folds for each of 4 candidates, totalling 12 fitsyes, it should be slower
void anvil
[Parallel(n_jobs=-1)]: Done 1 tasks | elapsed: 2.1min
supple ferry
linears are fast
void anvil
no way I'm going to let my machine run it for a week
linear kernel
SVM
yeah
I'm just going to fire up some amazon instances
and let them pay for electricity
supple ferry
good choice
void anvil
I don't know why it wasn't outputting anything
when I had everything else up
maybe it only does it at specific poitns>?
and I never made enough progress
tbh I really should look into numba or something and offload this to GPUs
void anvil
[Parallel(n_jobs=-1)]: Done 5 out of 12 | elapsed: 4.7min remaining: 6.6min
That's clearly a lie. 'rbf' is probably taking significantly longer than expected (which doesn't make sense given default uses RBF and takes ~5 minutes to run) or it didn't print and 'sigmoid' is fucking everything up'
void anvil
something has to be fucked
either on RBF
or sigmoid
@supple ferry
an hour ran no updates
 sharp nymph
I relate
fervent solar
But int_ is also a data type @supple ferry
supple ferry
@fervent solar , from the documentation:
Note that, above, we use the Python float object as a dtype. NumPy knows that int refers to np.int_, bool means np.bool_, that float is np.float_ and complex is np.complex_. The other data-types do not have Python equivalents.
try it with int instead
void anvil
@supple ferry looks like it's breaking with 'rbf'
Is it just divergent?
I've never seen an SVM not fit
nvm I take that back
runs with
'kernel': ['rbf', 'sigmoid'],
in 4 minutes
huh it's getting stuck on
'kernel': ['poly'],
the last fold
every time
it gets stuck in an infinite loop
and spawns a fuck ton of processes
=C
Is it possible to dump out the number of iterations each model takes?
Due overfitting issues I'd like to break before the model is 'fully fit' on the data
void anvil
literally just the standard
void anvil
running it now minus the poly fit
with cv = 3
we'll see if it runs or breaks out again
supple ferry
ok, it is three
void anvil
cv = crossvalidation
supple ferry
3 is the default.value for svm polynomial kernel. if other kernel is selected, that option is ignored
so, formula should be something like this (x_i + x_j + 1)^d
can you manually change to quadratic function if fails ?
void anvil
I mean
probably
I'm going to leave it running with these parameters for an hour or so while I go to the gym and see if it's put anything out:
    'degree': [2,3,4],
'tol': [1e-3, 1e-4, 1e-2]```after about 10 minutes it hasn't written anything
so I'm assuming it's silently erroring out
supple ferry
if you have degree option, this option will be ignored if kernel is not poly
void anvil
so that should be ignored
supple ferry
degree : int, optional (default=3)
Degree of the polynomial kernel function (‘poly’). Ignored by all other kernels.
from documentation
supple ferry
let me know how it ends
void anvil
based on computer resources it looks like it broke again. I wish I could have it print every time it starts trainign a new model
so I could figure out where it's breaking
because the docs are fucking useless
verbose : integer
Controls the verbosity: the higher, the more messages.

Stack Overflow
Okay, I'm just going to say starting out that I'm entirely new to SciKit-Learn and data science. But here is the issue and my current research on the problem. Code at the bottom.
Summary
I'm tryi...
accoring to this, n_jobs > 1 doesnt work on windows
supple ferry
so, if you have n_jobs > 1 it will output nothing even if you have verbose
supple ferry
im out of reasons for now..
supple ferry
mybe open an issue at their github about this
void anvil
eh mayeb
njobs = 1 looks like it's locking it to a sginle ore
single core
only using 17% cpu
instead of 50-70
this going to take way longer
supple ferry
i think you should try that one too, because it can be the issue here
void anvil
it very well could be
that multithreading support is shit on windows
it just sucks that everything is going to be slowed down significantly because of it
void anvil
about 10 mins have gone buy
nothing besides Fitting 3 folds for each of 9 candidates, totalling 27 fits
supple ferry
what is the shape of your dataset ?
supple ferry
yea, its not that big
void anvil
I really gotta go work out
I'll be back in a bit
hopefully this runs
but I'm doubtful
void anvil
yeah still borked
have to restart my compute
because killing python still didn't do it
violet crag
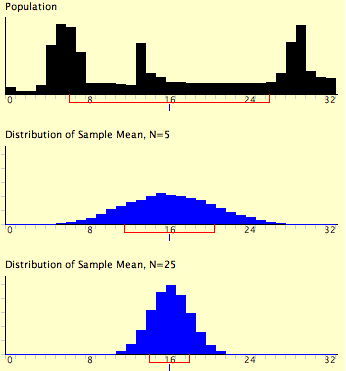
while teaching Central Limit Theorem, instructor mentioned 4 points, I have doubt with one:
- The sampling distribution of the mean would be less spread than the values in the population from which sample is drawn.
is it saying that the min and max of sample would be less than min and max of the population?
void anvil
@supple ferry what should I stick in the github issue

vs

top is uniform which is the case you're thinking of
supple ferry
Yes it will be so @violet crag. In most applications we do assume normal distribution
And that it resembles the population distribution
Key word here is resembling
void anvil

GitHub
This is going to be a bit shorter as I cannot determine with 100% accuracy what steps are causing this bug. Setup: Windows 10 most recent update Anaconda most recent update Jupyter Notebook and Pro...
supple ferry
@void anvil you can ask for the advise of creators at least. Whether there is a bug with poly functions
void anvil
It's not just poly functins
ml_params = {
'kernel': ['linear', 'rbf', 'sigmoid'],
tol': [1e-3, 1e-4, 1e-2]
}
is what I tried before working out
and it still failed
with n_jobs 1 and -1
supple ferry
Then this shit is more general
void anvil
yeah
it's something leaking I think
n_jobs = 1
doesn't spawn a thread in task manager
so I have to restart
to get rid of the core just spinning
supple ferry
Or, AWS Linux
void anvil
but yeah numba has been recommended to me by a number of people
would have to pay for an AWS linux box
I think
supple ferry
@void anvil, one of the reasons I moved recently to New country was that I did not speak that language 😁😁😁
supple ferry
It will probably finish in couple hours if code side is okay
Then you can turn them off
void anvil
yeah
I'll probably wait 'til tomorrow
or just boot a VM
on my machine
Is there a way to see how many views the issue has?
or get alerted if someone comments?
supple ferry
You will get notified if someone comments to your issue or any status change. If it is from other people, just comment something saying that you have the same
You will get subscribed to that issue
void anvil
ok
violet crag
@void anvil I think I am misunderstanding stuff here.
So instead of plotting a distribution of the values of sample, instead we make a bell curve distribution using the mean of sample to compare with the population distribution?
void anvil
you didn't pay attention in math
old axle
i didnt either, whats the j mean? i think its something to do with imaginary numbers but im not sure
okay it is
geez i really need to learn imaginary numbers
oh i see
thats cool
ill try to explain it to you, advitya
basically
when you do 4j
you are squaring it
or uhh
doing 4 to the power of 2
and then making the result negative
then absolute makes the result positive
so its basically the same as squaring the number in the first place.
@fervent solar
and then youre doing the other stuff
imaginary numbers are a good read
i recommend this site https://www.mathopenref.com/imaginary-number.html
 neat cipher
Where is a good place to do some very basic statistics in Python? Something like CodingBat but for extremely basic statistics. 😃
void anvil
@supple ferry
Might be a UWSGI multiprocessing problem? Related bug but pretty terrible writeup

GitHub
Hi I am using sklearn n_jobs = -1 for multi process training of my model but i am getting below error. sklearn.externals.joblib.externals.loky.process_executor.TerminatedWorkerError: A worker proce...
and potentially

GitHub
from math import sqrt from joblib import Parallel, delayed input_list = [x**2 for x in range(10)] def main(): with Parallel(n_jobs=3, backend='multiprocessing') as parallel: output = Parall...
supple ferry
@void anvil , it may be, issues look similar
but silent error, it is weird
Does anyone have here experience using Cython with Pandas, Numpy and Sklearn?
i presume it will be mostly Numpy that it will support. I have written a code which takes around 2 hours to run. Because I am not a programmer, my code is accepted. However, I want to optimize it as much as possible. for 300 mb data, it takes 2 hours, the data i have to work with weighs around 20 GB.
Anyone can look at my code and advise on approaches I should use?
violet crag
I was expecting the distribution of mean to look like Normal Distribution
as per Central Limit Theorem
is this okay?
I took 100 samples of size 30, then plotted their mean in red
supple ferry
what is your population size ?
Your sample will always tend to have mean of the population itself
i presume, your sample size 30 is too small. Did you try it with 100, 200, 500 ?
violet crag
@supple ferry
population size = 317113
I did try with bigger sample sizes, but it get only worse
violet crag
ok, my issue is solved
this is what Mean Distribution looks like when plotted independantly
supple ferry
Oh God, I wish I had zoomed in to that picture. Then I could have seen these axes
 obtuse kettle
If I have a df that has been gathered by a sqlite3 query of :
sql = "SELECT MembersTable.Name, Memberstable.Tag, increment_date, DonationsTable.Current_Donation From MembersTable, DonationsTable Where MembersTable.Tag = DonationsTable.Tag;"
Now I have a df and i have set the index to increment_data. I have figured out how to get the min/max of the whole df, but how do I get the min/max per user that is tag?
 wooden plover
Can anyone help me with a simple but a bit confusing numpy array question
supple ferry
@obtuse kettle , you can do df.groupby(by = "user")["fieldYouWantToFindMaxOf"].max()
@wooden plover , go on
wooden plover
I have a numpy array and I want to be able to index is using conditions on more than one column in one line
I know how to index off a condition with 1 column
supple ferry
x = np.arange(10).reshape(2,5)

x
Out[5]:
array([[0, 1, 2, 3, 4],
       [5, 6, 7, 8, 9]])

mask_1 = x[:, 3] > 5

mask_2 = x[:, 2] < 9

x[(mask_1 & mask_2)]
Out[8]: array([[5, 6, 7, 8, 9]])
you can do it like this @wooden plover
first mask applies only on 4rd column, second only on 3nd
and then you can combine them with & sign
wooden plover
And this can work with like multi dimensional numpys
with like 9 different dimensions. I'm sure I can work off that thank you
supple ferry
yes, just remember using correct columns
supple ferry
so in 9 dimensional, you will have something like this x[:, :, :, ..., 3] < 5
wooden plover
I have a joint prob dist represented by 7 params
so that is like 645 different combos
so I literally have 7 for loops
Thanks alot!
supple ferry
you welcome
supple ferry
80 % of the time, yes
wooden plover
So I have this 60x9 data set
supple ferry
if you can, you should always vectorize
wooden plover
and I want to do basically every combination possible on 7 of the columns
and count them
So I think using your index tip I can do that
most of the columns represents variables that take on 2 - 4 values
#there will be a large param matrix with 7 dimensions
HDParam2 = np.zeros((2,2,2,3,4,2,2))
def HDLotsOfParams(d):
    HDParam2 = np.zeros((2,2,2,3,4,2,2))
    x = d[:,(2,1,0)]
    # i: EIA
    for i in range(0,2):
        # j: ECG
        for j in range(0,2):
            #k: CH
            for k in range(0,2):
                #p: A
                for p in range(0,3):
                    #q: CP
                    for q in range(0,4):
                        #n: BP
                        for n in range(0,2):
                            #l: HR
                            for l in range(0,2):
                                HDParam2[i,j,k,p,q,n,l] = l
    return HDParam2
This is sort of the shell
rancid gust
Hey, I've generated this in python. There is anyway to put the legend of each graph in their own axis
Like this image
supple ferry
one way is to generate a text and place it manually on the given coordinates. yet, it may be some pain in the ass to do
rancid gust
And something like that is more feasible?
 true badger

 old axle
how can i display all the columns in a dataframe?
 placid snow
The column names?
void anvil
df.columns.values
will list all the names
@old axle you'll get faster responses in help
placid snow
Depends who reads it, and if it gets burried.
old axle
yep check #databases @void anvil
placid snow
To further add to that your question may get burried a lot faster in helpchannels if nobody is able to answer it within reasonable time
old axle
thats also true
ive found that when help & topical channels dont help the off topic ones can
obtuse kettle
Good evening. I am attempting to gather the "CurrentDonation" values for each unique 'Name' then getting the diff of the min and max for each name then saving the diff in a new column. May I have some guidance on how I can do this?
sql = "SELECT MembersTable.Name, Memberstable.Tag, increment_date, DonationsTable.Current_Donation From MembersTable, DonationsTable Where MembersTable.Tag = DonationsTable.Tag;"

df = pd.read_sql_query(sql, conn)

df['increment_date'] = pd.to_datetime(df['increment_date'], format='%Y-%m-%d %H:%M:%S')

#df.groupby('Name')['Current_Donation'].max()
df.groupby('Name')['Current_Donation'].agg(['min','max']).diff(axis=1)
 dawn quest

VentureBeat
Deep learning may need a new programming language that’s more flexible and easier to work with than Python, Facebook AI Research director Yann LeCun said today. It’s not yet clear if su…
 mossy dragon
anyone in charge of hiring data scientists?
what do you expect your data scientists to know when they go in and what are some questions that you ask them to test this?
primal kiln
Does anyone know how to convert this .data from uci machine learning repository into .csv?
rancid gust
Hey, does anyone knows why I am getting my plt.text so far from the plot?
This is what happens when I save
And this is what I get from spyder
import pandas as pd
from matplotlib import pyplot as plt

sample_data = pd.read_csv("../CSV_Results/8_pshase_andrews_400MHz.csv") #reading the CSV
sample_data.columns = sample_data.columns.str.strip().str.lower().str.replace(' ', '_').str.replace('(', '').str.replace(')', '').str.replace('/', '')
print(len(sample_data.clk_x.values))
a = sample_data.clk_x.values[288:1035]
plt.subplot(919)
plt.plot(a, sample_data.clk_y.values[288:1035], c = "black", linewidth = 2.0)
plt.text(0, 0.25, 'LO',dict(size=15))
plt.axis('off')

plt.subplot(918)
plt.plot(a, sample_data.s8_y.values[288:1035], c = "black", linewidth = 2.0)
plt.text(0, 0.25, '$0^\circ$',dict(size=15))
plt.axis('off')

plt.subplot(917)
plt.plot(a, sample_data.s4_y.values[288:1035], c = "black", linewidth = 2.0)
plt.text(0, 0.25, '$45^\circ$',dict(size=15))
plt.axis('off')

plt.subplot(916)
plt.plot(a, sample_data.s6_y.values[288:1035], c = "black", linewidth = 2.0)
plt.text(0, 0.25, '$90^\circ$',dict(size=15))
plt.axis('off')

plt.subplot(915)
plt.plot(a, sample_data.s2_y.values[288:1035], c = "black", linewidth = 2.0)
plt.text(0, 0.25, '$135^\circ$',dict(size=15))
plt.axis('off')

plt.subplot(914)
plt.plot(a, sample_data.s7_y.values[288:1035], c = "black", linewidth = 2.0)
plt.text(0, 0.25, '$180^\circ$',dict(size=15))
plt.axis('off')

plt.subplot(913)
plt.plot(a, sample_data.s3_y.values[288:1035], c = "black", linewidth = 2.0)
plt.text(0, 0.25, '$225^\circ$',dict(size=15))
plt.axis('off')

plt.subplot(912)
plt.plot(a, sample_data.s5_y.values[288:1035], c = "black", linewidth = 2.0)
plt.text(0, 0.25, '$270^\circ$',dict(size=15))
plt.axis('off')
plt.subplot(911)
plt.plot(a, sample_data.s1_y.values[288:1035], c = "black", linewidth = 2.0)
plt.text(0, 0.25, '$315^\circ$',dict(size=15))
plt.axis('off')

plt.savefig("../figs/8_pshase_andrews_400MHz.png", transparent=Trues)
plt.show()
So currently im inserting values from one dataframe to another where their index is matching. like this
for index, row in df.iterrows():
    s_0.loc[row.name] = row
But it seems to be very very slow, is there a better way ?
 marsh trellis
What parts of the Python language should I know to start learning Machine Learning and Data Science in 2019?
I'm familiar with programming (C/C++ main) and I would love to start learning about Machine Learning and Data Science. But I can already see that python is quite a big language especially given how many tremendously useful libraries it has. What parts of python ( given that a part is something like loops, if statements etc ) should I learn and what common libraries? I have heard about some of them like SciPy and Matplotlib. But I would love to know whats going to stand on my path to learning those ML and DS. Any books? Tutorials? A spectrum?
 fast spruce
@marsh trellis Pandas (https://pandas.pydata.org/) is all the rage these days. I don't use it nor know much about it, but I know that those that use it swear by it.
 storm gate
What does a good ML dataset look like? If I were to build one per say
 celest summit
- big
- covers a wide range of cases
- big
- easily accessed quickly (i.e., on a well-indexed SQL server)
- if for classification, has even representation for every class
- really hecking big
@storm gate
Oh, I also recommend feature scaling all of your data before starting training as opposed to doing it on the fly with each sample
lapis sequoia
hi everyone
so i had previously self.memory = np.zeros((MEMORY_CAPACITY, s_dim * 2 + a_dim + 1), dtype=np.float32)
but i want to add a variable "done" to my memory array
so i changed it to self.memory = np.zeros((MEMORY_CAPACITY, s_dim * 2 + a_dim + 2), dtype=np.float32)
then i added the done here
ddpg.store_transition(s, a, r / 10, s_, done)
and that stores all the valuyes in the memory array def store_transition(self, s, a, r, s_, done): transition = np.hstack((s, a, [r], s_, done)) index = self.pointer % MEMORY_CAPACITY # replace the old memory with new memory self.memory[index, :] = transition
and here i wanna fetch them
        indices = np.random.choice(MEMORY_CAPACITY, size=BATCH_SIZE)
        bt = self.memory[indices, :]
        bs = bt[:, :self.s_dim]
        ba = bt[:, self.s_dim: self.s_dim + self.a_dim]
        br = bt[:, -self.s_dim - 1: -self.s_dim]
        bs_ = bt[:, -self.s_dim:]
bd = bt[:, -1:]```so bd being the done variable
bs_ is s_ etc etc
so i can self.sess.run(self.ctrain, {self.S: bs, self.a: ba, self.R: br, self.S_: bs_, self.Done: bd})
do that
however
if i add a new value in the memory
this part
        bs = bt[:, :self.s_dim]
        ba = bt[:, self.s_dim: self.s_dim + self.a_dim]
        br = bt[:, -self.s_dim - 1: -self.s_dim]
        bs_ = bt[:, -self.s_dim:]
bd = bt[:, -1:]```where i fetch the values has to chance
so i grab with bd the latest, right, but the others have to shift aswel
and i don't know how to do that, could somebody help me out?
void anvil
@supple ferry
How do I assign weights in MLP or is that not an option? Am I looking at writing a custom loss function? I'm categorizing 0s very well but 1s pretty bad. It's more important that 1s are categorized correctly. Class balance is pretty great given the dataset (~51-53% 0 vs 1 for both train and test)
Grid searching for accuracy, recall, precision is 'improving' the model by more accurately classifying 0s which doesn't really help what I need it to do.
documentation looks like I can only do it with score
which isn't ideal
supple ferry
İ don't know about the custom loss function, but it is possible to write custom functions for sklearn algos. For example, you can write a custom distance function for KNN
@void anvil never tried it that way though
But theoretisch it should be possible
Sorry autocorrect. I meant theoretically
What is your model? Logit or probit
void anvil
Using SVM/MLP and a few others for a binary classification problem
basically the model works really well for classifying 0s
lapis sequoia
😦 Don’t forget my question
lapis sequoia
Np Just Don’t forget them as in for others
void anvil
any improvements in accuracy / precision / recall
are all boosting 0 classification
accuracy is at 54% which is really good
but it's 42% 1 and 65% 0 categorized correctly
I'll dump the confusion matrix one sec
             precision    recall  f1-score   support

       -1.0       0.56      0.11      0.19      1055
        1.0       0.48      0.90      0.62       945

avg / total 0.52 0.48 0.39 2000```was just the last iteration
I need to improve the -1 f1 score
basically
I need to increase precision on 1s
basically
The classification for -1 is satisfactory and the model will be saved for classification of -1, now I need to train a model that will classify 1s with a low FP rate
neg       121       934
pos        96       849
The predicted neg split is fantastic. I essentially need to do the same thing for the positive now
 wanton karma
Hello, I had a quick question - I am building an ontology, and I was wondering if there are any good data visualisation tools out there you would recommend to me 😃
gilded dagger
So I might be stupid but aren't jupyter jab, jupyter notebook, spyder, and pyqt pretty much the same thing?
I'm trying to decide which tool to use for a project and I'm in a sort of decision paralysis
(inb4 somebody tells me "use the one you prefer")
reef bone
Jupyter notebooks embed ipython kernels to allow you to execute your code one cell at a time, and hold all variables in memory unless told to release them, which makes it very easy to manipulate data, the notebook format supports Markdown which allows you to annotate each cell with rich text and mathematical notation, it's great for sharing code and experiments with others.. Notebooks are quite plain though, Jupyter Labs allow for more IDE-like features, it's still early release but from what I've seen it looks amazing.
Spyder is an IDE, and pyqt is a framework for building GUIs, not sure how you managed to bundle it with the others 
gilded dagger
Spyder also allows for cell execution and also holds all variables in memory, right?
I bundled them together because they're the 4 tools included with the anaconda dist
And they're pretty much all variations of iPython
reef bone
I'm not sure actually but yes it's likely, pycharm also has support for notebooks but it's not good
gilded dagger
I'm actually used to Pycharm currently, but for data analysis it's pretty stiff
reef bone
Yeah I work with notebooks using the web app
Pycharm essentially embeds the notebook but it's quite buggy
I would assume Spyder probably handles it better since it's for scientific python but I haven't used it personally
The best part about jupyter lab is that it has a dark theme
There's a thing for Atom called hydrogen that is apparently really good, but I never liked Atom too much

gilded dagger
But... aren't all those tools doing the EXACT SAME THING?
With only small implementation differences?
Like, Jupyter notebooks are pretty much navigator IDEs

JetBrains Plugin Repository
Welcome to the JetBrains plugin repository
<- like there's even a cell mode for Pycharm, aren't those pretty much the same thing? I'm friggin lost 
reef bone
Notebook would be more like a file format, and the web app is just an interface to communicate with the kernel that can read the notebook format
I wouldn't call it an IDE, it highlights syntax and that's about it
We might be able to recommend the right tool for the job if you specify what your project is, otherwise I'm afraid it really does come down to personal preference
(except for pyqt, that's for something entirely different)
gilded dagger
otherwise I'm afraid it really does come down to personal preference
<- ok so they're the same tools I guess
My use case is just that I have a large SQL database as the backbone of a lot of data analysis I do, and I wanna find something convenient for that
Usually I start with an sql alchemy query that I load into a pandas dataframe, and go from there
Pycharm actually looks great outside of the horrendous pandas integration 😢
old axle
huh
gilded dagger
Why would one stuff be for dev and one for analysis? Like, you want literally the same features in both cases, with just a slightly different layout.
I'm still battling Spyder, PyCharm cell mode, and Jupyter atm to see which one feels best
But they all feel bad so I dunno what to do 😢
lapis sequoia
have you tried Jupyter lab
gilded dagger
Yes, and doing anything coding-based in a browser with limited keyboard shortcuts sounds akin to torture to me.
I'm not doing analysis with neatly packed csv files, I'm doing a lot of requesting with sqlalchemy as well to get the right data.
lapis sequoia
I don't remember the last time I did anything outside of a browser :v lol
 thin totem
disagree Tolki. The interactive environment in jupyter makes it ideal for data science projects
pycharm is a huge pain to use cause youd basically render the whole thing every time
and a lot of data science is just running methods on data just once to 'see' what it shows,
like just asking df.quantile and so on, you dont want that in your full code, but youre just having a look
if you had to reload the code from the top every time like a window in pycharm would make you - it'd be a nightmare, especially if the first thing you did was load in a csv so gigantic it took a minute
you'll understand when you get into it - pycharm and other IDEs are a pain for analysis work
btw kwzrd there is a way to dark mode jupyter itself without going to jupyter labs, you can load themes in remotely - but theyre not as nice from what ive seen as the native one in Jlab
lapis sequoia
Oui
polar acorn
Has anybody used the tsfresh package for feature extraction from time series?
I have successfully extracted some features from a time series. But is there anyway to make tsfresh easily extract the same features from another time series?
Also does anyone know if the extracted features can be sorted by importance?
lapis sequoia

reddit
43 votes and 22 comments so far on Reddit
what would you say is the equivalent representation of this visualization in tabular format?
violet crag
(for assignment)need some question suggestions to answer through dataviz, preferably something I can find data on
For example: Is there a relationship between melting point and atomic number? Are the brightness and color of stars correlated? Are there different patterns of nucleotides in different regions in human DNA?
earnest prawn
arent those good questions already?
@violet crag
or are those just some examples given by whoever gave you this task and you need to think of your own?
earnest prawn
why does the fusion in stars never produce bigger atoms than iron
(the answer ist that at some point the coloumb force so the electromagnetical force from the protons inside the core (which is ofc the force you have to surpass when you want to bring a new proton into the atom) is bigger than the energy you get from putting a new proton in there and that point just happens to be at iron)
youll get some nice looking graph with which you can also explain why nuclear fission works
and why fusion gets you more energy and whatnot
that however is a question already answered if you need something unanswered i can try think of something else
violet crag
@earnest prawn that's an amazing question, can you think of some more, answered ones are also fine
supple ferry
@gilded dagger i am using mainly Spyder for my research. It is both code editor and also cell based ipython notebook too. Not ideal, but there is also code check and intellisense
@violet crag should questions only be about physics-based, astronomy or anything?
violet crag
can be anything
earnest prawn
a relatively simple one would be why its computationally too expensive to compute RSA or ECDSA keys
supple ferry
Is there any relationship between boiling point and altitude
Yes there is 😀
Spoilers
earnest prawn
or as an extension of that
why quantum computers are such a big danger for asymmetric cryptography as of now
supple ferry
You can also calculate or simulate different processes with Monte Carlo method
violet crag
Is there any relationship between boiling point and altitude
like this
guys give me simple ones, they haven't even taught linear regression yet
it's in next module
earnest prawn
the answer would just be a height vs boiling point graph lol
supple ferry
@earnest prawnyes 😀
violet crag
@supple ferry nice, they want me to make an interactive dataviz
supple ferry
Simple stuff
@violet crag oh if you want some interactivity, you can use ipython for that. Forgot that package name.. Damn. But there is also one which I have used and it has python Api. Vega
earnest prawn
wikipedia suggests that this would be the formula youd have to use
youd have to ofc calculate the pressure at height x for that
and then done
supple ferry
Ipywidgets. For it
Got it
@earnest prawn not pressure. The height and boiling temperature. Pressure is the reason of the relationship
earnest prawn
yes but in order to calculate his boiling temperature data hed have to have pressure according to this
and as pressure and height are related hed have to get is data this way unless there is already data available
void anvil
Instead of grid searching over model recall / precision, can you grid search over individual classifier's precision / recall / f1-score (e.g. 1.0 precision)?
             precision    recall  f1-score   support

       -1.0       0.56      0.11      0.19      1055
        1.0       0.48      0.90      0.62       945

avg / total 0.52 0.48 0.39 2000```the answer to the cryptography one would be plotting the most efficient prime factorization algorithm on normal computers vs key length and the one on quantum computers vs key length which would result in two graphs with the quantum one being a lot lower than the normal one for big key lengths
supple ferry
Okay, we have several topics altogether here 😀
void anvil
Online calculator, figures and tables showing boiling points of water at pressures ranging from 14.7 to 3200 psia (1 to 220 bara). Temperature given as °C, °F, K and °R.
earnest prawn
(they dont want him to do what we suggest at all)
supple ferry
@void anvil you can do average metrics per classifier in cross validation
void anvil
how does that work?
supple ferry
Take classifier X - logit model. Do cross val 10 fold or 100 fold. Take the average metric you are interested
It will anyways give you by default average metrics
void anvil
right I don't want that
supple ferry
Which reflects the true power of classifier
void anvil
I don't care about the overall classifier power
supple ferry
Then I misunderstood. Can you make your point clear?
void anvil
I just care about specific performance cases
Instead of grid searching over model recall / precision, can you grid search over individual classifier's precision / recall / f1-score (e.g. 1.0 precision)?
             precision    recall  f1-score   support

       -1.0       0.56      0.11      0.19      1055
        1.0       0.48      0.90      0.62       945

avg / total 0.52 0.48 0.39 2000```I want to specifically improve the 1.0 precision from 0.48 as high as I can
I don't care about -1 precision or either recall
void anvil
There are only two classes, don't think there's a difference for 1vall vs 1v1
void anvil
Boosting, etc. are improving overall model
supple ferry
Perhaps lower
void anvil
but decreasing 1.0 precision
supple ferry
Yea, it ix like dance with fire
supple ferry
I'm on vacation. I have some time 😀😀
void anvil
I assume y_score : array, shape = [n_samples]
is the predicted values?
supple ferry
Python?
supple ferry
You need accuracy and threshold values too
void anvil
I have the fully trained model + train/test splits
call should just be print(sklearn.metrics.roc_curve(y_true = y_test, y_score = y_pred))
right?
supple ferry
No
Wait
predictions_ap_simple = model_ap_simple.predict(X_test)
fpr, tpr, _ = metrics.roc_curve(y_test,  predictions_ap_simple)
auc = metrics.roc_auc_score(y_test, predictions_ap_simple)
plt.plot(fpr,tpr,label="data 1, auc="+str(auc))
plt.title("ROC for Simple Affinity Propagation Model (within, size, frac)")
plt.xlabel("False positive rate")
plt.ylabel("True positive rate")
plt.legend(loc=4)
plt.savefig("ROCforSimpleAffinityPropagationModel.png")
plt.show()
something like this
i need to see the plot
void anvil
A 53/47 split is very good