#data-science-and-ml
1 messages · Page 188 of 1
 zealous ermine
im using cropped images such as those, and comparing them against other character images cropped in the same way, but drawn with a different font, to see if theyre the same character
right now, im using MSE to compare the 2 images - so i might compare the image against the whole alphabet in another font, and whichever character it matches best with, thats the character i assign it
so like the japanese extra thick is written with japanese characters
乇
and that would be compared against a-z, A-Z and whichever was most similar is what it would be
so in that case E
the thing is, i dont really get how these functions work, so im not really sure which one to use for this
does anyone have any idea how they work, so they can tell me which would be the most effective here?
(testing a lot of characters would be pretty labour intensive cuz id have to find them and then check them manually)
 velvet anchor
I covered MSE in AP Stats
and NRMSE seems pretty similar just, you know, normalized
what do you wanna know about how they work
zealous ermine
Wait i’ll dm u this tomorrow so we’re not taking up the channel
Other ppl u can use it now
 serene oar
Hello.
I am using pandas to read a csv file and I have assigned the "Date" column as the index.
The data is about the volume and price of a stock. Is it possible to somehow assign weekdays to the dates and from there bring out on what days the biggest volume of shares on average was sold or the average of every weekday in general for comparison?
Would making nested lists of 5 indices per list and comparing their values their positions have be a good option?
Or would that be too inefficient?
serene oar
Found properties: got fix. Sry for noise
 analog rampart
how many lectures are there in andrews ng's ML course
 prime thistle
does anyone know of a way to check image similarity in python?
velvet anchor
I thought OpenCV had a method for it but I don't think it does upon researching
here's a way you can use MSE to compare @prime thistle https://www.pyimagesearch.com/2014/09/15/python-compare-two-images/
@zealous ermine this is also relevant to you I think
prime thistle
nice find
velvet anchor
Also here, same technique explained differently http://scikit-image.org/docs/dev/auto_examples/transform/plot_ssim.html
prime thistle
its way faster than i expected
prime thistle
i have nearly 2k
and i would like to be able to 'plot' them in some way or another
to see which images are close to each other and which are not
possibly even cluster them
velvet anchor
That seems reasonable but you'll definiteily want to cache the values in some way
velvet anchor
Because 2k images compared to 2k images is uh, quite a large number
velvet anchor
Yeah
and trying to store it all in ram 👌
Well I guess that’s only 32mb. Seemed much bigger in my head
velvet anchor
Matplotlib will handle the drawing for you.
Or rather can handle the amount of points
You’ll just have to decide how you want it graphed
You could also use Jupyter and graph it inside the canvas
prime thistle
well i think the literal drawing would be fine
but im looking for measures of similarity
to place them on axes
velvet anchor
Yeah I just meant like matplotlib would be a good library to handle plotting.
prime thistle
funny how its still the go to lib
prime thistle
its kinda sweet
zealous ermine
@velvet anchor i’ve seen that - that’s why I originally went with SSIM
but MSE turned out to work a lot better
velvet anchor
👌
zealous ermine
@prime thistle get like a 96GB ram server from digital ocean for a couple of hours (write and test the code before hand) and then just use that so u can cache all the images at once
(Idk how big your images are, u might need less)
velvet anchor
At 1080p quality to hold 2,001 in memory (all 2000 and the comparing image) its 16gb of ram
So to hold all of them it'd be like 40gb probably to hold everything
zealous ermine
That’s it? Damn thought it would be more
Wait then why does he need 40 if it’s 16?
velvet anchor
... nvm i'm dumb I doubled it
zealous ermine
😂😂
velvet anchor
because, mentally, I was like
you need 2000 images and then 2000 to compare them all
disregarding the fact its the same 2000
zealous ermine
That would still only be 32 not sure where u got the extra 8 from
velvet anchor
Just from like holding the numbers, the matplot, OS overhead
zealous ermine
8 GB for that?!!
velvet anchor
Seems reasonable to ensure you dont run oom
zealous ermine
The plot is xy, so 2 numbers per photo - how much storage can 4000 numbers possibly take 😂
velvet anchor
Yeah I mean its overkill but #napkinmath
 lapis sequoia
What can be done with a simple basic neural net? (example: in:[1, 0, 1] out:[0,0,1] )
velvet anchor
Well some of the very basic ones are used in tutorials like determining if the numbers passed are representative of a flower species for instance. It’s a little more complex than that, but not by a whole lot
prime thistle
ill try to build it and ill tell you haha
 dense siren
Hi guys. I posted this question in a help server, but since it is computational astro, I decided to reach out here as people in this thread may have more specific knowledge for my problem. 😃
My question is about how I can solve a coupled system of ODE's, and print out the variables in a plot.
https://paste.pythondiscord.com/ijehedevug.py Note, the q here is replaced by F variable
 placid snow
Is M supposed to be raised to the power of 2 in (48/(5*math.pi*M**2))?
dense siren
Oops yes, LaTex error.
placid snow
And where is x defined in py F = x[:,0] e = x[:,1]
dense siren
that was meant to be y (fixed): https://paste.pythondiscord.com/hibasiluxa.py
 chrome seal
has anyone taken a look at the most recent kaggle challenge? thoughts?
https://www.kaggle.com/c/airbus-ship-detection

Find ships on satellite images as quickly as possible
velvet anchor
That’s cool
serene oar
Hello.
I got a feeling I shouldn't be plotting like this.. confirm?
 df = pd.read_csv(str, parse_dates=True)
        df.plot(subplots=True, figsize=(6, 6), sharex=True)
        plt.show()
I want to assign the X axis to be the date instead of the random index that's in the file.
How can I do that?
This is the current outcome.
The Y axis sets itself automatically to what I want it to be. Although I'd like it to show the actual (huge) numbers other than making it smaller by removing zeros.
Main problem is - how can I assign the Date column to be the shared X axis?
Ohhh, that's a Pandas problem. No wonder..
prime thistle
are the axes even different right now?
 brazen spade
Should i normalize the dataframe columns prior to creating a heatmap from a dataframe with 10 or so columns. Do you really only want columns with variable data, removing the categorical data?
prime thistle
whats your definition of normalising
serene oar
The X axis is shared, Y is different.
WOrking with stock price vs volume here. Volume is on a waaayy higher scale.
 dreamy tartan
Hi everyone,
I stuck on something and couldnt figure it out. I have train and test datasets about customers info. There are some difference values between them, difference are numeric values, life-time and customer choices [choices are binary and my target]
I trained my model and predict test data. Results were fine. Accuracy is 86%, also predict 0 and predict 1 accuracy rates are pretty good. Till here everything looking fine. Problem came up when i wanted to predict filtered data from train data. I applied special filter on data like that: in output which were 0 in train data and became 1 in test data. So i predict it and accuracy of results are not even close to 86%. Its less than 20%
I couldnt understand why accuracy is so bad. Any idea?
prime thistle
so you and a train and test set
which were unfiltered
and real data which is filtered
you question is a bit difficult to understand to me
velvet anchor
So @dreamy tartan to specify a little more
Your accuracy, like the number in training is good, and then when you pass in data to the model using your predict function, that data is also good?
 dense oak
Hey all simple question, just learning how to use sklearn.metrics.accuracy_score . Is a higher score better, or a lower score better? ex. 0.734 vs 0.523
 dusky agate
i guess higher is better, do you have a link to the docs?
velvet anchor
Higher is better in p much every other ML framework
lapis sequoia
Hello
dreamy tartan
@velvet anchor Yes when i predict my all test data and compare result with test_output. Accuracy is also good.
prime thistle
But is that filtered like the filtered data you mentioned later in the question?
 heady sail
I just wrote my own Binary Search Tree. Could someone tell me if I did anything in correctly/inefficiently? ```python
class Node:
def init(self,val):
self.val = val
self.leftchild = None
self.rightchild = None
class bst:
def init(self,inp):
self.inp = inp
self.root = Node(inp)
'''Inserts a new item into the tree
Num: is the input of the new number or it can be a list
nde: is the node we are checking(root by default)'''
def insert(self,num,nde = None):
if nde is None:
nde = self.root
#check if num is an int
if type(num) == int:
#compares num with the current nde and makes sure that the leftchild is empty
if num < nde.val and nde.leftchild is None:
n = Node(num)
nde.leftchild = n
# compares num with the current nde and makes sure that the rightchild is empty
elif num > nde.val and nde.rightchild is None:
n = Node(num)
nde.rightchild = n
elif num < nde.val:
self.insert(num,nde.leftchild)
elif num > nde.val:
self.insert(num,nde.rightchild)
def search(self,inp,nde = None):
    if nde is None:
        nde = self.root
    if inp is nde.val:
        return inp
    if inp is False:
        return None
    elif inp < nde.val and nde.leftchild is not None:
        return self.search(inp,nde.leftchild)
    elif inp > nde.val and nde.rightchild is not None:
        return self.search(inp,nde.rightchild)```
 lone mist
first thing you could improve is making the bst not rely on having an initial/root node passed in
even if you don't, this line self.inp = inp is useless
furthermore, you could nest some if statements to save on comparisons
for example, you have if num < nde.val and nde.leftchild is None:
but then you later do just elif num < nde.val:
you could have justif num < nde.val and add a nested check for nde.leftchild is None
velvet anchor
I did a bst for a school project not long ago
lone mist
fun stuff
lone mist
@heady sail should mention you so you dont forget 😃
velvet anchor
Not solely a bst though. Was half bst and then a linked list that ran along the tree too
heady sail
Thanks for the resources and comments 😄
velvet anchor
No problem. I’d clean it up, but it’s turned in already so there’s no incentive. 😂
 stone oasis
@velvet anchor just rebuild the tree brah, no problems here. 😂 
velvet anchor
👌🏾
stone oasis
👌🏿 fuck the big O
velvet anchor
its binary search that means its n log n by default
 scarlet mist
Sooooooooooooo... Is anyone familiar with this bad boy: https://github.com/watson-developer-cloud/python-sdk/blob/develop/README.md

GitHub
python-sdk - :snake: Client library to use the IBM Watson services in Python and available in pip as watson-developer-cloud
velvet anchor
most of the people who will prolly wont be around until tomorrow id wager but it at least wont get buried here
scarlet mist
Much appreciated.
scarlet mist
Okay, so right now, I'm just trying to figure out authentication. Here's my code:
from watson_developer_cloud import ToneAnalyzerV3 as tav3
tone = tav3(version = '2017-09-21',
username = 'username',
password = 'password')
tone = tav3(version = '2017-09-21')
tone.set_username_and_password('username',
'password')
and here's my console output:
runfile('C:/Users/kjohn/OneDrive/Desktop/Watson.py', wdir='C:/Users/kjohn/OneDrive/Desktop')
Traceback (most recent call last):
File "<ipython-input-7-0c81ff784954>", line 1, in <module>
runfile('C:/Users/kjohn/OneDrive/Desktop/Watson.py', wdir='C:/Users/kjohn/OneDrive/Desktop')
File "C:\Users\kjohn\Anaconda3\lib\site-packages\spyder\utils\site\sitecustomize.py", line 705, in runfile
execfile(filename, namespace)
File "C:\Users\kjohn\Anaconda3\lib\site-packages\spyder\utils\site\sitecustomize.py", line 102, in execfile
exec(compile(f.read(), filename, 'exec'), namespace)
File "C:/Users/kjohn/OneDrive/Desktop/Watson.py", line 17, in <module>
tone = tav3(version = '2017-09-21')
File "C:\Users\kjohn\Anaconda3\lib\site-packages\watson_developer_cloud\tone_analyzer_v3.py", line 105, in init
use_vcap_services=True)
File "C:\Users\kjohn\Anaconda3\lib\site-packages\watson_developer_cloud\watson_service.py", line 272, in init
'You must specify your IAM api key or username and password service '
ValueError: You must specify your IAM api key or username and password service credentials (Note: these are different from your Bluemix id)
velvet anchor
Are you user and password corrrect?
scarlet mist
I copied them directly from the ones listed in my service instance on Bluemix.
And I'm following the documentation to a T, excepting the service being called.
velvet anchor
Try your other user and password combination just to be sure
That way it’s 100% an error with something you’ve done and not just a dumb mistake we all make
scarlet mist
Eeeeeeh... Also tried the service in the documentation examples with a different (paired to that specific instance of that service) credentials), and the same error got thrown in my face.
velvet anchor
Hmm. Okay I’ll be at work and can take a closer look in a few. Just doing the small basic stuff while en route :p
scarlet mist
Well dang, just look at you multitasking.
Debugging and driving at the same time?
I take it you've figured out how to import multiprocessing to IRL?
velvet anchor
Not driving. Just in line for food and waking dog and stuff :p
scarlet mist
Ah, gotcha!
velvet anchor
@scarlet mist making an account here to toy around with it
scarlet mist
Sweet, thanks for lending a hand.
velvet anchor
which service did you make?
also @scarlet mist i get no errors with my py file being
from watson_developer_cloud import ToneAnalyzerV3 as tav3

tone = tav3(version = '2017-09-21', username = "username_here", password = "password here")
Worked for me as well, after commenting out the last couple of lines. But I was under the impression that I need them after instantiating tone.
Or am I misunderstanding their usage?
Also, I have both the discovery and tone analyzer services running.
@velvet anchor
velvet anchor
i dont think you need both lines
i think its just showing 2 different ways to initialize the connection
scarlet mist
Oh! I see, it's showing how to alter parameters after tone is instantiated.
That makes a good bit more sense.
Thanks for the extra set of eyes!
 thorn river
How could I use sets to calculate (for example) true positives, without creating a confusion matrix first?
Given I have two lists, y_true, y_pred. For example:
y_pred = [0, 0, 0, 0, 2, 0, 0, 0, 2, 0, 1, 2, 0, 0, 0, 0, 1, 1]```


Where 0 = no spam, 1 = spam, 2 = phishing

i created the first sets like this:

 ```really_spam = [i for (i,v) in enumerate(y_true) if v == 1]
spam_set = set(really_spam)

pred_spam = [i for (i,v) in enumerate(y_pred) if v ==1]

pred_spam_set = set(pred_spam)```


How would I go about calculating true positives for spam using the two sets?

Any help is much appreciatedQuestion has been answered in #help-coconut
 glad pivot
I've got a question for anybody that's here
I am working through the Data Science Nanodegree through Udacity and am having a bit of trouble understanding some gradient descent concepts
I am working through an assignment where I am implementing and training a neural network, and I am tasked to write some of the helper functions
So here are some functions that were given to me:
def sigmoid(x):
    return 1 / (1 + np.exp(-x))
def sigmoid_prime(x):
    return sigmoid(x) * (1-sigmoid(x))
def error_formula(y, output):
    return - y*np.log(output) - (1 - y) * np.log(1-output)
And I was tasked to write the error_term_formula, which takes y and output as arguments
So this is the error term formula: −(y−ŷ )σ′(x)
And this is Udacity's "solution" to writing the error_term_formula:
def error_term_formula(y, output):
    return (y-output) * output * (1 - output)
Can anyone help me understand why it is being written like this and why they are not utilizing the sigmoid_prime() function?
 feral lodge
Yo man, say the neuron's error is the squared error
E = -(y - ŷ)² and we want to compute the derivative of the error with respect to the neuron's input z. That means we want to find out out in what manner the error E changes if we "wiggle" z by just a little bit -- if we know that, we can change z in such a way as to lower E. The small changes of E as a result of small changes in z are described by the derivative of E w.r.t. z:
∂E/∂z
But the error isn't a function of z, it's a function of ŷ! However, ŷ, the output, is a function of z, the input. So the situation is like this: E = f(ŷ(z)). That means that if we wiggle z a little bit, then ŷ will also wiggle a little bit as a result -- then the E will finally also wiggle a little bit. This propagation of wiggles is described by the chain rule:
∂E/∂z = ∂E/∂ŷ * ∂ŷ/∂z
Now, we know that
E = -(y - ŷ)² and ŷ = σ(z)
which means that ```
∂E/∂z = ∂E/∂ŷ * ∂ŷ/∂z
= -2(y - ŷ) * (-1) * ŷ * (1 - ŷ)
Where I put some extra spaces in the middle to show the difference between `∂E/∂ŷ` and `∂ŷ/∂z`.

Now, you'll notice that this formula equals `2(y - ŷ) * ŷ * (1 - ŷ)`, ie Udacity's formula multiplied by a factor `2`. The `2` comes from my using the squared error -- maybe Udacity defines the error to be `E = -(y - ŷ)` instead. @glad pivotSo there's no need to use sigmoid_prime and waste CPU cycles in this case; we would just get a value we already have
glad pivot
@feral lodge Thank you so, so much! This helps immensely, none of the "mentors" at Udacity have responded to my question. This makes a lot more sense!
feral lodge
Glad to help friendo! 👌
glad pivot
I can show you the training function where it is being implemented, maybe that will help me understand if they are using the MSE or not
feral lodge
Let's have a look
glad pivot
It won't let me paste in a codeblock longer than 2,000 chars
 desert cradle
desert cradle
desert cradle
really almost any pastebin site's fine, but worth noting there is an official one
glad pivot
Ok sounds good, I get the idea that you all really know what you're doing here in comparison to Udacity's Slack channel
I can provide the helper functions as well if needed
It says # Printing out the mean square error on the training set
# Activation (sigmoid) function
def sigmoid(x):
    return 1 / (1 + np.exp(-x))
def sigmoid_prime(x):
    return sigmoid(x) * (1-sigmoid(x))
def error_formula(y, output):
    return - y*np.log(output) - (1 - y) * np.log(1-output)
# TODO: Write the error term formula
def error_term_formula(y, output):
    return (y-output) * output * (1 - output)
So I suppose it is just squaring them at a later point
Also I just realized I already posted those functions earlier 😛
feral lodge
Hmm, looks like there's an error in their code 🤔 The error_formula you're using there, is the log-loss formula, used when we have two possible outputs, 1 and 0.
The log-loss looks like this:
logloss(y, ŷ)
    if y == 1:
        return -log(ŷ)
    else if y == 0:
        return -log(1-ŷ)
    else:
        undefined
Which can equivalently be written like Udacity did:
    return - y*log(ŷ) - (1 - y) * log(1-ŷ)```
However, the error derivative (that I showed eariler) was the result of differentiating the error `E = (y - ŷ)` They mention this in the code, line 27:
```python
           # The error, the target minus the network output
           error = error_formula(y, output)
I'm guessing they were intending to use the log-loss, but changed their minds and forgot to change the error computation
glad pivot
I understand all of that I think, but the log loss formula itself doesn't return a binary value, correct?
feral lodge
Correct
glad pivot
It simply omits one site of the equation given if it was correctly classified or not
feral lodge
You can switch between log-loss, squared loss and whatever no problem. But you have to change the error differentiation formula accordingly
What is the optimum for one loss type may not be the optimum for another
So computing the log loss, but using the differentiation of another loss is not correct
glad pivot
Ah so they are using two different methods here
They are computing the error with one method, and then using the derived (gradient) of another formula?
feral lodge
Yarp
Which may work fine is the optima of these two error types are close
But is almost certainly unintended
glad pivot
It seems as if they are; I don't think they would have published it if they weren't
So in order for this to be 100% accurate, what would you change?
I apologise if I'm pulling you from your papers
feral lodge
def error_formula(y, output):
    return y - output
I think 🤔
But not using the squared error is unusual, they should probably stick to that
feral lodge
So I would personally use
def error_formula(y, output):
    return (y-output)**2
def error_term_formula(y, output):
    return -2 * (y-output) * output * (1 - output)
I'll run it as is, show the output, make your change, and show
feral lodge
Regarding this:
loss = np.mean((out - targets) ** 2)```

That's just for printing as far as I can tellSo it's like this:
They wanted to use log loss, but changed their minds. They fixed the differentiation, but forgot to fix the actual error to the non-squared error.
For printing the progress however, they show the squared error
So there are three error functions floating about
feral lodge
Yes, we also have to pay attention to the gradient descent
glad pivot
No that makes sense! In case anyone is lurking
feral lodge
Kk, sweet 😄
You'll observe that in my squared error function, i return Udacity's original error derivative multiplied by a factor of -2 yeah? Previously it was just 2, because I had, in my first explanation, defined the error to be E = -(y-ŷ)². But in my code you'll notice I opted for E = (y-ŷ)². This is the usual case; generally the error is positive, leading to a negated derivative
glad pivot
Yes that makes more sense, they even went over that in their lectures
But I didn't know why it wasn't showing up in their code. I have a feeling that they adopted this code from some other lecture series, and didn't really give it that much editing
It would have to be squared--or else the error would be misrepresented, or close to zero even
but they are also taking 1/m * sum(MSE)
And they said it was that way for convention's sake
feral lodge
This leads to the typical form of gradient descent -- using a minus sign in the update of the weights. You'll see on line 42 they update their weights like this:
weights += learnrate * del_w / n_records
This is unusual. Usually, we use -= in gradient descent; ie when we're minimizing. += is usually used when doing gradient ascent; ie when we're maximizing. The way they've done it is to define a negative error, where we usually use a positive error. This leads to their weight update adding instead of subtracting. You can read a bit about it here if you want https://medium.com/@aerinykim/why-do-we-subtract-the-slope-a-in-gradient-descent-73c7368644fa
Yes I think they've done some last-minute changes to their log loss coverage. I found this github ticket regarding their lectures https://github.com/udacity/sdc-issue-reports/issues/1331
glad pivot
That was also confusing to me, but that also makes more sense. I had calculated GD in previous labs, and had always subtracted incrementally until reaching a minimum
That only further affirms my suspicions that it is third-party content adopted to their course
Well I guess going through this whole ordeal has helped me understand a little bit better, at least
I hope you're a teacher! (You mentioned papers...) Only because you're so great at explaining difficult concepts
feral lodge
Thank you for the kinds words my friend! 😄 I'm just a master's student currently, but I'll definitely have to do some teaching down the line as part of my doctorate
The papers are research papers 😃 Coincidentally, also about neural networks! https://arxiv.org/pdf/1703.01961.pdf
glad pivot
Well if you ever need to practice teaching , I would be happy to be on the receiving end 😄
The end of this section of the course requires an Image Classifier programme, which I'm sure I will need some help with 😫
feral lodge
Just ask away, there are a few of us here who've worked with image classifiers and the like 👌
glad pivot
Oh man, I am not great with math notation. I could never do higher ed in DS
feral lodge
Math was an acquired taste for me, don't sell yourself short!
glad pivot
I haven't even taken a proper linear algebra course 🤣
feral lodge
I took remedial maths as a kid 👀
glad pivot
Just BC calculus in high school
Which then waived my requirements for maths in college, so my brain got really really rusty with derivatives and such
I majored in Finance, by the way
feral lodge
Machine learning will be useful for you then!
Youtube channels like khan academy and 3blue1brown are golden for getting a fetter feel for math notation by the way! (khan has a great series on linear algebra; you couldn't ask for a better introduction to that subject imo) Usually the concepts are simple and intuitive enough, and the notation is just a convenient way to convey it
glad pivot
You mean applying ML in Finance? Yes I agree, especially for trading and such. I have taken several "refresher" courses on LA in the past few weeks, and I understand all of the concepts just fine, I think. Determinants, Matmul, Linear transformations, etc., I just wouldn't be able to sit down and work out a problem by hand
 lean ledge
I think  's essence of linear algebra is a gold mine and an absolute treasure. One of the best resources out there
glad pivot
I have taken that! It is incredible
 coarse perch
Any mini projects you people can suggest?
 dense ocean
anyone dealing with dedupeio and having performance problems when you take a generator back from matchBlocks and try to convert it into a list() ?
it seems that dedupeio is efficient with cores (happily consumed 8 cores on this box), but when I get my clustered list back and try to do anything with it (ie. clustered_list = list(clustered_list), python is restricting itself to a single core
serene oar
Hi, how do you go about grabbing data from Yahoo finance nowadays? I used the fix_yahoo_finance import, but it returns some weird in the Volume column
 proud pond
does AI , ML stuff go under #data-science-and-ml ?
glad pivot
@serene oar i've been using source="morningstar" for my financial queries
When using pandas_datareader
And that seems to work just fine for me
serene oar
👍
 bronze coyote
I know this isn't Python related , but does anyone here use R? Trying to do a conditional statement and hitting a wall. Finding it difficult to find resources.
scarlet mist
Not strictly Python related, but I got my datasets from Python... Let's say I have a set of metadata from 16,000 tweets dating back to late 2010 (the end of history for tweets containing a given stock ticker), and a set of historical stock data dating back to 2006. If I want to potentially find a correlation between metrics relating to tweets and stock performance, should I include dates all the way back to 2006 in my regressions/correl-coeff analysis, or should I only include dates back to the end of tweet history?
Also, @glad pivot is the Morningstar API working again? It broke a few days ago and forced me to learn another api.
glad pivot
I haven’t used it for a month or so, so maybe it is broken. I haven’t checked
scarlet mist
Ah. I haven't checked it in a few days, but if it is still broken, the Quandl api is a nice susbsitute.
 polar acorn
@bronze coyote post code sample?
 void anvil
Any good packages for markowitz optimization? I think PYMCEF might be breaking
HL me if you know a different one
proud pond
hey guys ,
can someone suggest to me a playlist on Youtube to watch for learning AI , i want to learn how to make AI that can play games , and i know almost nothing about AI so where should i start ?
void anvil
Are there any good packages for markowitz optimization / other similar stuff?
serene oar
Hi!
If there are 2 datasets I want to combine, but the dates wont match, how can I go about this?
I currently took a real estate index, and converted it into an annual mean. The other data I have is the GDP, but it only has the year number as its index. When I added this data into one dataframe, it print NaN to every GDP measure.
GDP imports as with this date format: 2000, 2001, 2002...
real estate index date is : 2015-02-01... etc
How can I have it to be a shared year number only?
Index is from Quandl, GDP from World Bank.
Can I at least add -12-31 to the end of the GDP date, as that's the date I get for each year when I take the annual mean?
 ionic roost
hello group
i am taking intro to data science this fall at a college level
i have been developing in python for seven months now but they use R in that class
does anybody have good free resources or online textbooks for introductions?
polar acorn
Here's a free book on R for data science that I never read, but that someone once recommended me. http://r4ds.had.co.nz/

This book will teach you how to do data science with R: You’ll learn how to get your data into R, get it into the most useful structure, transform it, visualise it and model it. In this book, you will find a practicum of skills for data science. Just as a chemist learns how...
I might add it's written by Hadley Wickham, a name you are guaranteed to run into if you're using R for data science.
ionic roost
My teacher just told me in email that's the book we are using! Interesting.
Thanks for help
 vague dock
Hi there! Not sure if this is the right place to ask, but does anyone know if matplotlib (imshow() specifically) only works in Jupyter notebook? Is there no default display function outside of the notebook?
import matplotlib.pyplot as plt
plt.imshow(some_image)```

Thanks!Try adding plt.show()?
vague dock
@pptt thanks so much, works great 👌
 muted niche
Does anyone happen to know off the top of their head what features would be good to extract from accelerometer data? I'm trying to classify movments
 lapis plume
Hi, is there any good resource for an intro to statistics with Python?
 small ore
@muted niche out of curiosity, how ( in what format) is the accelerometer data available to you?
muted niche
@small ore It gets streamed from my phone as a string that is comma separated. I take what I need from the string and store it as a float in a numpy array
 lilac shadow
perhaps it would be a good idea to provide an example of how this accelerometer data is laid out in your array, but i'm not too sure. it would actually be interesting to see some visualisations of what this data looks like though. ^-^
small ore
@muted niche is it just (ax, ay, az, plumb) or more data in the stream? Or in other words what data do you have in each packet of the stream?
small ore
Cool
muted niche
polling rate is around 16-17 Hz
at first I just chucked the raw data into an SVM model but that's not correct I need to extract features from the data I recieve and use those values in the SVM
small ore
I can imagine a lot of different use cases from the accelerometer data. I suppose it will depend on your exact application how you process it
muted niche
I'm trying to classify different activities, walking and falling for the most part
small ore
Like if you are making an app to determine the velocity of the vehicle you are traveling you need to get the exact acceleration or in the direction of your travel and integrate it by some means.
I suggest making use of the plumb data in addition to your ax, ay, az as it seems to be logical to me that all the actions you mention is corelated to it
lilac shadow
that's certainly an interesting idea. is this data transferred from your phone to the python application through sockets or something like that?
small ore
Also why not just plain logistic regression?
lilac shadow
oh that looks like it would be good, actually
small ore
Juan, as far as I can imagine he just needs to somehow record raw data on his phone and transfer by any means to the system he is using to analyze them. ( Need not be real time). Once you get the prediction equation he may need to use the real time data if his use case is to predict an activity as soon as it happens
lilac shadow
oh i see. if it's real-time however, then that would certainly be fancy :D
small ore
The phone shouting out "I am falling, help me!" ? 😛
lilac shadow
haha, there's an app for that™
muted niche
it is in realtime
lilac shadow
tell me more.
muted niche
it is more to classify human movement
lilac shadow
 muted niche
what is plumb data?
im making a system that detects when a person falls and sends an ert
small ore
Okay. Do you know how an accelerometer works?
muted niche
it uses accelerometer data from a phome amd images from a webcam
not entirely, i know how to get the xyz data
small ore
While there are bound to be accelerometers working on different ways, an example would be an instrument that produces an electrical output corresponding to the finite difference of the movement. So it is not absolute acceleration that is available to you from the instrument but a series of values which is the difference from the previous value. It is relative data.
muted niche
that sounds like it would explain why the first reading is always 0,0,0
small ore
Suppose you have an application to locate the stars in the sky and are using the back camera of the phone to super-impose the image with a map of stars. You have your screen facing downwards. If you do not have a way to know which direction your phone is tilted and just know x, y and z accelerations, then it is impossible to know if your screen is facing downwards or upwards ( In general the orientation of the phone cannot be fully determined just with (ax, ay, az)
A plumb line in engineering practice ( Or say plumbing practice) is a device used to determine if a line is straight and oriented along the gravity of the earth. Phones have separate plumb sensors ( coz accelerometer data alone is insufficient to determine orientation) . You use this data to determine which direction the gravity of earth is pointing to
May go with different names than plumb. I am not sure
Do I make sense or did I confuse you?
muted niche
no, that definitely makes sense.
I thought it would be possible to get orientation from accelerometer alone though
lilac shadow
i was actually wondering how the device determines the orientation, that's certainly interesting.
muted niche
what ever sensor reads -9.8 is facing up/down
vague dock
I've been reading along and wondering: would it have merit to transform the data from relative to previous frame to relative to 0-frame (absolute-ish) for the problem of classifying movements?
small ore
Accelerometers does not pick up earth's gravity as acceleration. But the (ax, ay, az) data you have got may already have been processedby your phone to add data from the plumb sensors. So it may already be adjusted for it
muted niche
I was thinking I would need to perform some sort of statistical analysis on the data, standard deviation, fft the data and get energy of the signal etc
small ore
Esp if you are getting a 9.8 when you hold it constant
muted niche
Ah right, that would explain why the accelerometer reads -9.8 when aligned with the up/down axis
small ore
@vague dock I am not sure what exactly you mean but I am thinking some processed data from the previous few seconds ( Example: Simple moving average) could perhaps be needed
vague dock
well, for example instead of having [0, 1, 1, 2, 2, -1, -3, -5] you'd have [0, 1, 2, 4, 6, 5, 2, -3]
so instead of difference to previous frame you'd have the sum that represents difference with the first frame
small ore
But in a series of continuous data you will need a function that processes data over the previous few frames
Coz I think a 'fall' or some such action is a function over a few frames
vague dock
yeah, but aren't all movements are actions over multiple frames?
muted niche
I'm keeping my buffer/window size to 61 data points
that is enough to capture the whole "fall" signal
So I need to do some signal processing on that window
small ore
Oh. Also Shakis, I am thinking of a non ML approach. Do know that differential of displacement is velocity, differential of velocity is acceleration and differential of acceleration is jerk ( all over time).
muted niche
I did not know that.
I am not even sure I know what differential is. Sounds a bit calculusy
(nor jerk)
small ore
A fall tends to get finite values of jerk whereas the simple walking would have 0 or very small jerk
muted niche
Alright, that sounds like a really good one to use.
small ore
differential is certainly the calculus one. ANd one can numerically integrate/differentiate signals
vague dock
Differential of a function f(x) is another function f'(x). f'(x) gives the rate of change/slope of f(x) at x
muted niche
Okay, I understand that and I'm sure I remember how to do it somewhere deep in my memory lol
if not, google is my friend
small ore
Just try to plot velocity/acceleration/jerk for your various activity ( A couple of examples each?) and you will perhaps hit upon an idea of filtering it
muted niche
Okay, that sounds like a really good starting point tyvm
small ore
A fall should ( I think) be marked with jerk spikes
vague dock
have fun
small ore
Yeah. That is indeed a fun idea
lilac shadow
can confirm
vague dock
also you could try to plot position by integrating, but without knowing initial position/velocity/acceleration could be innacurate
small ore
( I would if possible like to see your visualization plots if you can manage it)
muted niche
I will post back once I have something to show.
oh one more question
differential of displacement: what is the displacement?
small ore
Bitchmoon, you are technically correct but I am thinking if integrating without an initial condition( or an assumed initial condition) should still give out some graphs that could distinguish activities somehow. We do not need exact velocity values here
vague dock
Not certain about the terminology, I'd guess position at time x + 1 - position at time x?
small ore
Displacement in this context is how much your phone moved in a particular timeframe in a given direction
vague dock
True, that's why it's just offhand suggestion, might give some insights
small ore
Hm hm. Also try dropping your phone from 2 metres high upon a matress or something and see if the 'free fall' case records '0' acceleration in the z direction for most of the fall. There may be a way to filter a deterministic data even if your phone is rotating while it falls. I will need to think hard on my basic mechanics
lean ledge
Lol do any of you have a background in engineering or signal analysis
With an accelerometer if you're getting real-time data run it through a kalman filter to get accurate meaningful readings, use pythagoras to measure magnitude of acceleration. When it's falling, it will have an overall acceleration reading of almost 0. There are lots of ways to figure out when its not normal. Blindly measuring for acceleration until its under some magnitude should be enough given it's passed through a KF
@small ore @lilac shadow Almost all accelerometers you see will be MEMs. Pretty much all work on the same principle as a mass hanging from a spring
And I dont recommend using an accelerometer to predict position or velocity to any extent, the errors pile up very quickly so the drift is insane and unusable outside of small periods of time
lilac shadow
@muted niche would be good to mention with this too.
lean ledge
@small ore It's called a "derivative" not a "differential". A differential specifically is the infinitesimal quantity of something( "dx"). A derivative is the ratio of two differentials, with the overall quantity being the derivative of the top quantity with respect to the bottom quantity (dx/dt is the first derivative of x with respect to time)
muted niche
@lean ledge thanks very much! I'll look into KF
 teal veldt
Hello folks, I'm currently reading and working through the Python Data Science Handbook, and there's a specific section that I'm having trouble understanding. If needed I can link the page, but the issue is that, after creating a 10 x 2 array to simulate points on a X,Y graph it calculates the distance between them by summing the square differences using the following code
dist_sq = np.sum((X[:, np.newaxis, :] - X[np.newaxis, :, :]) ** 2, axis=-1)
Why is he putting a np.newaxis into the array?
Can't he just leave it as (X[: , :] - X[ :, :]) and numpy will just broadcast the subtraction to each point?
polar acorn
Well (X[: , :] - X[ :, :]) would just give you an 10x2 array of zeros?
teal veldt
Oh.
So, I kind of understand that since there's 10 points and we need to calculate the differences between each of them we need to add a dimension to the array
Since there will be a total of 100 measurements
But why was the np.newaxis put in two different places in the formula?
polar acorn
First off I'm not quite sure what you mean by 100 measurements. You have two vectors with 10 elements, the distance between them is found by first taking the difference element by element, giving you 10 differences (x_1-y_2, x_2-y_2, ...., x_10-y_10), squaring and summing these and then taking the root of that sum.
You could have done this easier, you could have done np.sum((X[0 , :] - X[ 1 , :]) ** 2, axis=-1). The reason we aren't doing this is because this only works when we have two vectors. What if we have three? We could copy paste the previous line multiple times and change the indexes but that would be a hassle. Instead we use the first method because that gives us a distance matrix.
polar acorn
Now feel free to correct if I'm far off but this is what I think the idea is. X[:, np.newaxis, :]changes your matrix from a 2x10 matrix to a 2x1x10 matrix. In the same way X[np.newaxis, :, :]changes a 2x10 into a 1x2x10.
Imagine these new matrixes like follows, where v1, is your first vector of X[0,:] and y is the second vector X[1,:] and the z dimension is into the screen. Our two new matrixes then looks like this.
⎡v1⎤
⎣v2⎦, [v1, v2]
Subtracting these two from each other I suppose numpy broadcasts to the following
⎡v1-v1, v1-v2⎤
⎣v2-v1, v2-v2⎦
Where the subtraction is done element wise on all 10 elements in the z dimension. Now squaring all these element differences in the z dimension and adding them up gives you the distance between v1 and v1, v1 and v2, v2 and v1 and v2 and v2. This 2x2 matrix is what you get if you do this in python. Now this works for any number of vectors of course.
@teal veldt Did that make sense?
small ore
@muted niche Here is one site which maybe useful:https://towardsdatascience.com/kalman-filter-an-algorithm-for-making-sense-from-the-insights-of-various-sensors-fused-together-ddf67597f35e
Has basic explanation of Kalmann filter in text and math. Also has python implementation

Towards Data Science
An Algorithm that is an Astrologer for the Sensor fusion process.It can predict a estimate for you and would correct itself if its…
And it has got some amazing links in the "Useful Links" section too
muted niche
ah, cheers! @small ore
 tight dove
Hi guys
I got a dictionary like this -
dict = {
  "Glo": [ "0705", "0807", "0805", "0811", "0815", "0905"],
  "Airtel": ["0701", "0708", "0802", "0808", "0812", "0902", "0907"],
  "MTN": ["0703", "0706", "0803", "0806", "0810", "0813", "0814", "0816", "0816"],
  "Etisalat": ["0809", "0817", "0818", "0908", "0909"],
  "Multilinks": ["07027", "0709"],
  "Visafone": ["07025", "07026", "0704"],
  "Starcomms": ["07028", "07029", "0819"],
  "Zoom": ["0707"],
  "Ntel": ["0804"],
  "Smile": ["0702"]
}
How do I print out the key given a specific value from the lists?
placid snow
My first thought would be to iterate through key, value pairs and check if your desired_value is in the value part of your loop
tight dove
with conventional dictionaries, I use pandas like this -
import pandas as pd
dict = {
  "Glo": [ "0705", "0807", "0805", "0811", "0815", "0905"],
  "Airtel": ["0701", "0708", "0802", "0808", "0812", "0902", "0907"],
  "MTN": ["0703", "0706", "0803", "0806", "0810", "0813", "0814", "0816", "0816"],
  "Etisalat": ["0809", "0817", "0818", "0908", "0909"],
  "Multilinks": ["07027", "0709"],
  "Visafone": ["07025", "07026", "0704"],
  "Starcomms": ["07028", "07029", "0819"],
  "Zoom": ["0707"],
  "Ntel": ["0804"],
  "Smile": ["0702"]
}
network = pd.Series(dict)
print (network[network.values == '0806'])
But I have a dictionary with list of values for each key
tight dove
Hi @placid snow
So I did this
dictionary = {
  "Glo": [ "0705", "0807", "0805", "0811", "0815", "0905"],
  "Airtel": ["0701", "0708", "0802", "0808", "0812", "0902", "0907"],
  "MTN": ["0703", "0706", "0803", "0806", "0810", "0813", "0814", "0816", "0816"],
  "Etisalat": ["0809", "0817", "0818", "0908", "0909"],
  "Multilinks": ["07027", "0709"],
  "Visafone": ["07025", "07026", "0704"],
  "Starcomms": ["07028", "07029", "0819"],
  "Zoom": ["0707"],
  "Ntel": ["0804"],
  "Smile": ["0702"]
}

number = "0706"
for key, value in dictionary.items():
  s = set(value)
  if number in s:
    print(key)
Why convert the list to a set?
placid snow
I mean, somewhat. But you're not working with big lists here?
tight dove
Lol no, but in case what i'm working on scales
placid snow
Alrighty
lean ledge
@tight dove doing set() is even slower
lean ledge
It wouldn't be if it was already a set
But to convert it into the set
It already has to iterate over all of the things in the list
placid snow
I'd assume the check would be faster, but the conversion would take a while compared
tight dove
I was thinking initially iterate through the check if the value is contained in the list
@lean ledge hmmm
So what's best practice then?
Don't want to do anything anti-pattern
lean ledge
Accessing from set is O(1) but construction using set() is O(n). Just iterating over the list is also O(n). All you do by doing set() is waste a function call unless you plan on reusing that set again and again
Just do it without the set
Or store sets in the original dict rather than keys
tight dove
Ok, so this would suffice then
number = "0806"
for key, value in dictionary.items():
  if number in value:
    print(key)
Yep
teal veldt
@polar acorn Yes, it does, thank you so much for taking your time to explain that in detail, I really appreciate it
 jade robin
ٴٴٴٴٴ
 south quest
@jade robin you're going to have to add a nickname which complies with our nickname policy.
Your current name is a character which messes around with how text is displayed
south quest
Also, don't send hidden unicode characters in help channels, that's considered spam
jade robin
roger that
placid snow
Is there any preferred way of storing training / test data?
I worked with 50,000 .txt files with my recent uni course. Doesn't sound like the best way of storing the data
placid snow
While I'm at it, how would I go about loading 160k lines of json into memory, so I can rewrite it with proper indentation
velvet anchor
Will probably all fit honestly unless the lines are massive
Even if every like is 1k that’s only ~200 megs
Storing data doesn’t super matter really depending on framework. Just with what’s easiest to use. Keras / tf have generator options to feed into a model
 turbid bay
hey just a quick question. But i was wondering whether anyone would want to help teach me about machine learning. I've tried looking at tutorials online etc. but whenever i have tried to do anything without a tutorial i have no clue where to start. If anyone would like to teach me that'd be highly appreciated. thanks
lean ledge
@placid snow Try looking at HDF5
placid snow
@velvet anchor must be massive then, i ran into a MemoryError trying to load the json into memory so i could re-write it with indentation
Will do raggu
the json file itself it 150mb
velvet anchor
@turbid bay Andrew Ngs course on coursera
glad pivot
Jose Portilla on Udemy
turbid bay
i will. thanks @velvet anchor
velvet anchor
Having personally taken it myself its quite good
widely regarded as one of the best
its also free, unless you want the certificate afterwards.
turbid bay
do you mind sending me a link please
velvet anchor

Coursera
Machine Learning from Stanford University. Machine learning is the science of getting computers to act without being explicitly programmed. In the past decade, machine learning has given us self-driving cars, practical speech recognition, ...
Some people recommend this one as well
turbid bay
thankyou very much
lapis sequoia
@velvet anchor Any book do you recommend to start on Data Science ?
velvet anchor
Not that I have personal recommendations on.
glad pivot
@feral lodge have you used PyTorch at all?
glad pivot
I'm having some issues loading in some image data and can't seem to figure out why I'm getting the error I am
velvet anchor
I liked it too but I wound up moving to Keras after a bit
glad pivot
data_dir = 'Cat_Dog_data'

# TODO: Define transforms for the training data and testing data
train_transforms = transforms.Compose([transforms.RandomRotation(30),
                                       transforms.RandomResizedCrop(224),
                                       transforms.RandomHorizontalFlip(),
                                       transforms.ToTensor(),
                                       transforms.Normalize([0.5, 0.5, 0.5],
                                                            [0.5, 0.5, 0.5])])

test_trainsforms = transforms.Compose([transforms.Resize(255),
                                transforms.CenterCrop(224),
                                transforms.ToTensor(),
                                transforms.Normalize([0.5, 0.5, 0.5],
                                                    [0.5, 0.5, 0.5])])


# Pass transforms in here, then run the next cell to see how the transforms look
train_data = datasets.ImageFolder(data_dir + '/train', transform=train_transforms)
test_data = datasets.ImageFolder(data_dir + '/test', transform=test_transforms)

trainloader = torch.utils.data.DataLoader(train_data, batch_size=32)
testloader = torch.utils.data.DataLoader(test_data, batch_size=32)
Let's have a look bren, if I can't help probably someone else can
glad pivot
# change this to the trainloader or testloader
data_iter = iter(testloader)

images, labels = next(data_iter)
fig, axes = plt.subplots(figsize=(10,4), ncols=4)
for ii in range(4):
    ax = axes[ii]
    helper.imshow(images[ii], ax=ax)
invalid argument 0: Sizes of tensors must match except in dimension 0. Got 500 and 280 in dimension 2 at /Users/soumith/code/builder/wheel/pytorch-src/aten/src/TH/generic/THTensorMath.cpp:3616
feral lodge
I'll probably switch to keras or tensorflow for my thesis yeah
glad pivot
So I'm loading in the Cat/Dog data from Kaggle
And I was tasked with the TODOs you can see above
They didn't really give me much instruction here, so I might be doing something completely wrong
The dog/cat data are in .png format I believe
Oh no actually they're .jpg
feral lodge
https://medium.com/@yvanscher/pytorch-tip-yielding-image-sizes-6a776eb4115b This guy says to set batch_size to 1 when you get this error
glad pivot
I tried that, and it didn't fix it
I mean I guess it kind of fixes it?
That just messes with Udacity's helper functions though
But you wouldn't want to run a forward pass with batches of one image..
placid snow
What's the correct way to append rows to a dataframe?
feral lodge
df.append https://pandas.pydata.org/pandas-docs/stable/generated/pandas.DataFrame.append.html works too, without specifying axis 🐸 👌
placid snow
What exactly is axis in this context
And, don't append need a series ?
Hang on, I have dataframes im appending. silly me
feral lodge
Axis is 0 for rows, 1 for columns
placid snow
Ah, that explains why I got 6k columns c:
feral lodge
No idea about your tensors tbh bren 🤔 Only thing I can think of is to check the image sizes
feral lodge
Can't hurt, you can always go back and try to fix it again if this turns out to be a requisite for understanding the next lessons
glad pivot
That is the instruction here, if that helps provide a little more context to the problem? Don't feel obligated if you don't have time!
I'm pretty sure that jpgs only have 3 color channels?
feral lodge
I'll have a look again tomorrow friendo, long day for me! Hopefully someone can help before then
Yep
feral lodge
Give it a go 😮 Feel free to write the fix if they can help, I'd like to know
velvet anchor
I've had this error in Keras before but I don't remember how I solved it
are your images actually loading?
like is the directory correct?
glad pivot
yes, directory is correct
i've got one image to load correctly
so it works when I switch out the testloader for the trainloader, the only difference here is that they are in different subdirectories
and that the data isn't being randomized
but i was able to get non-randomized data to work earlier
glad pivot
they're all different sizes
even the testing ones
*training ones
so for some reason it is working for the training but not testing set
glad pivot
dataset is local
velvet anchor
may be a minute before I can look at it though about to leave class
its this one right?
glad pivot
yes that's t
this is the code
shouldn't have any sensitive info on it
it is utilizing some external (local) modules
velvet anchor
kk lemme get home and I can take a closer look
 cerulean mica
Can anyone help with a qlearn issue/python issue? keep on getting value errors >.<
serene oar
Hi, when plotting with mpld3 to html, it loses the X axis values for me, making it be from -1 to 23, instead of having the years 1995-2017.
When plotting with pyplot, everything is as it should be.
How can I have the exact same plot in html with mpld3, as I have with pyplot?
 analog crane
hello, what would be the fastest way to check if an image is (almost - compression) the same as another one ? (need to compare it to somewhere around 1000 pictures but stop if a good enough match is found)(modifié)
pngs
velvet anchor
You could look into perceptual hashes
You could also downscale the images super small. Like to 8x8 or something and then do some math to compute a similarity score
A quick one is using the square of the distance for all 3 colors
 novel path
Hey all, I’m struggling with a dataframe manipulation question (posted #help-coconut ). Thanks a lot to take a look if you have some time.
 summer plover
@lone mist have been pinged in the help channel, he might get online soon. maybe you could repost your question here @novel path just for the more ease of access to the question
novel path
Ok, thanks for the tip @summer plover
I'm struggling with a df case. I’d like to cipy the High values from source table for all Year-Week matching
these two tables are not same dimension
thanks a lot in advance
https://imgur.com/4vwWgha
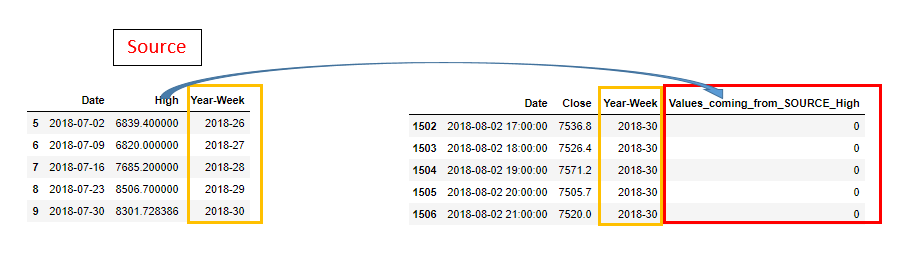
Thanks @lone mist
lone mist
Sorry, I lack the knowledge to help you with this. I don't even know what that is.
novel path
Finally I’ve solved it with database like python. Both merge and join works. Thanks anyway @lone mist
placid snow
What's a good way to partially load a huge json file
 simple crag
do you need the whole thing in memory?
placid snow
I'm unsure if i actually do.
case 1, I want to format it with indentation and
case 2, I want to plot the data
placid snow
Side question, how would I go about plotting occurrence of values in a bar graph?
I'm counting lengths of strings with py lengths = df["Contents"].apply(str).apply(str.split).apply(len)
Andtrying to plot it with
lengths.value_counts().plot.bar(x=lengths.values)```Unsure if my result i actually correct based on the messy x axis..
Actually nvm, I lowered the max amount of str length and got a read-able answer. It does seem correct
 strong arrow
Hello does anyone know abotut tesseract here?
 naive hornet
!t ask
 arctic wedgeBOT
ask
Asking good questions will yield a much higher chance of a quick response:
• Don't ask to ask your question, just go ahead and tell us your problem.
• Try to solve the problem on your own first, we're not going to write code for you.
• Show us the code you've tried and any errors or unexpected results it's giving
• Keep your patience while we're helping you.
You can find a much more detailed explanation on our website.
strong arrow
Oh alright so I'm having this problem and it says Error opening data file \Program Files (x86)\Tesseract-OCR\tessdata/chi_tra.traineddata
Please make sure the TESSDATA_PREFIX environment variable is set to the parent directory of your "tessdata" directory.
Failed loading language 'chi_tra'
Tesseract couldn't load any languages!
Could not initialize tesseract.
Please lmk asap
welp
No one is here
damn i have best luck
everyone ignores me
nice
 nocturne flower
You're not being ignored. But you aren't going to get 100 people saying "I don't know"
velvet anchor
Yup. Not many people are familiar with ML libraries. My only suggestion is setting the environment variable to what it tells you to.
strong arrow
I'm new to this can you please help witht hat real quick
nocturne flower
"Please make sure the TESSDATA_PREFIX environment variable is set to the parent directory of your "tessdata" directory."
Google it and do what you find.
That's what anyone here would be doing
velvet anchor
void anvil
is there a command to transpose partial columns of a DF into rows
and label the rows
eg I have the list 1:10
I want it to look like:
original, -1, -2, -3
1
2
3
4, 3, 2 , 1
5, 4, 3, 2
6, 5, 4, 3
etc.
10, 9, 8, 7
naive hornet
hey, @strong arrow, it's come to our attention that you're botting HQTrivia. that's very not allowed by them or us, time to stop asking for help.
 livid jetty
is this right place to talk about servers?
muted niche
think data-science applies more to processing and visualising data, machine learning, statistics and stuff. I could be wrong
@livid jetty I am currently working on some server like stuff, although it is pretty basic stuff. If you have a question I can try to answer
 signal siren
Hi, I have a question regarding pandas plot function. First: Here is the code:
columns = [column, 'gender', 'twitterid']
group = [column, 'gender']
x = df[columns].groupby(group)['twitterid'].unique().apply(len)
axis = df.plot.bar()
plt.savefig('fancy_image.png')
The code above results in this plot:
But this plot has wrong ticks on the y-axis and it's bars are also wrong. Here is the csv file of the dataframe above
ENFJ,F,6
ENFJ,M,2
ENFP,F,10
ENFP,M,9
ENTJ,F,2
ENTJ,M,7
ENTP,F,5
ENTP,M,10
ESFJ,F,5
ESFJ,M,2
ESFP,F,3
ESTJ,M,1
ESTP,M,2
INFJ,F,15
INFJ,M,9
INFP,F,25
INFP,M,19
INTJ,F,8
INTJ,M,8
INTP,F,7
INTP,M,16
ISFJ,F,3
ISFP,F,4
ISFP,M,5
ISTJ,F,1
ISTJ,M,4
ISTP,M,4
Has anyone a clue why this happens?
But if I run it interactively in the IPython Shell it works properly
 fluid venture
hey @signal siren
not sure how to help, there are some problems with the snippet to begin with:
1 - theres a unassigned variable column, probably should be 'mbit'?
2 - you assign a x variable and dont use it
3 - probably there is a misunderstanding in x = [...].unique().apply(len) , absolutely anything that you apply unique and then len will result in a column of a bunch of 1
about the image: the csv doesnt seem to relate in any way to the image you provided
about the csv: taking by the labels in the image, you probably want to visualize 'number of tweets by gender and mbti', that is, you want to see which mbti tweets more, discriminated by gender, is that so? That is kind of impossible using this csv, because if 'twitterid' correspond to a 'unique individual', there is some error in the date, there are ids with multiple MBTIs and genders:
(
    pd.read_csv('./mbti_gender_16_tweets.csv', names=[
        'mbti', 'gender', 'twitterid'
    ])
    .set_index('twitterid')
    .sort_index()
)
That being said, maybe you want something like this:
(
    df
    .groupby(['mbti', 'gender'])
    .twitterid
    .sum()
    .unstack()
    .plot.bar(stacked=True)
)
@fluid venture thank you for your help!
The codesnippet above was split into two functions and I forgott to reassign the x. But the .unstack() method is really nice! Thank you a lot!
fluid venture
@signal siren cool, be careful thou, this snippet doesnt make much sense, Im summing twitter ids, used this only as an example
turbid bay
can someone explain to me the meaning of partial derirative in the gradient descent algorithm? like what is a partial derirative and what does it do??
polar acorn
Do you know what derivative is?
As in differentiate y = f(x) with respect to x. Often denoted dy/dx
polar acorn
Yes exactly. Now what if you function has several variables? Lets say y = x^2 * z^2
What happens when you differentiate this?
Partial derivatives is a solution to this where you say that first you differentiate y as if everything but x was a constant (like if it's a just a number like 2 or 5). You call this ∂ y/∂ x, since we pretend z is constant we change d to ∂ to signify that y really depends on more than just x. Then we can calculate ∂ y/∂ z and for this we assume that x is a constant. In gradient descent we use ∂ y/∂ x to see how we need to adjust x to minimise y, and ∂ y/∂ z to see how we need to adjust z to minimise y.
Makes sense?
 misty sonnet
@polar acorn if it is just a single expression you can apply that logic across the whole thing
If it is factors there is a different method j think?
Essence of calculus by 3blue1brown is amazing
Check it out!
lean ledge
@turbid bay You should probably take a course on multivariate calculus
turbid bay
i could yes. but im already taking a course on machine learning rn and thats taking a lot of effort as it is 😂. but. @polar acorn explanation makes a bit of sense actually. i just need to be able to visualise how it works with gradient descent. but that’ll have to wait until tomorrow
lean ledge
Is that a formal course? You didnt have Calc 3 as a prerequisite?
polar acorn
@turbid bay I would listen to @lean ledge here, understanding machine learning takes some effort, but understanding it without a good grasp on multivariate calculus and linear algebra takes a LOT more effort. At least you should check out the youtube channel @misty sonnet recommended, it's quite good. It seems like more effort but I think it'll save you some effort to really get the basics down.
small ore
@turbid bay If it is Andrew Ng's course you do not need to understand calculus in detail. You just need to know what it means and you use the final result of the derivation rather than having to know the mathematical details of the steps involved. For gradient descent you have to just know that similar to dy/dx giving the slope of a curve defined by y = f(x), a partial derivative gives the gradient ('slope') of a multivariable function. Although a quick learning of partial derivatives can only help understand better
turbid bay
no @lean ledge its an online course
and @small ore it is Andrew Ng’s course however even tho its not nevessary to understand it in detail it is always nice to understand it
small ore
Read up some basic partial derivatives esp one with some sort of example or demp which visually shows you what a gradient can be thought of as
lean ledge
I do not at all recommend considering trying to learn data science without learning maths if you're actually considering going into it
Maths can get quite complex
polar acorn
It depends on what kind of problem solver you want to be I guess. Do you want to solve your problems mostly by trial and error, copy pasting, looking for tutorials or similar problems with solutions. Or do you want to be able to understand why a solution works for a specific problem? This is of course not a binary thing but more of a sliding scale. Anyhow I feel doing machine learning without understanding math leads you more to first strategy.
turbid bay
@lean ledge i am learning maths XD just haven't done this yet. I am still studying at school
 earnest prawn
School only teaches a fragment of the entirety of maths though, so it's possible that you maybe never get to these topics
turbid bay
im pretty sure that the maths course at school covers partial deriratives but i will eventually look at learning more maths than school teaches
but 50% of my lessons are maths
 trail current
hey guys, have a matplotlib question
when i try to use matplotlib.animate.funcanimation, i have the axis set to update with the increase of time
so the axis 'follows' the data (it's live data)
but now i can't use the navigation toolbar because whenever i try to zoom or whatever the axes get redrawn and it gets set back to default
 wild haven
anyone around to help out with a json --> pandas question?
simple crag
!t ask
arctic wedgeBOT
ask
Asking good questions will yield a much higher chance of a quick response:
• Don't ask to ask your question, just go ahead and tell us your problem.
• Try to solve the problem on your own first, we're not going to write code for you.
• Show us the code you've tried and any errors or unexpected results it's giving
• Keep your patience while we're helping you.
You can find a much more detailed explanation on our website.
wild haven
very well
i have some json data with multiple nested levels - some of the objects lack every category. example:
      "array": [
        "firstArrayValue":0,
        "secondArrayValue":1],
    "firstCategory":secondValue,
    "array":[
        "firstArrayValue":0]
]```so here, the second value's array doesn't contain "secondArrayValue"
so when i load this json into pandas and try to look up MyDataframe.at[1,'array']['secondArrayValue'] it gives a key error
i can't just tell the dataframe to deal with NaN values in a particular way - the key is actually missing
any thoughts on a workaround?
 quiet gyro

GitHub
squanch - A distributed simulation framework for quantum networks and channels
earnest prawn
thats pretty cool
 wild hinge
hi everyone, is there a way to sort a pandas dataframe on odd even values?
This is part of my df, I want to sort even to odd (from A to F), can anyone point me in the right direction?
polar acorn
Still not quite sure what you want to achieve? Do you want to sort the rows or columns? Do you have an example of what it should look like?
wild hinge
I only modified the first 3 columns, I want to observe the odd and even distribution in my dataframe. After I distribute the numbers like in the example above I want to use a color map to have a visual representation of this distribution.
 random bolt
Show us what a sample unsorted dataset should look like, then what the algorithm should turn it into.
wild hinge
Sample of unsorted dataset
Sample of desired outcome(Odd numbers to Even numbers sorted A to F for each event(1,2,3)
random bolt
So odd before even in each column?
wild hinge
yes sir
random bolt
So, while I'm not too experienced with pandas, from what I can tell, you can probably use the advice from this stackexchange to make auxiliary columns to make arbitrary sorts.

Stack Overflow
Given a dataframe 'a' with 3 columns, A , B , C and 3 rows of numerical values. How does one sort all the rows with a comp operator using only the product of A[i]*B[i]. It seems that the pandas s...
Are you familiar with the modulus function (% in python)?
wild hinge
I am, but with the method from the article above I can only create another column to display the desired result, are you proposing to create the new column with the desired outcome then delete the input column?
polar acorn
I made a ugly solution that might work
a = pd.DataFrame({'b':[12,2,2,1,2], 'c':[4,12,5,3,1]})
print(a)
a = a.apply(lambda x: sorted(x[x%2==0]) + sorted(x[x%2!=0]), axis=0)
print(a)
See if that solves your problem
wild hinge
Like a charm, thank you so much
polar acorn
np
wild hinge
why do you say it is ugly?
polar acorn
Because I suspect there might be a better solution, though I'm not sharp enough with pandas to find it 😃
wild hinge
the same lambda function can be used to rearrange max to min?
never mind, stupid question
random bolt
The thing I linked literally makes an index column, so I think your solution is about as nice as possible.
wild hinge
This is the outcome I was looking for, to have a better overview of the odd even distribution in my DF
Cheers for the help again 😄
polar acorn
No problem!
small ore
@wild hinge if I may ask, what are you using to visualize the dataframe?
wild hinge
pandas
this is the style I apply on my df to get the example above
new_df.transpose().style.applymap(odd_even)
.set_properties(**{'max-width': '300px', 'font-size': '1pt'})
.set_caption("Hover to magnify")
.set_precision(2)
.set_table_styles(magnify())
def odd_even(val):
"""
Takes a scalar and returns a string with
the css property 'color: red' for negative
strings, black otherwise.
"""
color = 'background-color: green' if val % 2==0 else 'background-color: cyan'
return color
this is the helper function I use to color my map
small ore
No. I meant what you are using to visualize it. Both the spreadsheet and the "map"
wild hinge
jupyter notebook
small ore
Ahh. Nice
wild hinge
it helps me visualize the observations I take, rather than using comments
small ore
Yeah. Those are nice things to look at rather than just df.head
wild hinge
I'm back with another question for plotting purposes now.
I have the above df and I want to create a histogram
fig, ax = plt.subplots()

histogram = ax.hist(new_fr['G'], density=1)
y=new_fr['H']

ax.plot(histogram, y, '--')
ax.set_xlabel('Index')
ax.set_ylabel('%/event')
ax.set_title('Numbers')
and I get this value error :
ValueError: x and y must have same first dimension, but have shapes (3,) and (49,)
!t codeblock
arctic wedgeBOT
codeblock
Discord has support for Markdown, which allows you to post code with full syntax highlighting. Please use these whenever you paste code, as this helps improve the legibility and makes it easier for us to help you.
To do this, use the following method:
```python
print("Hello world!")
```
This will result in the following:
print("Hello world!")
 steel breach
Hi, i have list of nodes and adjacency matrix as 2 dim numpy array. What is the best way if user wants to get if there is connection between Node1 and Node2. I have to get Node1/2 indexes from the list and then access the matrix, is there something faster? because i have to use indexing from 0-n for matrix
simple crag
If you've built the adjacency matrix from the list then why would you need to go back and get the indices?
steel breach
well, if i have list of object of class Node
how can i use it for indexing 2 dim numpy array
maybe i am overthinking the problem
simple crag
probably
steel breach
goal is to store lattice (partial ordered set)
its good to use graph for is especially adjacency matrix
problem is how should i index this matrix
because there is nothing like node "0" or node "1" there are some real objects
which holds extra informations
so i need some sort of "translation" between integers and real Node objects
thats the reason why i think that i need to find index of the Node object and then access the matrix
simple crag
The rows and columns correspond to the nodes in the list
steel breach
correct
use case is easy, imagine that you have var with Node object and you want to know his upper neighbors
first you have to get the index of the node, then read the row/column of the matrix and find nodes based on the index and return these nodes
and thats seems to be bad design for me
finding node for index is O(1), bud other direction can be problem
simple crag
I'm not sure how else you would like to do it, there are packages that abstract it away for you but they're going to do the same thing
steel breach
ok, then i will try it this way thanks 😃 just want to be sure that my concept is fine
 analog musk
Hi , Anyone know how to do mean normalization of a 1000x20 array with random values from 0 to 5000 ?
With numpy
polar acorn
Normalising each column? Or across all fields?
steel breach
Hi if i have ndarray, is it possible to put values into based on indice list like [(0,0), (1,1)]?
analog musk
@polar acorn normalising each column
I did this. I subtract mean of x from each average column and divide it by each column standard deviation
My problem is now the data separation.
The exercise ask to create a new 1d array with permutation of the row indices of x normalised
turbid bay
can anybody tell me whether this bit of code performs the batch gradient descent algorithm......
    for i in range(10000):
        sum_of_differences_0 = 0
        sum_of_differences_1 = 0
        for k in range(len(inputs)):
            sum_of_differences_0 += (theta_0 + (theta_1*inputs[k]))-answers[k]
            sum_of_differences_1 += ((theta_0 + (theta_1*inputs[k]))-answers[k])*inputs[k]
        theta_0 = theta_0 - learning_rate*(1/len(inputs))*sum_of_differences_0
theta_1 = theta_1 - learning_rate*(1/len(inputs))*sum_of_differences_1```Not familiar with the alg but it looks correct to what the picture above shows
turbid bay
um ok then. thanks. im just confused because when implemented in my programme it doesnt work. But thanks for the help 😃
void anvil
what python ml algorithms are natively capable of doing multiple outputs (e.g. x0..xn predicts y0...yn)
feral lodge
That's batch gradient descent yes! Specifically gradient descent for linear regression, meaning we assume the target values y depend on the predictors x in a linear fashion and thus model each data point (x, y) with the linear function h(x) = θ₀ + θ₁x. In this particular variant of gradient descent, the parameters θ₀ and θ₁ are updated to minimize the least squares cost function J(θ) = ½(h(x) - y)². The difference between batch gradient descent and regular is that we're considering m inputs rather than just one each time we update the parameters. Regular gradient descent would look pretty much the same except it wouldn't have the summations (Σ).
You can read more on this in this pdf: http://cs229.stanford.edu/notes/cs229-notes1.pdf. Your expression is derived on page 4. If you have a look there you can also see that the two gradients on your picture -- ∂J(θ₀, θ₁)/∂θ₀ and ∂J(θ₀, θ₁)/∂θ₁ -- are actually conceptually the same. The only difference is that the first is multiplied with a 1 and the second is multiplied by x. This is because ∂h/∂θ₀ = 1 and ∂h/∂θ₁ = x.
Not sure why your code isn't working properly, I think we'd have to see more to tell @turbid bay
 steep ibex
I want to simulate a dwarf fortress like world. icosahedron: so 20 triangles, each triangle side should have 13 triangles in them, each triangle would be 512 triangles itself. This would simulate a 40.075 world about 1x1 km. It also needs a z-dimenson: down (towards lava), and a bit up: say 512 total on the z level. But: that would give me an insane amount of objects to iterate through each cycle: like 45365 million. (or a number in that ballpark)... any ideas on how I could accomplish that? My best guess at this moment is to have two kinds of objects: they all start as 'inactive', then have the world builder make some 'active' (put them in a queue or sumthing). I would then only need to chekc the active ones. This could cut out 90+ percent of all the objects to check each cycle. Anyone have a better idea?
 stiff sapphire
In things like DF it will only iterate over actual things that do stuff like machines or people
turbid bay
@feral lodge this is my full code
hours_studied = [100, 25, 150, 75, 36, 43, 100, 52, 97, 250, 10, 5, 0, 25, 15, 19]
score_percentage = [80, 66, 84, 80, 52, 45, 90, 72, 78, 96, 34, 36, 25, 52, 40, 44]

###uses mean normalisation and feature scaling to scale the data

def find_range(array):
    array.sort()

    return array[len(array)-1] - array[0]

def find_mean(array):
    score = 0
    for i in array:
        score+=i

    return score/(len(array))

def feature_scaling(array):
    scaled_array = []
    array_range = find_range(array)
    array_mean = find_mean(array)

    for i in array:
        value = (i-array_mean)/array_range
        scaled_array.append(value)

    return scaled_array

###

def finding_theta_values(inputs, answers):
    theta_0 = 0
    theta_1 = 0
    learning_rate = 0.0001

    for i in range(10000):
        sum_of_differences_0 = 0
        sum_of_differences_1 = 0
        for k in range(len(inputs)):
            sum_of_differences_0 += (theta_0 + (theta_1*inputs[k]))-answers[k]
            sum_of_differences_1 += ((theta_0 + (theta_1*inputs[k]))-answers[k])*inputs[k]
        theta_0 = theta_0 - learning_rate*(1/len(inputs))*sum_of_differences_0
        theta_1 = theta_1 - learning_rate*(1/len(inputs))*sum_of_differences_1

    return theta_0, theta_1

def test(c, m):
    test_hours_studied = 56
    estimated_score = m*test_hours_studied + c
    return estimated_score

def main():
    scaled_inputs = feature_scaling(hours_studied)
    scaled_answers = feature_scaling(score_percentage)

    c,m = finding_theta_values(scaled_inputs, scaled_answers)


    result = test(c, m)
    print(result)

main()
the problem im having is the more iterations i do in the first for loop the higher my final result is. It is even managing to reach 4000% somehow
polar acorn
@turbid bay a couple of things.
- First of all your find range function actually sorts hours_studied and score_percentage outside of the function as well. Try it out by running
a = [1,43,2,0,3]; find_range(a); print(a). - Second when you train on scaled data you must test on scaled data as well. Your test function should scale 56 in the same way your input was scaled, and then invert the scaling for the estimated score
polar acorn
You can call min(array) and max(array) directly without sorting anything first
Also are you familiar with numpy and sklearn?
turbid bay
no i am not. ive only just started learning machine learning so im only trying to put into practice the things ive learned.
polar acorn
I see, well numpy is useful for all kinds of operations with arrays and sklearn is probably the first python library i'd look into if wanted to learn machine leaning with python. It's nice to write stuff yourself the first time sso you know how it works, but when you have done that in the future you can use, numpy for finding mean and ranges etc. and sklearn for scaling and gradient descent etc.
steel breach
Hi if i have ndarray, is it possible to put values into based on indice list like [(0,0), (1,1)]?
feral lodge
You're training with normalized data, but testing with non-normalized data. You can either skip normalizing the training data, or you can apply the exact same normalization transformation to the testing data as the training data 👌 It makes sense if you think about it -- your line has been fitted with points in a very small range centered on 0, like 0.02 and -0.4, but suddenly you're testing it with 56, so the predicted percentage skyrockets. By the way, a line isn't a great model for percentages, since percentages are bound between [0, 100] (or equivalently [0, 1]) but a line goes on forever. A proper model, like a sigmoid, wouldn't be able to predict 4000% @turbid bay
brazen spade
Can I get some opinions on how to handle a data frame I'm working with? I'm analyzing soccer data to determine patterns in winning teams across multiple leagues. I have a valuable df of matches or games, with a lot of good info. Unfortunately some critical features in determining the control/pace/etc of the game are heavily null. The df is ~25k rows, with ~11k rows of these 8 critical features being empty. Should I drop these rows and lose half the data, fill with means, something else? These are technically games I could look up the data manually, but for 11k games, I don't have time for this so that's not an option
lapis sequoia
good tutorial for blockchain development?
turbid bay
hey guys, is this the correct way to test my gradient descent algorithm which has been feature scaled and mean normalised?
def test(c, m):
    test_hours_studied = 40
    test_range = find_range(hours_studied)
    test_mean = find_mean(hours_studied)
    score_range = find_range(score_percentage)
    score_mean = find_mean(score_percentage)

    scaled_hours_studied = (test_hours_studied-test_mean)/test_range
    estimated_score = (m*test_hours_studied)+ c
    estimated_score = (estimated_score*score_range)+score_mean
return estimated_score```We would need to see your other functions
turbid bay
ok
hours_studied = [100, 25, 150, 75, 36, 43, 100, 52, 97, 250, 10, 5, 0, 25, 15, 19]
score_percentage = [80, 66, 84, 80, 52, 45, 90, 72, 78, 96, 34, 36, 25, 52, 40, 44]
###uses mean normalisation and feature scaling to scale the data
def find_range(array):
    top = max(array)
    bottom = min(array)
    return top-bottom
def find_mean(array):
    score = 0
    for i in array:
        score+=i
    return score/(len(array))
def feature_scaling(array):
    scaled_array = []
    array_range = find_range(array)
    array_mean = find_mean(array)
    for i in array:
        value = (i-array_mean)/array_range
        scaled_array.append(value)
    return scaled_array
def finding_theta_values(inputs, answers):
    theta_0 = 0
    theta_1 = 0
    learning_rate = 0.0001
    for i in range(10000):
        sum_of_differences_0 = 0
        sum_of_differences_1 = 0
        for k in range(len(inputs)):
            sum_of_differences_0 += (theta_0 + (theta_1*inputs[k]))-answers[k]
            sum_of_differences_1 += ((theta_0 + (theta_1*inputs[k]))-answers[k])*inputs[k]
        theta_0 = theta_0 - learning_rate*(1/len(inputs))*sum_of_differences_0
        theta_1 = theta_1 - learning_rate*(1/len(inputs))*sum_of_differences_1
    return theta_0, theta_1
def test(c, m):
    test_hours_studied = 40
    test_range = find_range(hours_studied)
    test_mean = find_mean(hours_studied)
    score_range = find_range(score_percentage)
    score_mean = find_mean(score_percentage)
    scaled_hours_studied = (test_hours_studied-test_mean)/test_range
    estimated_score = (m*test_hours_studied)+ c
    estimated_score = (estimated_score*score_range)+score_mean
    return estimated_score
def main():
    scaled_inputs = feature_scaling(hours_studied)
    scaled_answers = feature_scaling(score_percentage)
    c,m = finding_theta_values(scaled_inputs, scaled_answers)
    #c,m = finding_theta_values(hours_studied, score_percentage)
    result = test(c, m)
    print(result)
main()
https://paste.pydis.com might be a good place for a large chunk like that
misty sonnet
Also more tabs please
hours_studied = [
    100, 25, 150, 75, 36, 43, 100, 52, 97, 250, 10, 5, 0, 25, 15, 19]

score_percentage = [
    80, 66, 84, 80, 52, 45, 90, 72, 78, 96, 34, 36, 25, 52, 40, 44]

# uses mean normalisation and feature scaling to scale the data


def find_range(array):
    top = max(array)
    bottom = min(array)
    return top-bottom


def find_mean(array):
    score = 0
    for i in array:
        score += i
    return score/(len(array))


def feature_scaling(array):
    scaled_array = []
    array_range = find_range(array)
    array_mean = find_mean(array)
    for i in array:
        value = (i-array_mean)/array_range
        scaled_array.append(value)
    return scaled_array


def finding_theta_values(inputs, answers):
    theta_0 = 0
    theta_1 = 0
    learning_rate = 0.0001
    for _ in range(10000):
        sum_of_differences_0 = 0
        sum_of_differences_1 = 0
        for k in range(len(inputs)):
            sum_of_differences_0 += (theta_0 + (theta_1*inputs[k]))-answers[k]
            sum_of_differences_1 += (
                (theta_0 + (theta_1*inputs[k]))-answers[k])*inputs[k]
        theta_0 = theta_0 - learning_rate*(1/len(inputs))*sum_of_differences_0
        theta_1 = theta_1 - learning_rate*(1/len(inputs))*sum_of_differences_1
    return theta_0, theta_1


def test(c, m):
    test_hours_studied = 40
    score_range = find_range(score_percentage)
    score_mean = find_mean(score_percentage)
    estimated_score = (m * test_hours_studied) + c
    estimated_score = (estimated_score * score_range)+score_mean
    return estimated_score


def main():
    scaled_inputs = feature_scaling(hours_studied)
    scaled_answers = feature_scaling(score_percentage)
    c, m = finding_theta_values(scaled_inputs, scaled_answers)
    #  c, m = finding_theta_values(hours_studied, score_percentage)
    result = test(c, m)
    print(result)


main()
Fixed your code
xd
turbid bay
???
wild hinge
@misty sonnet you have a slow monday, don't you?
placid snow
It was posted yesterday 
wild hinge
I'm having a slow Monday
 bitter sable
good day people
bitter sable
df['datetime'] = pd.to_datetime(df['datetime'], infer_datetime_format=True)
opgroup = df['datetime'].sub(df['datetime'].shift(1), axis = 0) / np.timedelta64(1, 'h')
yields TypeError: unsupported operand type(s) for -: 'Timestamp' and 'float' since one of the last updates. I think it now has problems with type coercion from the NaN at the first index. does anyone habve the same problems? seems like such a basic issue
print(pd.to_datetime(df['datetime'].shift(1), infer_datetime_format=True))
because this doesnt work either
and it definitely worked at least 0.18 to 0.21 of pandas
polar acorn
So I have two pandas dataframes with timestamp columns with different granularity. Is there a floor one of them to the other one? Such that all timestamps in df1 that are between timestamp t1 and t2 in df2 should take on the value of t1 in df2
void anvil
naconda3\lib\site-packages\sklearn\cross_validation.py:41: DeprecationWarning: This module was deprecated in version 0.18 in favor of the model_selection module into which all the refactored classes and functions are moved. Also note that the interface of the new CV iterators are different from that of this module. This module will be removed in 0.20.
"This module will be removed in 0.20.", DeprecationWarning)
What's the new call for NNs, MLP, etc.?
 elfin yacht
 cursive glade
does the covariance in the upper left corner look like human error while trying to train the algorithm or just a problem that cant be solved by the algorithm ?
 noble plinth
Hello, I am pretty new to ML stuff and was just wondering where I could start reading and learning how to go about "doing" it.
I want to do this as a school project and try to make the AI play snake
lean ledge
@noble plinth maths is a good place to start. Finish till about calc 3 and linalg 2
noble plinth
idk what it's called, or if you have this in the country you are. But I am in my third year of Engineering Science
I've had math for 2 years everyday
lean ledge
Done diffential equations then in maths I'm guessing?
lean ledge
Can solve d²x/dt² = -kx?
lean ledge
Which country are you in?
noble plinth
sweden
lean ledge
Hmhm
noble plinth
i can give you what x is
lean ledge
Know what grad, div and curl are?
noble plinth
grad?
lean ledge
In terms of vector calculus
noble plinth
i think so ye
lean ledge
Should be able to start ML properly then. I recommend Columbia's machine learning course on edX (it's free to audit)
noble plinth
it's just that i have to translate all your terms to swedish to understand xd
lean ledge
If you find it's too rigorous and mathsy for you, Andrew Ng's ML course on coursera is also okay
Yeah sorry about that, wish I could speak Swedish
 olive trench
Guys I want to look into continually training a neural network. Are there any sources? I can't find to google anything
Basically I want to have a pre-trained model and then add more examples continually. Do I just use partial fit? Do I fit it as many times as the network has been trained for?
Or do I wait for more examples and do a batch?
small ore
@noble plinth AndrewNg's course has some kind of translation or transliteration. I am not sure to what extent it is good
void anvil
I'm trying to run just a simple multioutput ANN on some data.
I've split my data into a train / test split for my predictors X and my predicted values Y (x_train, x_test, y_train, y_test; train is what the model should learn on and test is what the model should try to maximize prediction accuracy on). Trying to figure out the call for any multioutput train in scikit to just double check I have everything set up correctly.
I've only ever used the Weka GUI so I'm new to the python thing, trying to find the basic calls
There's stuff like this:

Medium
In my last blog post, thanks to an excellent blog post by Andrew Trask, I learned how to build a neural network for the first time. It was…
where it clearly shows you how to build your own ANN, but I would assume that there are a ton of preexisting packages
void anvil
I guess I'm trying to ask is there a way to manually set train/test sets for k-fold validation
instead of relying on au to splits
 humble loom
I have a new computer running Windows 10 and I just installed a 1070ti. I cannot get python to recognize the GPU. Is there a doc that provides info on installing everything so that Python will recognize the GPU?
I think I need the CUDA Toolkit but the install keeps failing
turbid bay
yh im pretty sure u 100% need the CUDA Toolkit
i had the same problem with my 1070ti when trying to instsall it
eventually when installing instead of selecting install all. I had to go through each section of the toolkit and download each section individually
velvet anchor
CUDA can be quite fickle
it took me a couple days to install it for my Tesla card but I forget what I did to fix that issue
 high ocean
Yo. Does anyone here use xarray datastructures?
I have a few questions that docs don't resolve.
naive hornet
(once again, the explicit question is significantly more likely to attract a response)
high ocean
Thanks for guiding me through this @naive hornet
Ok.
I have an xarray.Dataset with dims x,y,t
lets call that foo
when I run foo.isel(t = 0) I get a subset xarray.Dataset called bar
bar,unlike foo only has the dims x, and y
the selection, for some reason dropped the t coordinates/dimensions despite this particular slice, still having an associated t value.
Any idea on how I can select single values without dropping dimensions?
thorn river
I've tried for a long time and can't seem to figure it out. Anyway, if anyone feels like answering this it'd be great hahah.
Question description:
Complete function features , which takes a signal (as a three-dimensional array), a list of feature functions, and returns an array with all the features extracted by the functions concatenated together. Each feature function in the list can be applied to a 3-dimensional signal of shape (example, channel, time), and will reduce it to a two-dimensional array along the axis specified via the axis keyword argument.
You may find the functions np.concatenate or np.hstack useful.
Example list of feature functions:
summaries = [np.mean, np.min, np.max, np.std]
Given input of the following dimensions: (677, 204, 200)
Write the function in such a way that the output will have the following dimensions : (677, 816)
So basically the question now is: whats the function for this.
feral lodge
@thorn river If I were you, I'd break this problem down and solve it incrementally!
First, when working with multi-dimensional data, it's useful to get a good mental picture of what the data actually is, or could be, to make it less abstract and to realize what we're actually doing. Your (sample, channel, time) data has dimensions (677, 204, 200). You can imagine that this data was recorded in a router in an office, where everyone constantly uses the internet. 204 people can connect to the router. Your data can then be imagined to be the recorded data usage of those 204 people, recorded for 200 minutes each day over a 677-day period. In that data, element [i, j, k] is the data usage (number of bytes) of person j, during minute k of day i.
The inputs to your function are the data recordings and the summaries list -- the functions in this list are different statistics, i.e. functions for extracting one-number summaries of data sequences. The output of your function is a matrix containing the result of applying each summary to each channel, for each day. So if summaries = [np.mean], your output will have dimension (677, 204). In that output, element [i, j] will be the mean data usage of channel j over the 200-minute recording period, on day i.
Now, instead of trying to solve the entire problem all at once, I would do the following:
1) Figure out how to extract the recordings for one day (this will be a 204x200 matrix) and apply one of the summaries to each channel for that day. This will produce a 204-length vector, since we have summarized the 200-minute data usage recording to one number for each of the 204 channels.
2) Figure out how to apply all of the summaries for that one day. This will probably involve placing some of the code from 1) inside a for loop, looping over summaries. Each iteration of the loop will produce a 204-length vector, just like in 1). According to the problem description, these vectors should be stacked, or concatenated, using np.hstack or np.concatenate. In the end, this will produce a (204*len(summaries))-length vector. If summaries contains 4 functions, like you showed, then the length will be 816.
3) Figure out how to apply the method of 2) to each of the 677 days in the data. This will probably involve putting the code from 2) inside a for loop, looping over range(677). (There may be more efficient methods than looping, but looping is probably the simplest to understand.) Now, each iteration of this loop will produce a (204*len(summaries))-length vector, just like in 2). According to the problem description, each of these vectors should constitute the rows in the final output matrix -- so one row for each of the 677 days. The dimension of the final output is thus (677, 204*len(summaries)). If summaries contains 4 functions, then the dimension will be (677, 816).
So if you do it like this, your function might look sort of like this:
def apply_summaries_to_data(data, summaries):
    # This function contains the code from 3)
    output = np.empty(data.shape[0], len(summaries)*data.shape[1])

    for sample in range(data.shape[0]):
        # This loop contains the code from 2)
        output_row = np.empty(0)

        for summary in summaries:
            # This loop contains the code from 1)

            # apply summary to data[sample, :, :].
            # concatenate result to output_row.

        output[sample, :] = output_row
    return output
@feral lodge Thank you so much for the directions/explanation, I can work with this 😃
I'll let you know later how it went
feral lodge
Good luck friendo! 👌
feral lodge
@high ocean I've never worked with xarray and I can't really stay and help, but when I try with some random data, I get this:
>>>
>>> # create random dataset
>>> ds = xr.DataArray(np.random.rand(4, 3), [('x', range(4)), ('t', range(3))]).to_dataset(name="my-data")
>>>
>>>
>>> # Get slice
>>> ds.isel(t=0)
<xarray.Dataset>
Dimensions:  (x: 4)
Coordinates:
  * x        (x) int64 0 1 2 3
    t        int64 0
Data variables:
    my-data  (x) float64 0.3875 0.331 0.07215 0.7621
>>>
You mean it's not enough to have the info
t int64 0
and you would like to be able to keep indexing this slice with other values of t? There's probably no way of doing that in that case. Your data is a 3D-matrix, which you can imagine as a stack of papers. The stack of papers has height, width, and thickness, ie (x, y, t). When you extract a slice, say at t = 5, that's like removing the sixth paper from the stack and regarding that separately from the rest. A single sheet of paper has the same height and width as the stack, but has no thickness, so it has no t-dimension. The only use for indexing other t's would be to get other papers from the stack, which you cannot from this single sheet; you need to go back to the original stack.
high ocean
strange. when I do the same thing it doesn't have t in the coordinates.
What version are you using?
Also I realized that I was applying this to a dataset rather than dataarray
I'll play around with it to see if splitting id different on the data-array level.
feral lodge
My xarray version is 0.10.8! I get the same result for both datasets and dataarrays
high ocean
I'll switch versions and see if things are different!
thorn river
@feral lodge I still can't figure out how to get it to work.
    # This function contains the code from 3)
    output = np.empty((data.shape[0], len(summaries)*data.shape[1]))

    for sample in range(data.shape[0]):
        # This loop contains the code from 2)
        output_row = np.zeros(0)

        for summary in summaries:
            # This loop contains the code from 1)
            stat = summary(data[sample, :, :], axis = 1)

            np.concatenate((output_row, stat))
            # apply summary to data[sample, :, :].
            # concatenate result to output_row.

        output[sample, :] = output_row
    return output```

Gives the error:
---------------------------------------------------------------------------
ValueError                                Traceback (most recent call last)
<ipython-input-65-88d10ee6ba05> in <module>()
----> 1 apply_summaries_to_data(data, summaries)

<ipython-input-64-e1995b578e68> in apply_summaries_to_data(data, summaries)
     15             # concatenate result to output_row.
     16
---> 17         output[sample, :] = output_row
     18     return output

ValueError: could not broadcast input array from shape (0) into shape (816)np.concatenate((output_row, stat)) returns the concatenation! To overwrite the vector in output_row, you'll have to do output_row = np.concatenate((output_row, stat))
feral lodge
Easy mistake to make!
Numpy and pandas functions usually work like that. It makes it very easy to chain operations
thorn river
Nice! Alright, time to test it with predictions
My first attempt at this exercise kept giving me the same accuracies, which did not agree with how the accuracies should have been
Hmmm
Anyway, @feral lodge thanks a lot for the help!!!! Very helpful to think about the arrays with for loops like that.
Made me better understand what I was actually doing as opposed to my first function to solve this exercise
    stat = []

    for i,j in enumerate(array):
        stat.append(sumstat(array[i], axis = 1))
    stat_np = np.array(stat)
    return stat_np


def features(signal, functions):
    x = 0
    for i in range(len(functions)):
        if i == 0:
            b = features_stat(signal, functions[i])
            x = b
        else:
            x = np.concatenate((x, features_stat(signal, functions[i])), axis = 1)
return x```No worries! Did your perceptron thing work out?
It seems like weird data to use for linear regression if you ask me o:
thorn river
Yeah we were told to use a perceptron for it haha
Still got stuck at 0.2 accuracy
I found out that it only predicted 5
 radiant notch
Hello
I've used a neural network template from the internet
And modified it slightly to use my own data


But it always outputs numbers that are very close to 1
I've tried to train it with this data:
dataset = [[1,2],[2,3],[3,4]]
targetDataset = [[3,4],[4,5],[5,6]]
So by inputting [1,2], you'd expect the neural network to output something close to [3,4] after 1000 training runs
But no, it outputs "[[0.99944112] [0.9995817 ]]"
At least it got one thing right, the second output is bigger than the first.
placid snow
 |  index(...)
 |      L.index(value, [start, [stop]]) -> integer -- return first index of value.
| Raises ValueError if the value is not present.```It doesnt return anything, it raises an exception
 wary willow
Is there a way to do an if statement that checks if an entry exists in a list?
radiant notch
you're in the wrong channel...
radiant notch
Can anyone help me with my issue?
small ore
@radiant notch You don't generally get replies in this channel as fast as in the help channels but you are in the right channel. Wait it out.
 open plaza
can anybody here help me try plotting this csv file with seaborn? 😦
im on day 3 of no success
small ore
!t ask
arctic wedgeBOT
ask
Asking good questions will yield a much higher chance of a quick response:
• Don't ask to ask your question, just go ahead and tell us your problem.
• Try to solve the problem on your own first, we're not going to write code for you.
• Show us the code you've tried and any errors or unexpected results it's giving
• Keep your patience while we're helping you.
You can find a much more detailed explanation on our website.
 timid yarrow
Anyone here able to help me set one column based on the value of another column? Here's what I've got so far:
df['Group'] = 'Fixed Assets' if df['Item'] in FixedAssets else df['Item']
feral lodge
The output of the last layer of neurons are passed through a sigmoid function σ(z) = 1/(1 + exp(-z)) https://en.wikipedia.org/wiki/Sigmoid_function.
σ(z) squashes z to a value between 0 and 1. This is useful for 2-class classification, but makes regression (which is what you're trying to do) impossible, since the output will always be [0, 1]. The reason your output is always ≈ 1 is because you're training it on output values above 1, which means it's constantly being told "go higher, go higher!!", even though it can't
For the same reason, if we change the training targets in your last code from [4, 5, 6, 7, 8, 9, 10] to [-4, -5, -6, -7, -8, -9, -10], the predictions will not be 0.999996 ≈ 1; they'll be 1.90919584e-07 ≈ 0 🙂 The network is being told "go lower, go lower!!", even though it cannot go lower than 0
@radiant notch
radiant notch
Ok
What's a good way to make it so that it'll work on data that goes up
and is positive
Like...
[4, 5, 6, 7, 8, 9, 10]
@feral lodge
radiant notch
Anyone?
feral lodge
@radiant notch For regression you'll probably just want the identity activation function f(z) = z for the output layer -- the identity function has no restrictions on its output, so it can produce any number. Here's a list of activation functions with corresponding domain and range: https://en.wikipedia.org/wiki/Activation_function#Comparison_of_activation_functions; it's good to have a look! However, we can't just switch output activation functions; they're related to the cost function that we optimize to train the network. So If we switch output activation function, we usually have to optimize a different cost function. Before doing anything else though, you should try out a simpler model than a neural network. Neural nets are extremely flexible and can estimate a huge number of different functions, but that comes at the cost of requiring a lot of training data. If your training data consists of just a few points, a neural net is pretty much a useless model -- it will be much too overfit and will not be able to generalize to new, unseen, data.
On top of that, the flexibility of a neural network is often unneeded, since data often follows a linear, quadratic, or otherwise polynomial pattern! Before trying a neural net, you should try fitting a line or curve with linear regression. These models have much less flexibility, but that 's both a strength and a weakness -- they require a lot less data for fitting.
Finally, working with hand-written neural networks like in your files is great for learning the basics, especially if it's done in the context of a course and preferably written by yourself from the bottom up. In practice, however, you'll definitely want to work with a library like Keras, Tensorflow or PyCharm PyTorch. Then you don't have to change a bunch of code if you want to try a different output activation function, and you also won't have to manually implement the gradient descent, which gets very difficult when you have more than a single hidden layer. Linear models, polynomial models and many others (like tree-based models, which may also be a good idea for your data) can also be used from libraries; a lot of people like Scikit-learn
placid snow
does it make sense to have a "custom" distance algorithm to use with A*, where I get the Manhattandistance, and multiply it with the Hammingdistance?
It's solving a 0-8 board game
One of these games
lean ledge
To add on to what Sladon said, deep learning in general at the moment is sort of overrated. It has come leaps and bounds in situations like computer vision but for many tasks it's significantly slower and doesnt perform better than classic machine learning techniques. They're hyped and all but its worth learning more classical ML techniques. Decision trees or clustering or whatnot may not sound as cool as neural networks but they're more interpretable, faster and often just as well performing as NNs in many scenarios.
Personally I'm excited for how cool reinforcement learning has been recently. Lots of cool stuff happening in engineering such as in control theory where reinforcement learning based agents with trained policies are acting as controllers in complex systems that many people dont have the maths knowledge to analytically solve for
 hasty maple
An ML model is part of the feedback loop for a Control system eh? That's cool
lean ledge
It is! Doing wonders in some parts of robotics
Reinforcement learning in a way is a control system on its own
Hell, the term agent is also used by mathematicians in control theory a bit
small ore
@radiant notch Slandon means PyTorch, not PyCharm. Typo I guess
lean ledge
lmao didnt even notice
small ore
Raggy, did not know about 'Classical ML'. Good to know. Where do I learn about it?
lean ledge
Almost any Machine Learning course will start with more classical ML stuff. Linear regression by gradient descent, logistic regression, KNN clustering, etc
small ore
Ah. So that is what you meant by classical ML. I learnt that but do not know what 'decision trees' etc are
lean ledge
Search it up! https://en.wikipedia.org/wiki/Decision_tree
The more techniques you know as a data scientist, the better because you can choose the right tool for the job
Here's a slightly more ML based introduction rather than OR based https://towardsdatascience.com/decision-trees-in-machine-learning-641b9c4e8052
lean ledge
I can mention them fine, shouldnt be a problem
small ore
👍
lapis sequoia
@small ore you can help me ?
small ore
!t ask
arctic wedgeBOT
ask
Asking good questions will yield a much higher chance of a quick response:
• Don't ask to ask your question, just go ahead and tell us your problem.
• Try to solve the problem on your own first, we're not going to write code for you.
• Show us the code you've tried and any errors or unexpected results it's giving
• Keep your patience while we're helping you.
You can find a much more detailed explanation on our website.
small ore
No one helps one-on-one. Ask and wait
lapis sequoia
This is true or false ?
small ore
That doesnt look like a question for this server. There are at least 5 different mathematics servers on discord which could help you
lapis sequoia
which are these servers ? @small ore
small ore
Can't give links here. DM me and I will see if I can get hold of a couple
glad pivot
anybody here at the moment?
simple crag
It's generally faster to get a response if you just ask your question instead of asking to ask your question.
glad pivot
Yeah I know, but I also didn't want to go to another resource and get an answer and waste someone's time here.
This is a plot of a PCA component and the various weights associated with features. I'm a bit confused as to why the MOBI_REGIO score is indicative of low movement patterns, when it is a negative number.
That same question goes for basically all of the other negative feature weights.
glad pivot
https://stats.stackexchange.com/questions/26352/interpreting-positive-and-negative-signs-of-the-elements-of-pca-eigenvectors I was able to find my answer here

Cross Validated
If I center my variables and then run a PCA analysis, do I need to interpret negative eigenvectors different than positive eigenvectors?
Clarification: In my PCA analysis I have in a component both
wild haven
i have a pandas data frame whose index refer to individual particles, and columns refer to information about those particles (vector components of momenta, amongst other things). i'd like to be able to apply a function that takes all the data from a particular index and modifies that data in place (specifically, i want to perform coordinate transformations on the momenta). is there a "fast" way to do this via the dataframe, or do i have to just iterate over the index the slow way?
small ore
Formula for the said transformation would be?
small ore
@wild haven I cannot try out or search with just what you have provided. You could probably elaborate with an example or check one of the function application methods. Maybe this: https://pandas.pydata.org/pandas-docs/stable/basics.html#transform-with-multiple-functions
wild haven
example of what to do with one of the rows:
df.columns returns ['rpx_1', 'rpx_2', 'rpy_1', 'rpy_2', 'rpz_1', 'rpz_2']
for each row, I'd like to sum the momenta and normalize the resulting vector:
new_x = row['rpx_1'] + row['rpx_2']
new_y = row['rpy_1'] + row['rpy_2']
new_z = row['rpz_1'] + row['rpz_2']
length = sqrt(new_x**2 + new_y**2 + new_z**2)
new_x = new_x / length
new_y = new_y / length
new_z = new_z / length
return new_x,new_y,new_z in a new data frame
i need one function that takes multiple values out of a given row, manipulates those values, and returns new values (rather than multiple functions)
ahh, think i got it @small ore ! i can use .apply and pick out values inside the function, then return a series that represents the new vector
thanks for the push in the right direction
small ore
Um. Can you elaborate so that I can learn? I am only trying to learn by looking up on the web and trying out things
.apply seemed to change the column on which it is applied
wild haven
def transform_row(row):
    data = row[['rpx_1','rpx_2','rpy_1','rpy_2','rpz_1','rpz_2']]
    rpx_sum = data['rpx_1'] + data['rpx_2']
    rpy_sum = data['rpy_1'] + data['rpy_2']
    rpz_sum = data['rpz_1'] + data['rpz_2']
    length = np.sqrt(rpx_sum**2 + rpy_sum**2 + rpz_sum**2)
    return pd.Series({'unit_x': rpx_sum/length, 'unit_y': rpy_sum/length, 'unit_z': rpz_sum/length})


df = data.apply(transform_row,axis=1)
this returns a data frame with 3 columns: unit_x, unit_y, unit_z
that declaration of data is probably superfluous
maybe not though, i don't have a good grasp of what's being done when .apply is being called
 wanton saffron
Hi, not sure if this is the right place but I'm looking to display some data graphically in a line graph.
{
    "2018-09-09": 167,
    "2018-09-08": 786,
    "2018-09-07": 50,
    "2018-09-06": 148,
    "2018-09-05": 12,
    "2018-09-04": 18,
    "2018-09-03": 20,
    "2018-09-02": 8
}
This is a small sample, and in some places there aren't values for every day.
 proud raven
@wanton saffron What is your question? Is it how to show a line graph?
wanton saffron
More so the best way to do it with this large of a dataset
proud raven
Can you be a little more specific about "best way". Are you looking for module recommendations? Recommendations for how to display a lot of information? Recommendations for how to fill in missing days? etc.
wanton saffron
How to display a lot of information
This is my first attempt but the data isnt very clear at all
This is literlaly just by lining up the date and number and plotting it
Maybe a way to change the x axis to display dates by month so you can at least read those
proud raven
The quickest solution generalized is to find the min/max date of your data and calculate a set number of intervals in between. Say every month.
😃
If you want something a little easier, or you want a module to do the heavy lifting, try plotly: https://plot.ly/python/time-series/
How to plot date and time in python.
wanton saffron
Thank you, I'll take a look
wild haven
any decent plotting module should let you designate the increments of the axis
plotly, matplotlib, etc
wanton saffron
Is it possible to have the specific data points like in my first graph but with the labels just being monthly like it is here?
 upbeat orbit
@wanton saffron log scale y-axis (for the first graph)
 brittle wing
https://stackoverflow.com/questions/32669415/opencv-ordering-a-contours-by-area-python
I used this to sort my contours
But when i use cv2.drawContours(img,largestcon,-1,255,-1) wont fill the contour
Stack Overflow
The OpenCV library provides a function that returns a set of contours for a binary (thresholded) image. The contourArea() can be applied to find associated areas.
Is the list of contours out outpu...
It will just give me the outlibe of the contour
Pls help
feral lodge
From what i can see here https://docs.opencv.org/3.3.1/d6/d6e/group__imgproc__draw.html#ga746c0625f1781f1ffc9056259103edbc and here https://stackoverflow.com/questions/15340052/python-opencv-cv2-equivalent-for-cv-filled there's a thicknessparameter in drawContours that defaults to drawing only the outline. Try cv2.drawContours(img,largestcon,-1,255,-1, thickness = cv2.cv.CV_FILLED) or possibly cv2.drawContours(img,largestcon,-1,255,-1, thickness = cv2.FILLED) @brittle wing
brittle wing
Thanks @feral lodge ill try that
 simple fjord
Hi All
Would someone help me with PCA and regression ?
here is the question
Cross Validated
I have strain temperature data and I have read that article https://www.idtools.com.au/principal-component-regression-python-2/
I'm trying to build a model and predict the strain out of the temper...
 rugged linden
@glad pivot did you make this?
glad pivot
no
rugged linden
do you know how to make it?
glad pivot
yes
rugged linden
do you know any tutorials on the internet?
velvet anchor
@undone storm Andrew Nguyen’s on coursera is nice
 undone storm
I saw that one in the pinned messages too, I will definitely check that out thanks
lean ledge
/r/LearnMachineLearning has a fantastic wiki that gives an overview of how to get started with ML based on your background and intention: https://www.reddit.com/r/learnmachinelearning/wiki/index
They also have a list of resources that could get you started with ML and some prerequisites:
https://www.reddit.com/r/learnmachinelearning/wiki/resource
lapis sequoia
I'm getting started with pandas (again) and I'm running in an unexpected issue with the .plot() function.
Why am I seeing decreases (dips) in the bottom plot? The first plot shows that 'Profit' is always positive, yet when plotting the cumsum of 'Profit' I don't get a monotonically increasing curve. Any ideas?
 last pike
@lapis sequoia would it be possible to post more relevant code?
My initial guess is something's wrong with your data
So if you could post the code that aggregates the data into a plottable array i could rule that out or say that's the issue
lapis sequoia
@last pike Thanks for taking a look. I'm loading the data from a .csv file -- sorry, I'm not quite sure what you mean with your last sentence. But I think I have an idea. I'm assuming implicitly that my data is sorted according to 'DateSold' (it should be), but if isn't, that could explain what I'm seeing here.
I'm checking this now.
last pike
@lapis sequoia the x values suggest its sorted right, could you post the csv?
lapis sequoia
Yeah, that was it! Sorry, if this was a very silly question. I wasn't perfectly sorted by 'DateSold'.
last pike
Ah, that works then
lapis sequoia
Lesson learned! Thanks again for pointing me to it!
last pike
Np, generally for graphing issues like that data will be the biggest potential point of failure
Make sure your data is exactly how you want it
 vapid swallow
I'm completely new to matplotlib and I'm trying to make a live updating time series that reads from a serial port
I'm trying to set it up that by clicking a button it will start reading and plotting the incoming data
But I'm not quite sure how to go about it, should I use ion() and a while loop or use FuncAnimation?
turbid bay
I've been working on a basic machine learning code to calculate average test score varying on amounts of sleep and amount of study (per hour). I thought using a sigmoid function would be a good idea as that ranges between 1 and 0 and will not exceed this like that of a straight line which could give me more than 100% on the test. However my implementation hasn't been very good with my cost function recording values of around 2.0 billion before gradient descent and around 2.5 billion after it. below is the code what have i done wrong and how can i fix it? https://pastebin.com/y6fUU9xt
small ore
@simple fjord May I know what W_A1, TW_A1, etc and T1 to T10 are in your data? ALso what is Offsetwert?
Are there x,y,z ( co-ords) to your sensors? They may also be good inputs to your regression model.
From what I understood, you are trying to predict strain from temperature but given that your data seems to be time-dependent, do you want a straight corelation between those two or is there more to it?
simple fjord
W_A1 is sensor 1 strain, TW_A1 is it's corresponding temperature
@small ore
You can ignore T1 to T10
small ore
There must be some relative co-ords to where these are mounted no?
simple fjord
no just a straight corelation
yes there
with expectation (t) = strain
with minmal error
small ore
I do not understand you there
simple fjord
Yes just a straight corelation
I tried curve fitting but the results were so poor
as you saw in the figure
How the placement of sensors would help ?
I just want to get the mean of all temperature sensors
with each strain sensor
and get the prediction
I think the mean of all temperature sensors is good ?
small ore
I do not know your component. But in general I would say strain depends on the position as well as the temperature ( assuming there are no other loads) . So I feel it is important
simple fjord
you are correct
small ore
Unless you are mounting several strain gauges about the same point