#data-science-and-ml
1 messages · Page 129 of 1
 brave sand
 feral cedar
Do I need to study c++? If I am into AI
 small wedge
feral cedar
Do I need to study c++? If I am into AI
small wedge
feral cedar
Do I need to study c++? If I am into AI
no
feral cedar
small wedge
no
Good. Gotta you
small wedge
brave sand
a changing reward function
I'm still not 100% clear on what you're asking, sorry.
small wedge
feral cedar
Good. Gotta you
one of the reasons python is so popular for ML is that is can interface with libraries written in c/c++ like pytorch and tensorflow, so we get all of the preformance we need during the actual calculations and native python only handles the portion of the program that takes the minority of time/compute
feral cedar
small wedge
one of the reasons python is so popular for ML is that is can interface with lib...
Good. Is PyTorch a AI framework or just a math library
small wedge
feral cedar
Good. Is PyTorch a AI framework or just a math library
pytorch is a machine learning library, and most importantly it has an autograd
same for tensorflow
feral cedar
small wedge
pytorch is a machine learning library, and most importantly it has an autograd
Good. Is writing code for PyTorch also considered making ai?
small wedge
ML is a subset of AI, so yes
feral cedar

Good
I gotta learn how to build a small project to recognize the color of my underwear


Also help me to count how many sheep are there in my farm
Counting sheep is important in farming

 rich moth
Im making a capture the flag RL game

their acting real lazy though lol
lol this is fun, they are getting good at taking the flag and capturing each other now, its entertaining to watch
!paste
 arctic wedgeBOT
Pasting large amounts of code
If your code is too long to fit in a codeblock in Discord, you can paste your code here:
https://paste.pythondiscord.com/
After pasting your code, save it by clicking the Paste! button in the bottom left, or by pressing CTRL + S. After doing that, you will be navigated to the new paste's page. Copy the URL and post it here so others can see it.
rich moth
incase anyone wants to try it. https://paste.pythondiscord.com/PVKQ
They go after the green flag, they are starting to get better and converge on it , they're suppose to stay away from each other why the other team tags em.

It'll do that. It likes buzzwords.
I was thinking of using in unreal5. doing the visuals in there and porting this over to C++ or whatever it uses, i forget.
Something a little more fun and visually appealing
Your probably right. I havent loaded it up in a few months.
Im fascinated combining the two, that sounds.
fun..
rich moth
This start off incredible promissing, check it out. Watch the action, but it slowly degrades over time. But they come out the gate going for the flag and running for the opposite team. https://paste.pythondiscord.com/GCYA
rich moth
Damn is fun, I made the goals randomly spawn after each score and the flag randomly spawn too, Im gonna add collision detection too so they can block
A major problem Im having though is they eventually just slow down and stop. Im trying to fix that.
rich moth

woops i forgot to remove the other goals
its like a soccer game almost. But the collision detection works. I need to incorporate passing.
Like heres the red team trying to prevent blue from scoring.

lol this is exciting man, i wish I knew RL was so much fun.

 deep sleet
What is RL?
rich moth
Reinforcment learning, and its the bee's knees.
deep sleet
ohh
rich moth
It's a different kind of machine learning. You tend to use reward systems to get them to engage.
rich moth
I just learned today, I'm not exxpert.
rich moth
Please do! I improved it a bit, I had problems with that version just randomly stopping.
deep sleet
Thx!
rich moth
Let me know if you have any ideas. I think I'll make a github page incase anyone else wants to tinker with it.
deep sleet
ofc I probably will take a look at it by sunday I want to finish the ML course I am looking at first to not get scattered around 💀
rich moth
I need to work on some of the mechanics like perhaps passing and how that works. They seem to be in a standoff.
 deep sleet
oh
rich moth
The logic seems to be there, but I need more random events to keep things moving, you know?
Like a flag reset in this case.
deep sleet
this is a bit dumb but can't you make events like this cause it a loss in the reward system so it starts to avoid them?
rich moth
Fixed it, Now the flag will reset too if theres a detected stale mate. Its crazy how you can make something so simple yet so complex.

Thats funny cause I get Mattiss Image now, its the pygame icon. lol
When I was young. I worked on the game battlefield 1942 at EA, the first one. I remember the AI was a joke, the entire game we made and the AI was an absoulte disater. It's amazing how far we come.
deep sleet
rich moth
When I was young. I worked on the game battlefield 1942 at EA, the first one. I...
bro what??
you worked on battlefield 1942??
rich moth
deep sleet
bro what??
Yes sir, I was like 18.
deep sleet
holy shit man , I am a big fan xd
rich moth
Worked there almost 2 years though, one of the most fun jobs I 've ever had.
deep sleet
what is your current job?
rich moth
ups delivery driver
deep sleet
rich moth
Worked there almost 2 years though, one of the most fun jobs I 've ever had.
Man it was a master piece
deep sleet
rich moth
ups delivery driver
nice
rich moth
Ya, thanks. The people I met were amazing.
I updated the flag carrier in orange now, I just need to get the passing the ball part down.
 deep sleet
Nicee , can you check dm?
rich moth
deep sleet
Nicee , can you check dm?
I dont see anything
 violet gull
rich moth
Im making a capture the flag RL game
violet gull
rich moth
Im making a capture the flag RL game
what framework is that
rich moth
violet gull
what framework is that
its pygame, torch, sk-learn and networkx. You wanna check it out?
violet gull
if u get the RL to work yeah
rich moth
I figured out the passing part and who has the ball. The outside block color represents what team.

 vestal spruce
Hi is anyone familiar with Huggingface's Inference pipeline and currently available for help? I already posted my issue on the #1035199133436354600 if there's willing to help. TIA
rich moth
So far it seems like its working, It's been going for awhile now.
 rich moth
vestal spruce
Hi is anyone familiar with Huggingface's Inference pipeline and currently availa...
rich moth
vestal spruce
Hi is anyone familiar with Huggingface's Inference pipeline and currently availa...
I a bit, I use Haystack mainly.
rich moth
vestal spruce
Hi is anyone familiar with Huggingface's Inference pipeline and currently availa...
shoot your question.
vestal spruce
rich moth
shoot your question.
well I've already made some progress with another helper atm
still finding few error here and there, but I think I can manage to solve it on my own now, thanks for your interest to help out though. 🙏
rich moth
vestal spruce
[Here](https://discord.com/channels/267624335836053506/1253901666382512159)
wish you the best of luck
vestal spruce
rich moth
wish you the best of luck
much obliged Plunder 🎩 👌
 unkempt apex
what are this losses trying to say?

x -> episodes
y -> loss
so model is improving!
 spring field
unkempt apex
what are this losses trying to say?
spring field
unkempt apex
what are this losses trying to say?
you should add other metrics as well, loss on its own is not particularly helpful in telling you how well the model actually behaves
unkempt apex
spring field
you should add other metrics as well, loss on its own is not particularly helpfu...
and what are those metrics?
spring field
depends on what you're doing, RL? score is one of those metrics, steps taken is another
 unkempt apex
what are this losses trying to say?
unkempt apex
unkempt apex
what are this losses trying to say?
this are for 100
log-lin?
searching./..
yeah, but then I have to again run this!!
anyways lemme directly apply this in game! and see the results
 solid jasper
anyone the help me with my project
it a urgent request plzz plzz
unkempt apex
yeah just ask the question!
 wooden sail
for reference, these already exist built-in, and probably in a more useful way
semilogy and semilogx
they show the original values, but the spacing of the grid is logarithmic
!e
import numpy as np
import matplotlib.pyplot as plt
x = np.arange(100)
y = np.exp(x)
plt.semilogy(x,y)
plt.xlabel("x axis")
plt.ylabel("y axis")
plt.title("plot with log scale for y axis")
plt.savefig("biggest_oof.png")
:white_check_mark: Your 3.12 eval job has completed with return code 0.

 tidal bough
i typically do it as plt.yscale("log")
wooden sail
should be equivalent
 tawdry monolith
Completing numpy in 1 day will hamper my learning process or not??
spring field
tawdry monolith
Completing numpy in 1 day will hamper my learning process or not??
wdym completing numpy in 1 day? no, you can't really learn numpy in a day
tawdry monolith
spring field
wdym completing numpy in 1 day? no, you can't really learn numpy in a day
I mean completing a playlist not everything that exists on numpy 18 video 15-18 min
spring field
I'm not entirely sure how much of that information you'll be able to actually retain
ya gotta practice
 clear kayak
guys in this graph as you see, the x and y axis have the step value of 1 2 3
but the z axis has step walue of 0.2 , how can i make z axis step value also 1, inorder words all the 3 axis proportional

i used matplotlib
 toxic palm
Hi,
Anyone interested in doing a datascience project with me, pls let me know.
Tech stack that will be used: PySpark, AWS colud
 river cape
HI guys
I have a sample code of a neural network here
model.add(Dense(15,activation='relu',input_dim=6))
model.add(Dense(6,activation='relu'))
model.add(Dense(3,activation='softmax'))
model.compile(loss='categorical_crossentropy',optimizer='Adam',metrics=['accuracy'])
Now only the layer with the activation function, softmax , will have the loss function as categorical_crossentropy right?
What about the hidden layers , which loss function will be used on them?
 past meteor
river cape
What about the hidden layers , which loss function will be used on them?
past meteor
river cape
What about the hidden layers , which loss function will be used on them?
You only have a single loss function for the entire thing
wooden sail
river cape
Now only the layer with the activation function, softmax , will have the loss fu...
no, the loss is applied to the output of the network
through function composition, it acts on all layers
past meteor
With which you calculate the error wrt the output and propagate the gradient backwards
river cape
Oh so the hidden layers as such dont have a loss function?
wooden sail
layers don't have a loss function
you choose a loss to evaluate the output of the network
river cape
And while backpropogation it adjusts all the weights and biases of the metwork right?
river cape
wooden sail
you choose a loss to evaluate the output of the network
And the loss function is picked depending on the problem statement?
wooden sail
i would rather say "depending on the application" or "depending on the task"
since often there is no problem statement to begin with 😛 writing one is your responsibility
river cape
wooden sail
since often there is no problem statement to begin with 😛 writing one is your r...
Understood👍🏻
toxic palm
I am ok in pyspark, trying to do a small project where the data pipeline will be created by using lambda & stap functions.
pls suggest a good source regarding this...
past meteor
toxic palm
I am ok in pyspark, trying to do a small project where the data pipeline will be...
any reason why you're not going with full on databricks?
toxic palm
past meteor
any reason why you're not going with full on databricks?
my current project in the company uses these 3 technologies
rich moth
It's starting to get there. I just added saving and loading of what the players learn.
 rich moth
toxic palm
my current project in the company uses these 3 technologies
rich moth
toxic palm
my current project in the company uses these 3 technologies
Have you checked out AWS Glue? Sounds like what you need. https://docs.aws.amazon.com/glue/latest/dg/what-is-glue.html
Overview of AWS Glue, which provides a serverless environment to extract, transform, and load (ETL) data from AWS data sources to a target.
I just googled it.
 buoyant vine
Fucking hate glue
Step functions are alright but they get expensive as your runs increase and you are heavily vendor locked in
rich moth
toxic palm
my current project in the company uses these 3 technologies
well scratch that one 😂
buoyant vine
Generally speaking a small mwaa instance is probably better for the purpose of testing and portability
As much as I loath airflow, it is definitely better than the alternatives ATM for data pipelines and processing
And V2.7+ honestly isn't so bad
toxic palm
When i am reading about AWS step functions, it is always referred as serverless fn orchestrator. So, an step function can not orchestrate services like EC2, because it is server based service?
There is one more AWS service named AWS Glue, which is called as server less Data pipeline provided by AWS. Through AWS we can define whole work flow such as data loading, data cleaning & data loading. In fact we can even schedule jobs.
So, isn't it both AWS Glue & Step fn's are doing same job?
violet gull
Why are neural networks subject to overfitting but human brains are not?
 lapis sequoia
HELLO
there are actualy people whos here talking ??? 💀
i need help pls i beg u guys PLLSSS 😭
 agile cobalt
violet gull
Why are neural networks subject to overfitting but human brains are not?
agile cobalt
violet gull
Why are neural networks subject to overfitting but human brains are not?
- human brains have pretty good default hyper parameters, thanks to billions of years of evolution
- human brains can also 'over fit'
- the way humans learn is not directly comparable to the way machines learn
rich moth
violet gull
Why are neural networks subject to overfitting but human brains are not?
I think our idea of neural networks in uncomplete and simplified.
lapis sequoia
i want to know how a generic algorhitims work.
in python.
EXTREMELY SIMPLE WAY EXPLAINED!
code. or youtube video or a link.
JUST nOT using complex stuff to explain it pllllllllls
agile cobalt
lapis sequoia
i want to know how a generic algorhitims work.
in python.
EXTREMELY SIMPLE WAY ...
idk what you expect to get from using caps lock, but it does not have the effect you expect
lapis sequoia
agile cobalt
idk what you expect to get from using caps lock, but it does not have the effect...
😔 i need help to know how generic algo. works....
simple way
agile cobalt
it is not something that can be simplified enough for you to understand without studying its pre-requisites
lapis sequoia
link ?
i mean can u explain it me ?
or something ?
agile cobalt
there is no way I can explain it in a way you can understand
lapis sequoia
damn
agile cobalt
and I don't have any specific links for that
lapis sequoia
😔 im solo ig ye ?
agile cobalt
for an overview: https://www.datacamp.com/tutorial/reinforcement-learning-python-introduction
It does not gets much simpler than that, but you can try looking at each thing in more detail

Learn the fundamentals of reinforcement learning with the help of this comprehensive tutorial that uses easy-to-understand analogies and Python examples.
rich moth
lapis sequoia
damn
 lapis sequoia
ok thanks
 hidden sapphire
I'm experimenting with PyTorch and I want to try to make my own image upscaler, what loss function would I use for something like that?
I.E 256x256 image -> 512x512
rich moth
hidden sapphire
I'm experimenting with PyTorch and I want to try to make my own image upscaler, ...
How are you going to render the upscale?
agile cobalt
hidden sapphire
I'm experimenting with PyTorch and I want to try to make my own image upscaler, ...
I recommend looking into existing upscalers and researching how they were trained
I feel like there are a lot of things you should worry about before thinking about the loss function
hidden sapphire
agile cobalt
I recommend looking into existing upscalers and researching how they were traine...
Okay, will do thank you
hidden sapphire
rich moth
How are you going to render the upscale?
Honestly I don't know, I'm gonna do what etrotta said and look into everything lol ty both
 left tartan
lapis sequoia
my tensorflow is not dtecting gpu
left tartan
lapis sequoia
my tensorflow is not dtecting gpu
Paste code and error, preferably in a help thread.
 iron basalt
violet gull
Why are neural networks subject to overfitting but human brains are not?
iron basalt
violet gull
Why are neural networks subject to overfitting but human brains are not?
Humans brains not being prone to overfitting is an assumption.
violet gull
iron basalt
Humans brains not being prone to overfitting is an assumption.
proof?
iron basalt
violet gull
proof?
Indeed, you need to provide some.
violet gull
no u
iron basalt
Burden of proof lies on the person making the claim.
violet gull
thats not the entire phrase
lapis sequoia
left tartan
Paste code and error, preferably in a help thread.
there is no error bro its just using my damn cpu and not the gpu
violet gull
im saying santa clause doesnt exist you are saying he does, burden falls on you to prove it
iron basalt
Nope, I'm saying we don't know either.
The middle, undecided.
Everything is not either true or false.
lapis sequoia
bro is high
violet gull
iron basalt
Everything is not either true or false.
thats an assumption
iron basalt
violet gull
thats an assumption
This is just basic reasoning, if we can't agree that we can have true statements, false statements, and unkowns, then we have nothing to discuss further.
Let me give an example of why not having undecided is problematic. I can claim for example, that Santa does exist, and then when you say "no," I can just say "prove it," and now you have to do a bunch of work just because I said "nuh uh." Does that seem fair?
rich moth
In the context of burden of proof, the person making a claim is typically responsible for providing evidence to support their claim. This is similar to the observer in Schrödinger's cat experiment, who is responsible for opening the box and determining the cat's state.
iron basalt
iron basalt
Let me give an example of why not having undecided is problematic. I can claim f...
I can just keep spamming these, with no work on my end, giving you infinite work.
violet gull
i prove it not exist because there is no proof it does exist
iron basalt
left tartan
<https://en.m.wikipedia.org/wiki/Three-valued_logic#/editor/2>
(Yes, also having the middle is a crucial part of CS itself)
iron basalt
violet gull
i prove it not exist because there is no proof it does exist
You can discard the claim (no evidence / work on their part), but it's undecided. And for practical purposes, assume it's false (likelihood (prediction)).
left tartan
Comes up a lot in SQL, where null represent unknown, not absence of a value (or arguably both)
iron basalt
iron basalt
You can discard the claim (no evidence / work on their part), but it's undecided...
I can do the same with the brain claim, you kind of just made it up (without presenting evidence), and I wanted you to reflect on that. The question is itself making a claim.
This raises the question, why did you believe the human brain to not be prone to overfitting? This is an interesting question with an interesting potentional answer.
(It strikes at the heart of why ML-to-human comparisons are often hard / apples and oranges)

A false dilemma, also referred to as false dichotomy or false binary, is an informal fallacy based on a premise that erroneously limits what options are available. The source of the fallacy lies not in an invalid form of inference but in a false premise. This premise has the form of a disjunctive claim: it asserts that one among a number of alte...
rich moth
Looks like the guy from "Mad Magazine".
 crude karma
Hi does anyone have any experience with pandemic modelling especially modelling SEIR models? I have a question for you. Feel free to ping me
iron basalt
violet gull
i prove it not exist because there is no proof it does exist
Also btw, https://en.wikipedia.org/wiki/Argument_from_ignorance (I don't name these things, please don't take it as an insult, I want to provoke thought on the nature of human learning and overfitting, not really get stuck in the weeds here)

Argument from ignorance (from Latin: argumentum ad ignorantiam), also known as appeal to ignorance (in which ignorance represents "a lack of contrary evidence"), is a fallacy in informal logic. The fallacy is committed when one asserts that a proposition is true because it has not yet been proven false or a proposition is false because it has no...
(But I think you may benefit from learning of this concept (entire wars have been started over politicians not understanding this (or probably intentionally ignoring it)))
TLDR: ||Appeal to ignorance: the claim that whatever has not been proved false must be true, and vice versa. (e.g., There is no compelling evidence that UFOs are not visiting the Earth; therefore, UFOs exist, and there is intelligent life elsewhere in the Universe. Or: There may be seventy kazillion other worlds, but not one is known to have the moral advancement of the Earth, so we're still central to the Universe.) This impatience with ambiguity can be criticized in the phrase: absence of evidence is not evidence of absence.||
hidden sapphire
I'd love to ask a LLM like chatgpt (in seperate "conversations") to generate a random number 1-100 a couple thousand times and plot the results
violet gull
hidden sapphire
I'd love to ask a LLM like chatgpt (in seperate "conversations") to generate a ...
do it
 serene scaffold
hidden sapphire
I'd love to ask a LLM like chatgpt (in seperate "conversations") to generate a ...
serene scaffold
hidden sapphire
I'd love to ask a LLM like chatgpt (in seperate "conversations") to generate a ...
for your awareness: the conversation history that the LLM can take into account when generating a response is called the context window. So you're saying that you want to ask the LLM in separate contexts to fulfil your request.
My department has a lab where I could actually do this on several LLMs for free. If I get time on Monday, I'll do it and report back.
 proper crag
which calculus course i need to learn for data science?
 violet gull
proper crag
which calculus course i need to learn for data science?
violet gull
proper crag
which calculus course i need to learn for data science?
multivariable
proper crag
violet gull
multivariable
thx
deep sleet
Let's say I did all my preprocessing on a device and I want to do the modeling process itself on another one
what is the best way to store the preprocessed data?
 buoyant kite
proper crag
which calculus course i need to learn for data science?
buoyant kite
proper crag
which calculus course i need to learn for data science?
Hello
proper crag
hello
hidden sapphire
serene scaffold
for your awareness: the conversation history that the LLM can take into account ...
Ah okay thank you and if you do it please share the results ❤️
rich moth
deep sleet
Let's say I did all my preprocessing on a device and I want to do the modeling p...
I use elasticsearch.
deep sleet
rich moth
I use elasticsearch.
What is that? Can you provide a link for it?
rich moth
deep sleet
What is that? Can you provide a link for it?
It might be easier to use something like hdf5, parquet file maybe you can use pickle? Whats the nature of your data?
deep sleet
rich moth
It might be easier to use something like hdf5, parquet file maybe you can use pi...
Panda dataframes
rich moth
deep sleet
I will check out both!
curious to know what you went with and how it worked out
proper crag
Can i use y=x^2 dy/dx to find revenue change in a data set ?
rich moth
Could really use some help with my model that can understand and generate images and their descriptions(well thats the hope anyways). I feel like I'm right there. was really hell bent getting the XLM Roberta model working, I had gpt2 working, but maye you guys have some suggestions. Someone said its not great for what I want it todo but Im not sure why. It bascially compress images into a compact reprensation, preserving the important features and information. It uses utilitzes this inforrmation in the bottleneck of the reconstruct that image but also generation the captions/desciptions of the images, it finds realtionshipts between the images and the text and aligns this to create captions and images as one entity.
rich moth
Actually i havent seen results this interesting in awhile. I feel like its doing some serious processing, neverr takes that long. Training: 100%|██████████████████████████████████████████████████████████████████████| 1551/1551 [39:01<00:00, 1.51s/it] Evaluation: 2%|█▎ | 7/388 [02:31<2:16:52, 21.55s/it]
buoyant vine
deep sleet
what is the best way to store the preprocessed data?
Parquet if it includes text etc... otherwise safe tensors
 elder coyote
opencv is not detecting all of the frames if they are the same between long_video and ad_video any fix?? `
def compare_frames(frame1, frame2, threshold=0.80): # Adjusted threshold to 80%
if frame1 is None or frame2 is None:
return False
frame1_gray = cv2.cvtColor(frame1, cv2.COLOR_BGR2GRAY)
frame2_gray = cv2.cvtColor(frame2, cv2.COLOR_BGR2GRAY)

score, _ = ssim(frame1_gray, frame2_gray, full=True)
return score >= threshold`
I think you are having some confusion around the different types of LLMs, not all of them are equal and for the same task.
So for example Roberta and XLMR are both examples of primarily encoder only models.
Generally speaking encoder models are specialized for ingesting (encoding) data into some numerical representation which you can then use to classify content into say categories for text classification.
What you seem to want is an encoder-decoder type model (what most people think when they talk about LLMs i.e GPT2, chatgpt, etc...) which ingest(encode) and can then output other text(decode) in another language or in another context for example.
https://medium.com/@minh.hoque/a-comprehensive-overview-of-transformer-based-models-encoders-decoders-and-more-e9bc0644a4e5 might give some insight into why Roberta/other BERT type models (which are encoder models) don't function well for your application where you are trying to generate text from the resulting input

Medium
Transformers are a type of deep learning architecture that have revolutionized the field of natural language processing (NLP) in recent…
 hybrid yacht
Has anyone have any Idea or have made Any AI modelmodels for Accounting or Financing can they share what they did and how Thanks in Advance
past meteor
buoyant vine
Parquet if it includes text etc... otherwise safe tensors
or an actual DB
rich moth
buoyant vine
I think you are having some confusion around the different types of LLMs, not al...
I agree with you that it was designed for mainly encoding it works quiet well as a decoder though, I like the fact its multilingual too. You have to set the config to is_decoder = True . but if my last attempt here doesnt fix it, Ill try switching to something else got any recommendations?
buoyant vine
rich moth
I agree with you that it was designed for mainly encoding it works quiet well as...
The problem is decoders specifically are missing certain parts that allows it to correct produce sentences
I.e. cross attention and attention across the outputs
buoyant vine
rich moth
I agree with you that it was designed for mainly encoding it works quiet well as...
I'd recommend any common generative LLM
rich moth
buoyant vine
I'd recommend any common generative LLM
I have a version with gpt2, that works.. I see your point. Ill check that one out again
rich moth
buoyant vine
https://medium.com/@minh.hoque/a-comprehensive-overview-of-transformer-based-mod...
Im gonna read that in the morning. But I googled some things I came along the VL-Bart, which sounds interesting. Have you heard of it?
buoyant vine
Not VL specifically
But BART in general is a well known type of model, normally for text translation
MBART probably the most common variant of that
 mortal dove
serene scaffold
for your awareness: the conversation history that the LLM can take into account ...
mortal dove
serene scaffold
for your awareness: the conversation history that the LLM can take into account ...
I suspect 42 and 69 might appear more regularly than other numbers depending on the model due to the prevalence of these numbers in online discussion
rich moth
mortal dove
I suspect 42 and 69 might appear more regularly than other numbers depending on ...
yup, 7, 11, 13 I imagine too. just in culture in general they come up alot in contexxt
 warm trellis
Hello everyone!
I've a model which I've trained on a data without a problem and it does a good job in predicting.
I want to employ this model for transfer learning into a new dataset, but with new dataset it spits out nan values
How can I debug and understand where the things went wrong?
left tartan
warm trellis
How can I debug and understand where the things went wrong?
Maybe start with looking at dtypes for the test vs new dataset?
warm trellis
They use same dataset structure
class DKACS(Dataset):
    def __init__(self, path: str, horizon: int, input_size: int, transform: Optional[List[Callable]]=None, target_transform: Optional[List[Callable]]=None,  data_path='./'):
        self.data: pd.DataFrame = pd.read_csv(path).values
#         self.data = data.values.astype(np.float32)
        self.h = horizon
        self.w = input_size
        self.transform = transform
        self.target_transform = target_transform
        self.features, self.label = self.create_windows()


    def create_windows(self):
        total_possible_window_size = len(self.data) - self.w - self.h - 1
        features = np.zeros(shape=(total_possible_window_size, self.data.shape[1], self.w), dtype=np.float32)
        label = np.zeros(shape=(total_possible_window_size, self.h), dtype=np.float32)
        for i in range(total_possible_window_size):
            features[i] = np.transpose(self.data[i:i+self.w])
            label[i] = self.data[i+self.w+self.h-1, -1]
        return features, label

    def __len__(self):
        return len(self.features)

    def __getitem__(self, idx):
        features = torch.from_numpy(self.features[idx].astype(np.float32))
        label = torch.from_numpy(self.label[idx].astype(np.float32))

        return features, label
basically thing is that: when I use for prediction:
with torch.no_grad():
    for i in train:
        with torch.no_grad():
            print(tcnecanet(i))
Everything works smoothly, but when I try to use the model for transfer learning
class PVTLModel(pl.LightningModule):
    def __init__(self):
        super().__init__()
        layers_tl = []
        self.feature_extractor = nn.Sequential(*list(tcnecanet.children())[:-2])
        print(layers_tl)
        self.flatten = nn.Flatten()
        self.linear_1 = nn.Linear(512, 256)
        self.linear_2 = nn.Linear(256, 128)
        self.output_layer = nn.Linear(128, 1)
It spits out nans
spring field
how do you calculate the loss?
warm trellis
I'm using for it. nn.functional.l1_loss(x_hat, y)
Function 'AddmmBackward0' returned nan values in its 2th output. that's another thing I get when use determination mode
spring field
just a guess, but one cause for nans could be division by 0 happening somewhere
warm trellis
spring field
just a guess, but one cause for nans could be division by 0 happening somewhere
hm I guess it's not data related then
spring field
well, it could be exactly data-related
as in, previous data never caused such a situation
spring field
what's tcnecanet?
warm trellis
tcnecanet = TCNETANetGRU.load_from_checkpoint(Path(artifact_dir) / "model.ckpt")
just another model were trained on a bigger dataset
spring field
right, what does that model do though?
warm trellis
regression
warm trellis
warm trellis
Function 'AddmmBackward0' returned nan values in its 2th output. that's another ...
Do you know what does this mean?
spring field
Nope, I think you'll want to step through your model every step of the way and see where the nan values appear
warm trellis
yeah in lstm layers
 grand adder
Hi, I'm a web developer and I don't know anything about data science. I wanted to ask how complicated you think this idea would be or if there is an existing tool I could learn that would be useful.
Lets say at any given time I have thousands of images that are grouped by various tags "70s fashion" "retro videogames", etc; so they all fit a specific theme. I'm tasked with narrowing it down from thousands to maybe 100 of the most visually appealing to humans so that I can make a page on that given topic with some very clickable images.
I start by getting rid of things like file sizes too big for use case, file sizes too small to be the ideal picks, but ultimately Im still left with making decisions about what to use in a sample size that is too large.
Is it possible that some kind of ML model would be as good as me at telling what humans will find appealing?
 snow axle
how tos start with data science? i am done with basics of python numpy and a little ml theory. i need some guidance please
?
small wedge
grand adder
Hi, I'm a web developer and I don't know anything about data science. I wanted t...
Is it possible that some kind of ML model would be as good as me at telling what humans will find appealing?
Probably, this is what recommendation models do every day. Youtube is likely a lot better at sifting through videos and finding things you will watch than you are yourself.
grand adder
so what goes into training such a model? It has to be more than feeding it images. You would need data on clicks
I guess I would be worried about something that prioritized clicks over quality and representing what the topic is
 versed pilot
snow axle
how tos start with data science? i am done with basics of python numpy and a lit...
versed pilot
snow axle
how tos start with data science? i am done with basics of python numpy and a lit...
maybe pandas next, if you are going to work with csv and other tabular data? And some statistics? You can do some basic things e.g. correlations with Pandas, but scipy.stats has a lot more, and there are other dedicated stats libraries.
grand adder
because unlike Youtube if people click into the link and its not about the topic they expect, they arent going to just complain about it and watch anyway.
to some extent i can already assume the images under a category fit the topic but there are many that dont that have to be navigated around
maybe its just the sort of thing where i will easily be able to fix stuff like that on a last phase human check
small wedge
grand adder
so what goes into training such a model? It has to be more than feeding it image...
could be clicks, could be survey data, could be ratings from art competitions, any sort of data where you might be able to correlate user interaction with positive reponses. If you wanted to individualize the feed it'd need to include some user statistics as well. If you can find a premade/easily modifiable dataset that fits your needs fine tuning, transfer learning, or just straight up training one from scratch will be cut out for you with something like huggingface.
small wedge
grand adder
maybe its just the sort of thing where i will easily be able to fix stuff like t...
you could also implement online RLHF then, your model would update based on live user feedback; although that's a lot more involved and needs to be monitored so it's not abused by malicious users
or just online training in general if you can get more dataset samples from your users
grand adder
there wouldn't be any need for user specific data.
I'll have to look into it. I really don't know the firs thing about ML so in some ways even though I've been programming for years im as ignorant as a day 1 student on this subject.
 uncut plaza
I want to compare loss fucntiosn can someone tel me what py library can provide vislzaution like this?
 agile cobalt
that is probably just matplotlib or seaborn
uncut plaza
I checked pyvista and matpltlob but couldnt find any leads, any help would be appreciated
uncut plaza
agile cobalt
that is probably just matplotlib or seaborn
can you name the function
agile cobalt
not sure which specific one, but take a look at https://matplotlib.org/stable/gallery/mplot3d/index.html
versed pilot
sometimes other libraries use matplotlib under the hood
 faint star
uncut plaza
I want to compare loss fucntiosn can someone tel me what py library can provide ...
faint star
uncut plaza
I want to compare loss fucntiosn can someone tel me what py library can provide ...
U can use matplotlib. Use this line: plt.axes(projection='3d') to render your graphs to 3D format
deep sleet
What are you simulating?
oh
is this for work?
ohh
What is the usage of matlab in ML?
 slender kestrel
@past meteor hey man i just had a doubt does recrusive feature elimination assume feature indepence ? like there should be no correlation between the features being used for the model
unkempt apex
tried my AI in game now!!
but hey it is still dumb!
so should I change hyperparameters
or should I increase neurons in NN, so that model can be learn more effectively or it will get overfitted?
rich moth
I got rid of XLM Roberta and replace it with VL-Bart. But I dont think my 4090 is going to cut it for this task. I might need to switch to a different bart model. Anyone willing to check out the code? I could some help please Training: 0%|▏ | 3/1551 [10:09<105:46:55, 246.00s/it]
rich moth
buoyant vine
Not VL specifically
I went with your suggestion though, I'm using bart-large . I tried the VL-Bart but the training time was out of control.
pretty cool dude
 faint cobalt
Hey Folls!
I'm super stoked to share a side project I've been working on called Rensa! It's a high-performance MinHash implementation in Rust with Python bindings.
Rensa is all about fast similarity estimation and deduplication for large datasets. I've implemented a variant of MinHash that borrows ideas from C-MinHash but with some twists to keep it simple and memory-efficient.
Some cool features:
- Uses FxHash for blazing fast hashing
- Generates permutations on-the-fly with just two random numbers
- Includes an LSH index for quick similarity queries
- Python bindings for easy integration with data science workflows
I've benchmarked it against datasketch (a popular Python MinHash library), and Rensa is showing some promising results - about 2.5-3x faster!
I'd love to get some feedback from the community
Check it out on GitHub https://github.com/beowolx/rensa if you're interested! I'm all ears for any thoughts, critiques, or contributions 🙏
GitHub
High-performance MinHash implementation in Rust with Python bindings for efficient similarity estimation and deduplication of large datasets - beowolx/rensa
agile cobalt
faint cobalt
Hey Folls!
I'm super stoked to share a side project I've been working on calle...
did you test how it compares to pandas.read_csv().drop_duplicates(), polars.read_csv().unique() or DuckDB's equivalent?
or is that not for exact matches?
lapis sequoia
any project idea for cnn for resume @final kiln
the resources i have are not that good
faint cobalt
agile cobalt
did you test how it compares to `pandas.read_csv().drop_duplicates()`, `polars.r...
Those are different things actually
They remove identical rows
MinHash actually removes not only identical but also near identical
For example, imagine you have this entries:
- “The brow cat ate chocolate”
- “The white dog ate chocolate”
Using MinHash, you can remove those two entries.
it can also be used to for approximative search
past meteor
slender kestrel
<@260493929047130113> hey man i just had a doubt does recrusive feature eliminat...
implicitly yes, because if 2 features are perfectly correlated depending on your starting seed you may end up with either of the two in your final set
slender kestrel
past meteor
implicitly yes, because if 2 features are perfectly correlated depending on your...
it also depends on the model which i am using right since it uses feature scores from each model
so if the model is robust to correlation then there might be chance that my RFE will give decent outputs
lapis sequoia
my gpu is bleh will i be able to train these
have never done that before but sounds fun i would like to try
haha why
i mean until i can add it to my resume
am down
thanks man
unkempt apex
hey @rich moth
you did that CTF game right!
how did you improve agent's performance
my AI is becoming dumb I guess😂 after training in even 2000 episodes
slender kestrel
you have a non profit org ?
mind having a looking at your dms sir ?
sure ( also i just dmed )
rich moth
unkempt apex
hey <@204385862081970178>
you did that CTF game right!
how did you improve agen...
the secret recipe seemed to be integrating attention aggregation, reward based learning with dynamic adjustments . we can check it out if you want. I was wondering if there are custom built environment's that are prebuilt? I would imagine they hay benchmark enviroments already made for testing this?
unkempt apex
rich moth
the secret recipe seemed to be integrating attention aggregation, reward based l...
there is a prebuilt env for Pong, but for my own I make it from scratch!
attention aggregation seems to be new to me for now!! will take a look at that also
https://www.youtube.com/watch?v=8EcdaCk9KaQ
currently watching this
Instructor: John Schulman (OpenAI)
Lecture 6 Deep RL Bootcamp Berkeley August 2017
Nuts and Bolts of Deep RL Experimentation
unkempt apex
rich moth
the secret recipe seemed to be integrating attention aggregation, reward based l...
so for reward function, I have set that as per episode, if in a episode striker miss the ball then reward is -10 and if striker is able to catch/hit the ball then the reward is +10
and I have done 2000 episodes
the loss functions looks like this!
 deep sleet
Same here!
 half bolt
Any ( dt or ai ) py mobile app?
rich moth
unkempt apex
there is a prebuilt env for Pong, but for my own I make it from scratch!
maybe we can work on ssomething fun together
unkempt apex
rich moth
maybe we can work on ssomething fun together
yeah that will be nice!! , I am ready but first wanna train this dumb thing!
rich moth
unkempt apex
yeah that will be nice!! , I am ready but first wanna train this dumb thing!
no worries, we can brainstorm in the meantime
rich moth
Well the caption generation part didnt work, but I think I knew what I did wrong. However the reconstructions are coming along better.


 rancid sorrel
quick informal poll should i use S&P 500 for a Neural network or FTSE 100 ?
rich moth
S&P
 scenic parcel
anyone know of / use dagster?
serene scaffold
scenic parcel
anyone know of / use dagster?
I've heard of it but don't use. why?
scenic parcel
serene scaffold
I've heard of it but don't use. why?
thinking of either using dagster, prefect, or temporal to schedule scripts to download data / keep datasets updated
past meteor
scenic parcel
anyone know of / use dagster?
I use it
it's fine
Probably better to just bite the bullet and learn airflow though
scenic parcel
past meteor
Probably better to just bite the bullet and learn airflow though
from my limited research in the last hour airflow is old and hard to work with
past meteor
scenic parcel
from my limited research in the last hour airflow is old and hard to work with
It's older, but nothing insurmountable. Airflow 2 also borught a syntax that is quite similar to that of dagster
Either way,, you can't go wrong with using dagster 🙂
deep sleet
I am using scikit logistic regression , is there a way to make it only give a predicition if the probability for it is more than 75% instead of 50% and anything other than that would return a nan?
left tartan
deep sleet
I am using scikit logistic regression , is there a way to make it only give a pr...
What do you mean 'if the probability for
It is more than 75%'?
deep sleet
left tartan
What do you mean 'if the probability for
It is more than 75%'?
Like if I have 2 outputs yes and no , it will predict yes if it has the slighest bit over 50% right?
but I want to raise that for 75% and if the highest probability for the lowest value is les than that I would want it to give me a nan
left tartan
How are you predicting the result?
Show code (I'm trying not to spoonfeed the answer)
deep sleet
Okie
left tartan
But the short answer is: you can just filter the result and ignore anything above a threshold.
deep sleet
left tartan
But the short answer is: you can just filter the result and ignore anything abov...
model.fit(train_input, train_targets)
preds = model.predict(test_input)
print(train_preds)```And how are you getting the probabilities?
deep sleet
I skipped the data prepping code and the test_input prepping function since ig it's useless
deep sleet
left tartan
And how are you getting the probabilities?
You would use model.predict_proba but I been playing with it for a while and couldn't get to anywhere
so I thought there might be a parameter for it or something
left tartan
It's just a conversion / filtering of the probabilities.
But this is more a numpy thing: given a 2d array of classes and their probabilities, find most likely class but na if the probability is less than X
lapis sequoia
Yo, I put a month into NLPs and RNN stuff because, I love all of this more than really anything. But like, what is the best layer to avoid overfitting with LSTMs? It is so hard to find info on RNNs, not CNNs. I thought some lad was joking about linguistics. Like, oh lord. Is stemming ever better than lemming when classifying a name? Probably not. “Hey, what’s up John”? Remove punctuations and stop words and stem it: Joh. Joh is not a name. It is John.
deep sleet
@left tartan I did it , I am so dumb XD , the whole issue was that I always extracted prob as a list not an integer , fixing that a simple if function worked
If there are rows in my data in categorical columns with nan , what can I do to impute them so I am able to onehotencode the data?
rich moth
Training:   0%|                                                                                 | 1/1551 [03:00<77:52:31, 180.87s/it]Training:   0%|                                                                                | 1/1551 [09:10<236:59:14, 550.42s/it]```

I got the captions working but the next epoch to train is insane. I dunno. I feel like I dont have enough horsepower for this. I mean the captions are obviously wrong, but I feel like training can commence now.I think its the max new tokens, its too much context for the system to handle.
 bronze robin
In matplotlib is there any way to displace the second y-axis downwards? Like this plot was with twinx but I need the blue plot to be not overlapping with red plot but share same x-axis
 past meteor
deep sleet
I am using scikit logistic regression , is there a way to make it only give a pr...
past meteor
deep sleet
I am using scikit logistic regression , is there a way to make it only give a pr...
Why do you need it to be NaN for the other group?
rich moth
Hmm what do you guys think? The captions are (ill use the working losely here) working but it explodes with complexity starting the 2nd round. I might have to take out captions for now.. I have the I feel like its finally going to work yet I'll never know. Anyone want to help me out?
Feature shape: torch.Size([512]), Input IDs: tensor([[ 5159, 604, 11260, 25, 220]], device='cuda:0')
Generated Caption: Image 4 Caption: Video: Video of the day: A woman walks past a sign that reads, "I'm not a racist. I'm a human being." The sign reads: "You're not racist, you're a white person." A man walks by the sign. He says he's a black man, but he doesn't want to be identified.
Feature shape: torch.Size([512]), Input IDs: tensor([[ 5159, 642, 11260, 25, 220]], device='cuda:0')
Generated Caption: Image 5 Caption: Video: Video of the day: A woman is seen in a hospital after being treated for a gunshot wound to the head. The woman was taken to a local hospital where she was pronounced dead. Hide Caption 6 of 8 Photos: Play Video 1 of 2 �```@past meteor hey mate care to weigh in ?
tidal bough
bronze robin
In matplotlib is there any way to displace the second y-axis downwards? Like thi...
I thinkt that can be done by adjusting the ylimits for the two axes separately. E.g. if I alter that example as:
ax1.set_ylim([0,30e3])
ax2.set_ylim([-10,2])
I get:
 wooden sail
at that point i wonder if it wouldn't be better to just make 2 subplots with shared x axis instead
 mild dirge
I honestly dislike two plots with different scales in the same graph anyways.
Separate plots are probably better ^^
wooden sail
!e
import numpy as np
import matplotlib.pyplot as plt

x = np.arange(100)
y1 = 3*x + 5
y2 = np.cos(x*2*np.pi/20)

ax1 = plt.subplot(2, 1, 1)
plt.plot(x, y1)
plt.subplot(2, 1, 2, sharex=ax1)
plt.plot(x,y2)
plt.savefig("biggest_oof.png")
``` maybe like so:white_check_mark: Your 3.12 eval job has completed with return code 0.
 wooden sail
@bronze robin doing it this way guarantees the x ticks are aligned
bronze robin
tidal bough
I thinkt that can be done by adjusting the ylimits for the two axes separately. ...
thank you I missed that logic, is there any way to mark y-ticks on one side such that they dont overlap for this example red ticks start at 0 end at 20000 then blue ticks start from -1 and end at 2 (solved it)
tidal bough
probably possible, but you're just reinventing subplots at this point
bronze robin
wooden sail
<@756144716143263786> doing it this way guarantees the x ticks are aligned
I have already used subplot configuration figure but now my requirement is to have both plots in same plotting window as they are of same entity so I dont want two different windows to visualize
bronze robin
tidal bough
probably possible, but you're just reinventing subplots at this point
yeah Ikr but I need both in same window
tidal bough
Subplots would be in the same window.
(there's a window per figure, not per subplot)
bronze robin
tidal bough
(there's a window per figure, not per subplot)
sorry I mean same axes
deep sleet
past meteor
Why do you need it to be NaN for the other group?
It's just for the use case it would be better to not get a prediction if the probability isn't high
past meteor
slender kestrel
it also depends on the model which i am using right since it uses feature scores...
Yes, it could even be due to a different seed
Why do you want to do feature elimination
warm trellis
Hey guys. I've a source model which works really good. When I try to apply transfer learning and train another model on a limited and not quality dataset, the last layer in the same model which is LSTM starts to spit out (nan, nan, nan..., nan) values. How can I investigate?
serene scaffold
warm trellis
Hey guys. I've a source model which works really good. When I try to apply trans...
you'll need to go through every step of the process to figure out where the nans first appear
warm trellis
in lstm, though I cannot understand why it happens. I've no null values in my model, I've already trained this model on a different dataset with success. When I try to train a new model on top of it, does not work
left tartan
warm trellis
in lstm, though I cannot understand why it happens. I've no null values in my mo...
Just repeating his holiness, isolate the code, compare the inputs/outputs of a 'good' case to the bad case and see what's different, etc.
Basic engineering debugging: reduce variables, isolate the case, research the cause
 plush jungle
Battle school is going well!
 calm hatch
i am tasked with analyzing and predicting fashion trends for my data analysis course work and was unable to find any substantial data to help me get started...realized needed to scrape data. But data such as sales for a particular category-say cargo jeans is obviously not available. nor could i find data by a brand for their sales. if someone has worked on something similar or knows what might be good metrics for the data which i should look to scrape?? pls help
 jaunty helm
calm hatch
i am tasked with analyzing and predicting fashion trends for my data analysis co...
jaunty helm
calm hatch
i am tasked with analyzing and predicting fashion trends for my data analysis co...
maybe you can find something that fits your needs on kaggle?
otherwise idk either
Download Open Datasets on 1000s of Projects + Share Projects on One Platform. Explore Popular Topics Like Government, Sports, Medicine, Fintech, Food, More. Flexible Data Ingestion.
and other sites like openml or smthn
OpenML is an open platform for sharing datasets, algorithms, and experiments - to learn how to learn better, together.
calm hatch
jaunty helm
maybe you can find something that fits your needs on [kaggle](https://www.kaggle...
thanks..might need to query with different keywords to get a dataset that suits.Thanks for helping out.
deep sleet
Do you need to label it in sales and not maybe in searches?
calm hatch
deep sleet
Do you need to label it in sales and not maybe in searches?
do you mean the number of people searching for a product say "white canvas shoes" on search engines. to measure popularity.that's a bright idea. thanks
deep sleet
calm hatch
do you mean the number of people searching for a product say "white canvas shoes...
Yes
you can use google trends for that
I think there's a library called pytrends
that implement it easily on python
calm hatch
thanks🙇♀️ that super helpful--might end up helping me pass lol
deep sleet
but first check for datasets on kaggle , openml first as purplys mentioned
just leave this as a last resort
deep sleet
calm hatch
thanks🙇♀️ <:gem_red:813815883754766356> that super helpful--might end up help...
I am happy to help!
 next oak
Anyone who guides me..how to learn data science and ai..plz
How should I start to learn..
plush jungle
next oak
Anyone who guides me..how to learn data science and ai..plz
data science and ai is a huge topic. It's like saying how should I start to learn science?
what specifically about data science and ai interests you
 atomic crest
how can i add data to a pandas df?
jaunty helm
atomic crest
how can i add data to a pandas df?
pd.concat? any specific examples?
atomic crest
uh so i am like using pandas to open a csv and i want to be able to add an entire row to it at once
jaunty helm
atomic crest
uh so i am like using pandas to open a csv and i want to be able to add an entir...
sure, pd.concat can do that
atomic crest
ill have a look into that then
jaunty helm
>>> import pandas as pd
>>> df = pd.DataFrame([['a', 1], ['b', 10]])
>>> df
   0   1
0  a   1
1  b  10
>>> row = pd.DataFrame([['c', 20]])
>>> row
   0   1
0  c  20
>>> pd.concat([df, row])
   0   1
0  a   1
1  b  10
0  c  20
>>>
if i load a csv in, will the top row be loaded as the coloumns?
jaunty helm
atomic crest
if i load a csv in, will the top row be loaded as the coloumns?
it should be, if you use .read_csv()
atomic crest
jaunty helm
it should be, if you use `.read_csv()`
when i try that and i then overwrite the csv with to_csv it seems to mess it up
plush jungle
next oak
ML..
do you mean the theory or the applications? The ML used in vision, NLP, data science, and reinforcement learning all tend to be pretty different. is there a type of ML you're interested in?
next oak
plush jungle
do you mean the theory or the applications? The ML used in vision, NLP, data sc...
Yeah..but I am a beginner.
I wanna learn ML..
plush jungle
next oak
Yeah..but I am a beginner.
I guess my point is if someone asked "how do I learn science" and I started teaching them chemistry, they might be disappointed because they actually wanted to learn physics
but if you just want to learn ML in general, I'd say neural networks are a great place to start
deep sleet
plush jungle
but if you just want to learn ML in general, I'd say neural networks are a great...
start with neural networks?
next oak
plush jungle
but if you just want to learn ML in general, I'd say neural networks are a great...
Thanks..bro
plush jungle
there's a great video on how neural networks work by 3blue1brown

What are the neurons, why are there layers, and what is the math underlying it?
Help fund future projects: https://www.patreon.com/3blue1brown
Written/interactive form of this series: https://www.3blue1brown.com/topics/neural-networks
Additional funding for this project provided by Amplify Partners
Typo correction: At 14 minutes 45 seconds, th...
it goes into the theory pretty deeply, but in a way that makes more intuitive sense than just throwing a bunch of math at you
plush jungle
deep sleet
start with neural networks?
yeah neural networks are a good starting point because they're used in computer vision (CNNs), NLP (transformers), data science (deep neural networks in general), and reinforcement learning (DQN, PPO, etc)
so no matter what side of ML you're interested in, neural networks will probably come up
deep sleet
okie
 balmy zephyr
If im doing supervised learning how do I determine which features are statistically significant?
deep sleet
balmy zephyr
If im doing supervised learning how do I determine which features are statistica...
You want to increase the significance of a certain feature?
balmy zephyr
More like I want to select the features that will actually impact the target output. So like a feature selection question but maybe using some statistical method to determine it
past meteor
balmy zephyr
If im doing supervised learning how do I determine which features are statistica...
For linear models the most basic thing you can do is a t-test on the coefficients. If you use something like statsmodels you'll get this automatically. I'd really beware when doing this though
A more model agnostic way of doing this is for instance generating 2 features that are noise. Doing variable importance and then removing all variables of a similar importance to the noise features.
 dark karma
Hi everyone,I recently joined this server and am very interested in learning more about data science and AI. Since many of you are quite advanced in these fields, could you please suggest some ways for me to get started with data science and AI? I have a strong foundation in Python basics.Thank you!
I forgot to mention but I am really interested in the AI part about data science and AI
balmy zephyr
I’m nearly done with this course by Andrew Ng and feel like it’s been a good intro to machine learning https://www.coursera.org/specializations/machine-learning-introduction

Coursera
Offered by Stanford University and DeepLearning.AI. #BreakIntoAI with Machine Learning Specialization. Master fundamental AI concepts and ... Enroll for free.
 high agate
Hey guys, I have a question about lagging issues on Discord. So, I joined a server to discuss with others using voice. At the same time, I had many browser tabs open in Google Chrome. My question is, why does Discord often lag when I go back to the app on my laptop?
how to fix this issue?
deep sleet
What is regularziation?
unkempt apex
method to reduce overfitting!
 sturdy canyon
Hey all, I'm a computer vision based data scientist with a number of years of experience. I've also built my own business creating and hosting ML models. I'm thinking about going back to uni to get a masters/PhD since my current employer will pay for it, and I like learning. Does anybody have a school they had a good experience at that they'd recommend?
hidden sapphire
Anyone have any good resources for data visualization / model prediction boundary visualization?
rich moth
hidden sapphire
Anyone have any good resources for data visualization / model prediction boundar...
Have you looked into Kibana with elasticsearch? Its what I use.
scenic parcel
past meteor
Either way,, you can't go wrong with using dagster 🙂
this might be the best documented thing I've ever used
left tartan
sturdy canyon
Hey all, I'm a computer vision based data scientist with a number of years of ex...
I'd think this would largely depend on your country. Where are you?
sturdy canyon
left tartan
I'd think this would largely depend on your country. Where are you?
Good point, my bad. I'm in the US
Though, I am interested in hearing people's perspectives on what made their program a positive experience, US or not
left tartan
sturdy canyon
Good point, my bad. I'm in the US
I'm not a good example. My employers paid for my masters, and then I started on my PhD. I didn't finish, was a.b.d. Which is a common outcome. I attribute not finishing PhD mainly to poorly picking an advisor who wasn't that engaged; I had a different advisor option that I regret not choosing: I picked the person I knew over the person who had a reputation for getting candidates through.
Employers will often pay for graduate school courses, not sure about general policy on phds, but finishing a PhD while working is really hard ime
left tartan
Do you have a masters? If doing it while working, I'd do the masters first regardless.
 austere perch
Im applying to a MIT Data science and Machine learning course. Can yall look over my personal statement? Its 116 words and the max is 200.
With global energy consumption at an all-time high, a goal of mine is to promote a more sustainable, clean energy environment. I believe that AI can play a pivotal role in optimizing energy consumption and predicting maintenance needs for industrial equipment. Currently, I am interning at Mechademy, a company specializing in Predictive Maintenance of Industrial Machinery, by combining machine learning with IIOT(Industrial Sensory Equipment). My role is to conduct market research using Multi Agent AI Systems. That said, this course not only offers me a platform to learn new skill sets from profound professors in this growing industry, but also brings me one step closer to contributing to my goal of a more sustainable future.
rich moth
I made some changes to the generate captions. in this version i pass thje image features to the manifold autoencoder to produce latent representation and use that as the input embeddings for gpt2. This way the captions should align closer with the imges, rather than using token ids and a prompt. ``` def generate_captions(self, images, max_length=77):
print("Generating captions...")
image_features = self.encoder(images)
image_features = F.adaptive_avg_pool2d(image_features, (1, 1)).view(image_features.size(0), -1)
    captions = []
    for idx, feature in enumerate(image_features):
        # Pass image features through the decoder of the autoencoder to get a latent representation
        _, latent_representation = self.manifold_autoencoder(feature.unsqueeze(0))

        # Use the latent representation as input for the caption generator
        input_ids = torch.tensor(self.tokenizer.encode("Caption: ")).unsqueeze(0).to(self.device)
        attention_mask = torch.ones(input_ids.shape).to(self.device)
        outputs = self.caption_generator.generate(
            inputs_embeds=latent_representation,
            attention_mask=attention_mask,
            max_length=max_length,
            num_beams=5,
            no_repeat_ngram_size=2,
            early_stopping=True,
            pad_token_id=self.tokenizer.eos_token_id
        )
        caption = self.tokenizer.decode(outputs[0], skip_special_tokens=True)
        print(f"Generated Caption: {caption}")
        captions.append(caption)

    return captions```
anyone know what's difference between setuptools and source distribution when we want to packaging ML model?
rich moth
high agate
anyone know what's difference between `setuptools` and `source distribution` whe...
setuptools can create source distributions. It seems to be like pip for ML. If that makes sense.
spring field
rich moth
setuptools can create source distributions. It seems to be like pip for ML. If ...
"pip for ML" doesn't really make sense
you use setuptools to build wheels for your package, it's just one of the available build backends (see https://packaging.python.org/en/latest/tutorials/packaging-projects/)
spring field
high agate
anyone know what's difference between `setuptools` and `source distribution` whe...
source distribution means that you distribute the source code of your package
you can also build wheels that are ready to be installed by users instead of them having to build the package from source or similar
rich moth
I could use my own help Image Features Shape: torch.Size([16, 512]) Latent Representation Shape: torch.Size([16, 768]) Projected CLIP Features Shape: torch.Size([16, 512]) Projected Latent Features Shape: torch.Size([16, 512]) Combined Features Shape: torch.Size([16, 768]) Feature shape: torch.Size([768]), Input IDs: torch.Size([1, 6]) Evaluation: 0%| | 0/582 [00:01<?, ?it/s] Traceback (most recent call last): File "/home/plunder/MANFOLD97.py", line 692, in <module> main() File "/home/plunder/MANFOLD97.py", line 662, in main val_loss, val_psnr, val_ssim, val_captions, val_losses, recon_losses, vq_losses, clip_losses = evaluate( ^^^^^^^^^ File "/home/plunder/MANFOLD97.py", line 486, in evaluate captions = model.generate_captions(output_data, clip_model) ^^^^^^^^^^^^^^^^^^^^^^^^^^^^^^^^^^^^^^^^^^^^^^^^ File "/home/plunder/MANFOLD97.py", line 343, in generate_captions outputs = self.caption_generator.generate( ^^^^^^^^^^^^^^^^^^^^^^^^^^^^^^^^ File "/home/plunder/miniconda3/envs/qusar/lib/python3.11/site-packages/torch/utils/_contextlib.py", line 115, in decorate_context return func(*args, **kwargs) ^^^^^^^^^^^^^^^^^^^^^ File "/home/plunder/miniconda3/envs/qusar/lib/python3.11/site-packages/transformers/generation/utils.py", line 1449, in generate self._validate_generated_length(generation_config, input_ids_length, has_default_max_length) File "/home/plunder/miniconda3/envs/qusar/lib/python3.11/site-packages/transformers/generation/utils.py", line 1140, in _validate_generated_length raise ValueError( ValueError: Input length of input_ids is 0, but `max_length` is set to -691. This can lead to unexpected behavior. You should consider increasing `max_length` or, better yet, setting `max_new_tokens`. I'm losing my tokens and marbles over this. Anyone know whats going on?
How is my max_length going back in time like Doc?
past meteor
Crazy how much of a perf hit laptops with GPUs get when not plugged in
Was profiling stuff for a while to see where the slowdown was, tried all kinds of optimizations. Battery running low, plug it in. It's fast now 😩
 hard nest
Is LSTM useful for binary classification of data? Like not time series nor Word predictions
For example if I have data of a client in a business (is he VIP, age, usual buyer...) and I want to predict if he will buy x product or not (0 or 1)
left tartan
hard nest
Is LSTM useful for binary classification of data? Like not time series nor Word ...
Is there some ordering of the data? Like more recent data of the client vs newer?
The idea of lstm is to weight newer data differently than older data. If there's no ordering to the data, there's no L or S.
spring field
hard nest
Is LSTM useful for binary classification of data? Like not time series nor Word ...
RNNs are used specifically for time series analysis/prediction, if you don't have a time series, you probably don't want to use an RNN (LSTM is a type of RNN)
past meteor
hard nest
Is LSTM useful for binary classification of data? Like not time series nor Word ...
Sure, but your data should be in the form of time series
A common thing we do is hypo/hyperglycemia prediction. You couldl do this with an LSTM and predict these labels at each timestep
hard nest
left tartan
Is there some ordering of the data? Like more recent data of the client vs newer...
I could use only the clients with subscription and other then from the oldest to the newest
hard nest
past meteor
A common thing we do is hypo/hyperglycemia prediction. You couldl do this with a...
Oh, I will check that, thanks
left tartan
hard nest
I could use only the clients with subscription and other then from the oldest to...
Perhaps their propensity to buy might be related to the date of their subscription? Might be an interesting test.
hard nest
spring field
RNNs are used specifically for time series analysis/prediction, if you don't hav...
Yeah, but for example I used them to predict if a client will continue or stop a subscription and it worked pretty well
past meteor
Like there's two scenarios
Classifying an entire sequence or classifying each element of a sequence
RNNs are valid choices for both
spring field
hard nest
Yeah, but for example I used them to predict if a client will continue or stop a...
ig if you train on like monthly data or something, like periodic status updates, that could work, yeah
past meteor
But they're the leakiest abstraction in the entirety of ML
hard nest
Yeah but my data is from 1 day
past meteor
So if you can avoid them, avoid them (for instance by constructing features of the entire sequence and giving it to xg boost)
hard nest
Like taken from x date
hard nest
past meteor
But they're the leakiest abstraction in the entirety of ML
Oh, I see
spring field
do you have multiple days? I'm rather unsure about time series usage here based on your description
hard nest
My data rn is I take all the active clients subscribed, In a x date, and the info about them is the data
past meteor
So your task is predicting customer churn?
hard nest
And the target is 1 if they left some months later and 0 if they didn't
hard nest
past meteor
So your task is predicting customer churn?
Yeah
I saw a study that talked about LSTM combined with cnn
past meteor
Because they want to get published and getting published is easier if your methods are fancy 😛
spring field
cuz for sth like predicting stopping a subscription, there is time series involvement, for instance, you have daily/weekly/some other period usage data of the product and so it's somewhat reasonable to predict subscription status based on this activity because as it drops, one might think that the user is more likely to end the subscription
past meteor
hard nest
My data rn is I take all the active clients subscribed, In a x date, and the inf...
Do you have more than 1 measurement per person?
Like, for each day you have their daily activity?
hard nest
It's more like static data
Except how long they have been clients, mostly are the type of subscription and that kind
spring field
I don't see how an RNN type network makes sense in that situation then
cuz the amount of time they've held a subscription is of course related to time, but it's not exactly a time series
hard nest
Yeah, that's why I was asking if rnn can work to classify this kind of stuff
past meteor
hard nest
It's more like static data
So you have a summary of each client? And not daily data?
hard nest
I know they are for Time series but maybe they could work to predict, and since it gave me decent results I wasn't sure
past meteor
Then you should just use xgboost
hard nest
past meteor
Then you should just use xgboost
I did, that's my best model xd
But I was trying other ones for testing
spring field
I mean, technically... it could, since using an RNN for a single data point would be somewhat equivalent to using a linear layer... but I mean, it's not exactly meant for that
hard nest
I was done trying classifiers so I hopped to NN to try them
hard nest
spring field
I mean, technically... it could, since using an RNN for a single data point woul...
Yeah, that makes sense
Well, I'll see if I can get a TS of clients, that may help the prediction, if not I will just try other NN to see if I can find one that works better than XGboost
past meteor
If you have the data at a higher grain (daily data instead of summaries) you could use an RNN and do some sort of sequence classification (or classifying each timestep, you choose)
but it's finnicky
My expectation is that it would probably be better yes
spring field
in its current state it sounds just like simple classification , so just a fully connected network with a couple hidden layers might do the trick
hard nest
past meteor
If you have the data at a higher grain (daily data instead of summaries) you cou...
I will watch if I can get it, thx
past meteor
Don't make a fully connected network for it
Not worth the effort
If your data is tabular
past meteor
hard nest
I did one
And it was beaten by xgboost I presume
hard nest
past meteor
And it was beaten by xgboost I presume
Yep
past meteor
case in point
spring field
😩
past meteor
spring field
### 😩
this is definitely a thing. If you have structured data (things that humans can make sense of just by looking at the numbers) neural networks typically do not make sense
hard nest
Oh
past meteor
Time series are at the border of this
hard nest
I thought they could use what we see plus the characteristics of the data that they can find
past meteor
There's enough research that says that the traditional methods, even "stupid" things like holt-winters exponential smoothing even outcompete neural nets
But I think that's mostly univariate time series
For multivariate you can still get a long way with ARIMAX
past meteor
hard nest
I thought they could use what we see plus the characteristics of the data that t...
So can tree based models on tabular data, at least typically
You also need to factor in how annoying they are to train. Xgboost works decent with default hyperparameters. ARIMA has just pdq, if you don't have any trend it's just p and q
Compared to selecting layers, neurons per layer, activations, batch size, batch norm, dropout, learning rate
spring field
past meteor
this is definitely a thing. If you have structured data (things that humans can ...
neural networks don't make sense as opposed to xgboost? (what does it do anyway?)
I mean, since it was outperforming self-made nets, I guess it makes sense to use it
when do fully connected networks make sense then? for tabular data that is? I guess it can be (inefficiently) used for any type of classification like images, but other than that? (besides being used as finalizing layers or for latent space conversions and stuff like that in other architectures)
past meteor
spring field
neural networks don't make sense as opposed to xgboost? (what does it do anyway?...
this is not an exact science, just my empirical findings from doing many ML projects. Also supported by peers on kaggle. There's the no free lunch theorem, there will be a problem where a FC net outperforms a tree ensemble. It's just rare and ab-so-lutely not worth the trouble (for reasons above).
As for when FC networks make sense? I think since they have less inductive bias if you have a sufficiently large dataset and size they may outcompete exotic architectures on any given task. That's the theoretical argument
hard nest
past meteor
You also need to factor in how annoying they are to train. Xgboost works decent ...
Yeah, and I also optimized the xgboost with optuna
past meteor
The practical argument is that I'm doing hyperparameter tuning on time series, literally as we speak:
I added a feed forward net as a baseline
It performed the best, wanna know why?
It's so much easier to train it can explore the hyperparameter space better than others can. It takes a fraction of the time to train a feed forward net than whatever seq2seq CNN LSTM concoction I came up with
There's enough real world tasks where if you give fancy architectures that are slow, especially recurrent models, as much time to hyperparameter search as feedforward networks the latter will do better. This is under the assumption you don't know how the hyperparameters should be set a priori so your grid is reasonably large
oh, the very last argument is occam's razor
If you can get away without needing a GPU for training and deployment, you absolutely should
spring field
couldn't an argument be made that since, for example, supposedly recurrent networks are better for time series data, they would outperform the simple network eventually and in a somewhat reasonable timeframe, because the simpler network might just not be able to fit the function you're looking for no matter how much you tune the parameters
that said, from a practical standpoint, I guess it wouldn't not make sense to, perhaps, alternate between a fully connected and a recurrent network while searching for hyperparameters, so you have something for, uhh, production use already
also what about generalisation, for instance, what if recurrent networks, despite lower performance for the training and testing sets are capable of generalising over more vast data in the end?
past meteor
spring field
couldn't an argument be made that since, for example, supposedly recurrent netwo...
It's a bit of a meaningless term but feed forward networks are also universal approximators
On top of that, you can also make the argument that feedforward networks see all the input at once (no inductive bias) and the RNN may already have forgotten the first input by the end (precisely due to their inductive bias)
I think this is basically cutting a tomato with a chainsaw
text, speech and images are vastly different to the rest of ML from a practical pov
time series is on the very edge
spring field
past meteor
I think this is basically cutting a tomato with a chainsaw
as in, you'll make a mess and have to clean up everything?
past meteor
As in, it's possible but it's not appropriate
spring field
alrighty
past meteor

The m4 dataset
ultimate time series benchmark
notice how MLPs do way worse than naive (the baseline)
The last one is an RNN + exponential smoothing (the most basic model there is) combo
I think it was just exponential smoothing but they used an RNN to exploit the hierarchies in their data (product groups etc.)
hard nest
But here in a study I read they said a combination of RNN and CNN ended up working better than even boosting
https://www.nature.com/articles/s41598-023-44396-w/tables/6
past meteor
kind of an evil observation but if the inverse were true thn they wouldn't be published in nature 😅
So you always have to take it with a grain of salt
hard nest
What do you mean?
past meteor
They definitely have a vested interest in the fancy approach (RNN+CNN) working
If the more common approach won there would be nothing novel
Hence why the majority of papers I read for my domain also always seem to have a "brand new method that beats all the rest"
hard nest
So like it's more like a structure that works well in their data or something more than a general method?
spring field
past meteor
I assume higher is better?
past meteor
spring field
I assume higher is better?
no
hard nest
Seems like the error
spring field
past meteor
no
so, lower is better?
past meteor
yes
Last point here is that in reality a 1% difference isn't worth it in many use cases. If you can improve the GDP of a country that's huge but if it's a med size company 1% of anything doesn't matter too much
past meteor
past meteor
Factor in the time it takes to make a problem specific architecture (ES-RNN) + all the failed experiments versus taking ARIMA which you know a priori will work. Turn that into a salary cost and compare it to the efficiency gain of 1.5 % on the SMAPE 😅
spring field
so, I could get paid more is what you're saying (well, ig not long-term, lmao)
past meteor
hmm, I mean it more like, you run xgboost on many problems (that aren't speech, text or images) and out-of-the-box you're 95 % there (even without hyperparameter tuning)
spring field
I see
past meteor
The remaining 5 % may cost your business in wages than getting the result
They do, but it's exactly the same argument
I think you should try some time series. There's really good kaggle comps on it
Practice your ML skills on this approachable dataset!
number one on the compititon was a so called "Advanced Linear Model"
Practice your ML skills on this approachable dataset!
idt anyone used anything neural that got a high score
I participated 🤓
Actually start doing some Kaggle 👀
I think after enough you'll not use the neural net anymore for smth like this
Part of it is bias right? Because we're in the transformer deep neural net 130B parameters era
But, what won was a simple linear regression
Training transformers doesn't translate to doing "this"
Well, he did what I did (but cheated way more)
Make model => do predictions => analyze residuals in detail => make new model => .... => submit
Residual analysis is something that is not done when you're doing speech, image, text
because, well, the features don't mean anything
Whereas for tabular data knowing how to work with heteroskedasticity is absolutely key
Not really?
If you make a linear model and do predictions you can look at the residuals with respect to certain features to see where the model is underperforming and tweak accordingly
I mentioned heteroskedasticity because if there's a structure in your residuals you're missing a transformation somewhere tpyically
huh
For single regression yes
How are you going to do that with multivariate regression with relatively high dimensions
How are you going to spot the itneraction effects?
etc
For each combo?
This is an interesting conversation for me
Basically everyone I know did the trajectory of traditional ML => DL
yes but 1D is so rare, ofc it's going to be N-D
Unless it's a univariate series we're specifically talking about? Then you can get far with ACF and PACF plots
past meteor
past meteor
Basically everyone I know did the trajectory of traditional ML => DL
So this stuff goes against the conventional wisdom of "traditional ML" but I guess it makes sense that many are going for DL right away to do all the fancy NLP/Vision stuff
All I'm trying to say is that they require different approaches
And that it's not just me, a random person on the internet saying this, that you can see it if you brows tabular playground competitions in Kaggle
And look at how the winners came to their solutions (and what models they're using)
Looking at another time series comp, linear regression won again
Try some of Kaggle's tabular playground series
they are competitions that are easy to get started with
iirc there's a new one every month, but you can pick basically any older one
Especially if you're going for ML positions that also include tabular stuff (maybe they're less common now?)
Treating it like you'd treat DL is a red flag there, absolutely (interview wise)
You know what question I got for the MLE position?
"What makes random forest random. Why is random in the name?"
Basic question, I think if I didn't get it I was out 👉
KNN trees? 🤔
- It does bootstrapping (sampling from the dataset with replacement) to train each tree
- At each split it considers K < N features
- Averages the performance of all trees to come to a prediction
the randomness in RF mostly applies to the "bagging" it does (bootstrap aggregation)
which is step 1 and 3
step 2 is some extra randomness
seems like a different algo
imo worth looking into all of this
book 2 of the pinned post
I think it wouldn't take you a lot of time to read it
But I think you kinda have to
You have a couple of blind spots
IF you want to do tabular ML
I know way less than you in terms of transformers and NLP
like 0.00001 % of what you know there
so I'm not saying this to sound disparaging
the same applies to me (sorry if I sounded rude)
I just think that it'd take you a week to read it (not in detail, just skim it basically) max
and it'd pay off more than many other things you could do iin a comparable timeframe
it's a mix
Like, I never bothered applying for any ML NLP roles
I don't have the skillset
but there were still many cases (like the team I'm joining) that are still doing stuff like customer churn prediction
demand forecasting, ...
predictive maintenance, you know those kind of things
And for those ones, if you have that kind of interview in the pipeline
you gotta skim the book :p
It will, after all you are lisan Al Gayib!
spring field
cue Pirates of the Carribean soundtrack
 maiden trellis
does anyone know of any library to visualize data structures as trees? I don't mean the decision tree, suppose I have a dict of lists, I want to visualize something like that! I have tried graphviz and it works but I need to deploy on the HF space and it doesn't work there so I am looking for other options
 strong briar
maiden trellis
does anyone know of any library to visualize data structures as trees? I don't m...
strong briar
maiden trellis
does anyone know of any library to visualize data structures as trees? I don't m...
You can use matplotlib
Let me know if you had any work related to it, I will be glad to help
maiden trellis
strong briar
You can use matplotlib
Can you point me to the docs or the function? I already looked up for matplotlib, I didn't find any
strong briar
maiden trellis
Can you point me to the docs or the function? I already looked up for matplotlib...
Which language you using?
maiden trellis
strong briar
Which language you using?
Python
jaunty helm
maiden trellis
does anyone know of any library to visualize data structures as trees? I don't m...
networkx?
maiden trellis
jaunty helm
networkx?
Thanks, I'll look into it
strong briar
Here is an example how it can work together matplot and networkx ```import matplotlib.pyplot as plt
import networkx as nx
def draw_tree(tree, pos=None, parent=None, graph=None):
if graph is None:
graph = nx.Graph()
if pos is None:
pos = {}
if isinstance(tree, dict):
for k, v in tree.items():
graph.add_node(k)
if parent:
graph.add_edge(parent, k)
pos[k] = (len(pos), -len(pos))
draw_tree(v, pos, k, graph)
elif isinstance(tree, list):
for idx, item in enumerate(tree):
node_id = f'{parent}_{idx}'
graph.add_node(node_id)
graph.add_edge(parent, node_id)
pos[node_id] = (len(pos), -len(pos))
draw_tree(item, pos, node_id, graph)
else:
graph.add_node(tree)
if parent:
graph.add_edge(parent, tree)
pos[tree] = (len(pos), -len(pos))
return graph, pos
tree = {
'A': {
'B': ['C', 'D'],
'E': {'F': 'G'}
}
}
graph, pos = draw_tree(tree)
nx.draw(graph, pos, with_labels=True, arrows=True)
plt.show()
They use graphviz, I can't use anything using graphviz unfortunately
strong briar
maiden trellis
They use graphviz, I can't use anything using graphviz unfortunately
Use matplot and networkx
maiden trellis
strong briar
Use matplot and networkx
This is how I want the tree to look and work like, can I get this with matplot and networkx?
 strong briar
maiden trellis
This is how I want the tree to look and work like, can I get this with matplot a...
strong briar
maiden trellis
This is how I want the tree to look and work like, can I get this with matplot a...
I can create that for you, if you want
maiden trellis
strong briar
I can create that for you, if you want
I'd like to do this on my own because I wanna learn, this is a part of my research internship and the code is going to be used to demonstrate some thing but thanks for the help :)
strong briar
maiden trellis
I'd like to do this on my own because I wanna learn, this is a part of my resear...
You can learn it better, when you see the process by an expert
I can get this done to you, with a video showcasing why and how
serene scaffold
past meteor
I don't have the skillset
yes you do, king
left tartan
maiden trellis
does anyone know of any library to visualize data structures as trees? I don't m...
Graphviz. Every other option, ime, is terrible
maiden trellis
left tartan
Graphviz. Every other option, ime, is terrible
left tartan
maiden trellis
https://discord.com/channels/267624335836053506/366673247892275221/1255156088525...
Why not?
maiden trellis
left tartan
Why not?
I can't use Graphviz, I am using HF space and to use graphviz, you need to have it installed on your system as well along with the pip and I can't do that in HF space
left tartan
maiden trellis
I can't use Graphviz, I am using HF space and to use graphviz, you need to have ...
(Graphviz in wasm)
maiden trellis
left tartan
Use <https://hpcc-systems.github.io/hpcc-js-wasm/classes/graphviz.Graphviz.html>...
Is it possible to use JavaScript in gradio?
maiden trellis
left tartan
Gradio just serves a web app
Okay, thanks for the help! I am new to this deployment part. I have always been limited to notebooks previously!
left tartan
maiden trellis
Okay, thanks for the help! I am new to this deployment part. I have always been ...
Just remember that notebooks and gradio and most data science front ends are "just" web apps.
 merry ruin
so guys i've learnt basics of python, now how do i start my journey to master it?
left tartan
merry ruin
so guys i've learnt basics of python, now how do i start my journey to master it...
Practice by doing projects.
 bleak sky
Hey.. Has anyone ever created a tableau dashboard for food or sports related data? like food production, consumptions, prices, etc. I'm new to tableau so i need some help. Please ping me if you have something on this topic... 🙏
 wooden copper
hey...need a help with ultralytics
tried the code in google colab, the training part work, but quits itself
can i send the code here?
i mean the snippet
serene scaffold
wooden copper
can i send the code here?
!code yes
arctic wedgeBOT
wooden copper
serene scaffold
!code yes
Hey thank you
figured it out myself and it worked :)
brave sand
how do I find correlation between a dependent variable and independent variable
unkempt apex
brave sand
how do I find correlation between a dependent variable and independent variable
are you visualizing your input features?
brave sand
unkempt apex
are you visualizing your input features?
no this is a different thing
unkempt apex
what is that different thing?
brave sand
i have an x and y for a dataset and i want to find a curve that fits it
unkempt apex
brave sand
i have an x and y for a dataset and i want to find a curve that fits it
x is input features?
spring field
brave sand
i have an x and y for a dataset and i want to find a curve that fits it
just fit a curve? well, for starters, there's numpy.polynomial.polynomial.Polynomial.fit
brave sand
spring field
just fit a curve? well, for starters, there's [`numpy.polynomial.polynomial.Poly...
can you help me use it?
i have the list of x and y from the csv i extracted
spring field
not right now, no, I'm heading to bed right now pretty much, but you can take a look at the documentation I linked, it has some usage examples that should help you get the gist of it (it apparently does not have examples on its own) you can take a look at numpy.polyfit, it has very similar usage and it does have examples, you can even use that function instead, it just suggests to use the other one I linked instead, but their usage is very similar and you can take examples from this one to get the gist of how to use the recommended one
past meteor
brave sand
how do I find correlation between a dependent variable and independent variable
np.corr? (edit, it's np.coercoeff)
even easier, read it all in with pandas and do df.corr()
brave sand
past meteor
np.corr? (edit, it's `np.coercoeff`)
what is that
past meteor
corr means correlation
past meteor
past meteor
even easier, read it all in with pandas and do `df.corr()`
it's actually this one you want
brave sand
past meteor
it's actually this one you want
i have this so far:
import pandas as pd
import numpy as np

#should first read file
df = pd.read_csv('data.csv')

#extract the arrival_kg and market price (min_rs_per_kg)
arrival_kg = df.iloc[:, 10].tolist()
min_rs_per_kg = df.iloc[:, 7].tolist()

# print(min_rs_per_kg)
# print(arrival_kg)

# want to show arrival_kg vs market price
p = np.polyfit(arrival_kg, min_rs_per_kg, 3)

print(p)```this doesnt give me a function tho
past meteor
You're aksing 2 different things I see
brave sand
i want to find a function that i can give a arrival kg and it'll give me a price
from this data
past meteor
So you want to do regression?
past meteor
or do you want a correlation coefficient
wooden sail
brave sand
this doesnt give me a function tho
this returns the coefficients of a polynomial. it uniquely defines a polynomial function
brave sand
it should be supply and demand
past meteor
Is this homework?
brave sand
no, this is a project of mine
past meteor
You want to find the relationship between both variables?
brave sand
yeah
brave sand
ohhhhh i didnt think of that
wooden sail
i think you're also misusing some terminology here. by correlation did you mean a function that transforms an input into an output?
brave sand
let me try that
past meteor
wooden sail
i think you're also misusing some terminology here. by correlation did you mean ...
this is what confused me
brave sand
wooden sail
i think you're also misusing some terminology here. by correlation did you mean ...
so basically i have this file:

i want to find the relationship between arrival and min_rs_per_kg
wooden sail
what do you mean by "relationship" though, that's not a technical term
past meteor
You have to plot your data
brave sand
a function
past meteor
Afterwards you can fit a linear function
deep sleet
What are the best ways to counter overfitting with decision trees?
past meteor
Potentially with a non-linear transformation
That you can easily determine by plotting your data
past meteor
deep sleet
What are the best ways to counter overfitting with decision trees?
Reducing the number of features it can consider per split and/or pruning it
brave sand
let me try to plot it first
past meteor
And obviously, the maximum_depth
deep sleet
past meteor
And obviously, the maximum_depth
Yes I played with that
past meteor
The default hyper parameters of random forest are very very very geared towards overfitting imo
I think they should change them, but I don't have specific ideas on how. Maybe I should think about it 👀
deep sleet
I made a loop to scroll from 1 to the maximum depth causing the overfitting to see which one has the best accuracy for test data
but this is very inefficient
deep sleet
past meteor
Reducing the number of features it can consider per split and/or pruning it
oh
past meteor
Let's have a look here: https://scikit-learn.org/stable/modules/generated/sklearn.ensemble.RandomForestClassifier.html
- Max_depth is a big one to tune
- max_features is another
But, the solution is hidden in plane sight
it's not changing any of the hyperparameters and pruning the tree
CTRL-F to ccp_alpha. There's an explanation about it https://scikit-learn.org/stable/modules/tree.html#minimal-cost-complexity-pruning + https://scikit-learn.org/stable/auto_examples/tree/plot_cost_complexity_pruning.html#sphx-glr-auto-examples-tree-plot-cost-complexity-pruning-py

scikit-learn
The DecisionTreeClassifier provides parameters such as min_samples_leaf and max_depth to prevent a tree from overfiting. Cost complexity pruning provides another option to control the size of a tre...
scikit-learn
Decision Trees (DTs) are a non-parametric supervised learning method used for classification and regression. The goal is to create a model that predicts the value of a target variable by learning s...
past meteor
deep sleet
I made a loop to scroll from 1 to the maximum depth causing the overfitting to s...
this is "illegal"
you shouldn't use the same test set over and over and over, by then it's just another training set
deep sleet
past meteor
Let's have a look here: <https://scikit-learn.org/stable/modules/generated/sklea...
Will give it a read!
past meteor
 past meteor
In practice you should nearly always split twice (or cross validate)
deep sleet
past meteor
you shouldn't use the same test set over and over and over, by then it's just an...
but it doesn't matter as long as it's fit on the training data only right?
past meteor
deep sleet
but it doesn't matter as long as it's fit on the training data only right?
it really really does matter
deep sleet
past meteor
In practice you should nearly always split *twice* (or cross validate)
sorry I don't understand
past meteor
The goal is evaluating how your model performs on unseen data
deep sleet
past meteor
it really really does matter
but how? doesn't it just pass it sorry the tree it already made without doing any changes?
past meteor
If you write a for loop that tries different hyperparameters on the test set
YOU (the data scientist) have seen the data and you'll adjust the model to fit it better
deep sleet
oh
past meteor
So you will cause it to overfit
deep sleet
that makes sense xd
brave sand
@past meteor how can I find a function and a correlation and how do I know if the regression is good?
clearly it's linear?
past meteor
deep sleet
that makes sense xd
In practice you solve this by splitting twice or splitting once and then cross validating to find hyperparameters, pick the very best model and then evaluating it a single time on the test set
deep sleet
past meteor
In practice you solve this by splitting twice or splitting once and then cross v...
wdym by splitting and cross validating
past meteor
brave sand
<@260493929047130113> how can I find a function and a correlation and how do I k...
https://scikit-learn.org/stable/modules/generated/sklearn.linear_model.LinearRegression.html you can train a linear regression using sklearn
deep sleet
I am still new and mostly not familiar with most of these terms
past meteor
deep sleet
wdym by splitting and cross validating
dw, I'll explain it in a bit more detail
deep sleet
I am very sorry
past meteor
don't apologize 😄
deep sleet
past meteor
dw, I'll explain it in a bit more detail
Tysm man!
past meteor
You have good intuitions / questions for a beginner
serene scaffold
you don't need to apologize for not knowing stuff.
except for how to drive
I encounter so many people where I'm like "you need to stop"
deep sleet
serene scaffold
you don't need to apologize for not knowing stuff.
I just sometimes feel it's laziness asking these questions
instead of searching but the internet sometimes doesn't have simplified answers
brave sand
past meteor
<https://scikit-learn.org/stable/modules/generated/sklearn.linear_model.LinearRe...
wait why cant i use np.polyfit with degree 1? is that not an assumption i can do?
it seems like a straight line that represents supply and demand
past meteor
deep sleet
wdym by splitting and cross validating
So you have 100 % of all your data:
You split off say 30 % for testing.
You have 70 % of your data left. You want to find good hyperparameters (let's say these are the settings/configuration of your model). You can only evaluate this on unseen data. The trick is cross validation. We do this:
- We take our 70 % and split off 1/5th.
- We train a model on 4/5th, we evaluate it on the remaining 1/5th
- We then split off the next 1/5th
- We train a model on 4/5th, we evaluate it on the remaining 1/5th
- we do this procedure exactly 5 times (5-fold cross validation)
- We take the average of all the errors on the folds => this is the error for our model.
The advantage is that we've trained on all data and evaluated on all data. It was reasonably fair because all folds were, at some point, unseen to the model.
The trick is, we need to do this for all the different hyperparameters we want to try. So if you want to try a max-depth of 1, 2, 3, .... you're training 5 models for each. Which means, if you're trying 10 configurations you're training 50 models.
Luckily you do not need to implement any of this yourself, https://scikit-learn.org/stable/modules/generated/sklearn.model_selection.cross_val_score.html exists in sklearn. It does this entire procedure for you in one go.
When you're done you pick the very best configuration and you train it on the full 70 %. Afterwards you use this model to make a prediction of the remaining 30 %.
This is the canonical schematic of this idea
 wooden sail
brave sand
wait why cant i use np.polyfit with degree 1? is that not an assumption i can do...
wooden sail
brave sand
wait why cant i use np.polyfit with degree 1? is that not an assumption i can do...
that's exactly the same thing
past meteor
brave sand
wooden sail
that's exactly the same thing
so I did it, is this correct?
import pandas as pd
import matplotlib.pyplot as plt
import numpy as np

df = pd.read_csv('data.csv')

# extract the arrival_kg and market price (min_rs_per_kg)
arrival_kg = df.iloc[:, 10]
min_rs_per_kg = df.iloc[:, 7]

# create a scatter plot
plt.figure(figsize=(10, 6))
plt.scatter(arrival_kg, min_rs_per_kg, alpha=0.5)
plt.title('Arrival KG vs Market Price')
plt.xlabel('Arrival KG')
plt.ylabel('Market Price (min_rs_per_kg)')
plt.grid(True)
# plt.show()

# correlate the data
# correlation = np.correlate(arrival_kg, min_rs_per_kg, mode = 'valid')
# print(correlation)

# find the function of best fit
p = np.polyfit(arrival_kg, min_rs_per_kg, 1)
print(p)

slope, intercept = p
x_fit = np.linspace(arrival_kg.min(), arrival_kg.max(), 100)
y_fit = slope * x_fit + intercept

plt.plot(x_fit, y_fit, color='red', label='Linear Fit')

plt.legend()

plt.show()```test it and see
past meteor
brave sand
wait why cant i use np.polyfit with degree 1? is that not an assumption i can do...
scikit just gives you some extra utilities
wooden sail
take the coefficients, evaluate the poly at the values of x, and see what y values you get
plot it with the data and see how well they agree
deep sleet
past meteor
So you have 100 % of all your data:
You split off say 30 % for testing.
You ha...
ohhhh
past meteor
such as amodel.predict method
deep sleet
that makes sense
brave sand
 deep sleet
took me a few reads xd
past meteor
deep sleet
took me a few reads xd
It took me longer than I feel comfortable admitting to understand that as well for the first time
Now, sci-kit learn can automate the entire procedure I mentioned
brave sand
it looks pretty good?
past meteor
scikit-learn
Gallery examples: Release Highlights for scikit-learn 1.4 Release Highlights for scikit-learn 0.24 Feature agglomeration vs. univariate selection Shrinkage covariance estimation: LedoitWolf vs OAS ...
brave sand
is linearity something i can assume?
wooden sail
the police won't show up at your doorstep
wooden sail
it's almost always the wrong assumption, but you can assume it if you're ok with the errors it brings
wooden sail
brave sand
how do I know it wont work better if it was quadratic
you don't unless you test
deep sleet
past meteor
https://scikit-learn.org/stable/modules/generated/sklearn.model_selection.GridSe...
Yeah will give it a read
past meteor
deep sleet
took me a few reads xd
This does all you need, it runs a bunch of configurations of the model, calculates the error and at the very end it gives you the best one
wooden sail
brave sand
alright
in fact, this is a very difficult problem called "model order estimation" and it is a separate field of study entirely of its own
deep sleet
Tysm man!
past meteor
Actually, if you want to get into ML I actually just recommend reading the entire sklearn user guide haha
wooden sail
you can read about e.g. the akaike information criterion or many others that came after it, and use that to determine the degree of your poly
past meteor
It might be a hard read, but you'll learn so so much
brave sand
wooden sail
in fact, this is a very difficult problem called "model order estimation" and it...
oh really
that's pretty cool actually
deep sleet
past meteor
Actually, if you want to get into ML I actually just recommend reading the entir...
Yeah it's much more detailed compared to tutorials xd
past meteor
brave sand
how do I know it wont work better if it was quadratic
My take is that you should subtract the predictions from the actual values which ggives you the error (also known as the residual)
and you should plot this quantity with respect to your predictor
brave sand
past meteor
and you should plot this quantity with respect to your predictor
can you explain this?
past meteor
If you do not see any "structure" in this plot then a linear (or whatever function you chose) is adequate
past meteor
brave sand
can you explain this?
sns.scatterplot(arrival_kg, residual)
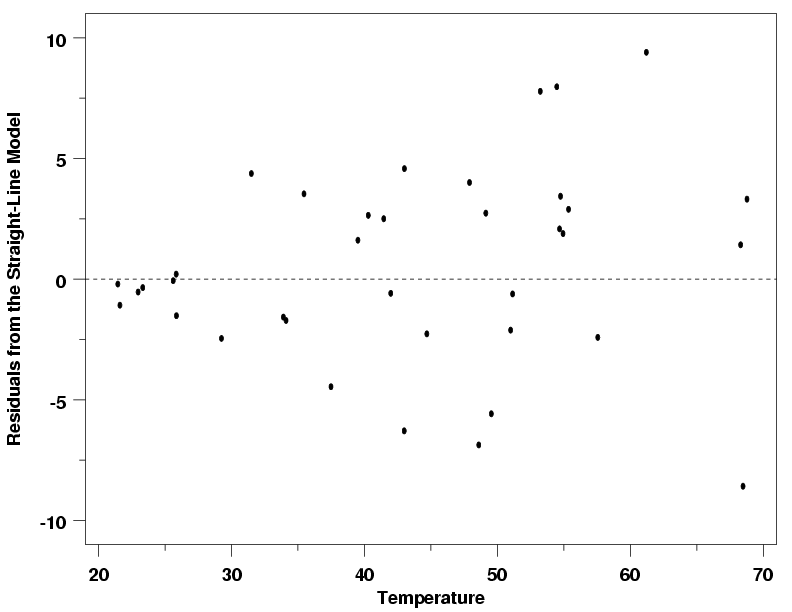
Statistics How To
A residual plot has the Residuas on the vertical axis; the horizontal axis displays the independent variable. Definition, video of examples.
I can't explain it better than this link can 😄
past meteor
to use big words "no heteroskedasticity => big big problem"
If your residuals look funky like this (this is what I mean with structure in the residuals) you're missing some non-linear transform
 deep sleet
so gradient search
does something in the same sense if what I was doing with my for loop
but measures it with cross validation for several parameters and is much more efficient
past meteor
in a more principled manner, it's doing cross validation to ensure it's not just chance the parameter you chose is the best one + it's doing it on the training set (so you're not overfitting)
deep sleet
past meteor
in a more principled manner, it's doing cross validation to ensure it's not jus...
ah
past meteor
For random forest there's also cost complexity tuning you could do, it'll remove overfitting nicely
deep sleet
this might be dumb tho but from what I read you are still one who tells it which parameters to test by providing a grid
so it's still a process of trial and error?
deep sleet
past meteor
For random forest there's also cost complexity tuning you could do, it'll remove...
I didn't learn random forests yet but thx will copy this for later
past meteor
I don't really ever do it though, I typically hyperparameter search multiple models and I'm too lazy to write specific code for RF
past meteor
deep sleet
this might be dumb tho but from what I read you are still one who tells it which...
yeah, you need to specify a grid
And it'll just enumerate all options like nested loops
So you do this hyperparams = {"random_forest__max_depth": np.linspace(1, 10)}
Note that if you're tuning many parameters it will take ages
deep sleet
Understandable
past meteor
But I'm not going to overload you with more info. Now you just have a single one to tune. You can ping me when you want tips for tuning several 😄
deep sleet
past meteor
But I'm not going to overload you with more info. Now you just have a single one...
Tysm again man for the help
for sure!
brave sand
@past meteor
what does it mean that the p value is super small for data?
PearsonRResult(statistic=-0.5499239002647799, pvalue=5.141675416029719e-34)
past meteor
brave sand
what does it mean that the p value is super small for data?
this is one you're gonna have to google 😄
 void ridge
Now suppose that you try to implement your attack on a model trained by your friend Alice. However, she has heard that people are creating adversarial examples, so she created her own AliceNet, which she claims is robust to such adversarial interventions. Can you prove her wrong?

Alice has implemented a defense mechanism in her neural network model to protect against adversarial attacks. Of course, she won't tell you what her defense is! Your task is to develop an adaptive attack that successfully circumvents this defense. Note: this task may be significantly more challenging than the previous ones :slight_smile:

Task Requirements
Understand the Defense: Analyze Alice's model to understand the type of defense implemented. This could involve reviewing the model architecture, preprocessing steps, or any additional mechanisms employed for defense.

Design an Adaptive Attack: Develop an attack strategy that goes around Alice's defense. This might involve modifying standard attack methods like PGD.

Generate Adversarial Examples: Modify all test images from the CIFAR-10 dataset using your adversarial attack. You are allowed to modify the original test images within an  ℓ∞  ball of radius  8/255 .

Test Model Accuracy: Evaluate the accuracy of AliceNet on these adversarially modified images.

Deliverables
Python code used for your attack and generation of the adversarial CIFAR-10 test set.
A short (up to a few paragraphs) report detailing your analysis of the defense, the approach used for the adaptive attack, and the success rate of your attack on the CIFAR-10 test set.
Credit for this task will be assigned analogously to Task 2.

Hint: This paper might be a good starting point.```Im not really sure where to start any help is appreciated
they also provided this code^
unkempt apex
    ^^^^^^^^^^^^^^^^^^^^^^^^^^^^^^^^^^^^^^^^^^^
ValueError: too many values to unpack (expected 5)
what is this now?
import torch
import random
from collections import deque
import numpy as np
import pickle


class ReplayBuffer():
    def __init__(self):
        self.buffer_size = int(1e6)
        self.batch_size =  32
        self.buffer = deque(maxlen=self.buffer_size)

    def __len__(self):
        return len(self.buffer)

    def append(self, experience):
        self.buffer.append(experience)

    def sample_batch(self):
        batch = random.sample(self.buffer, self.batch_size)

        states, actions, rewards, next_states, done = zip(*batch)
        states = np.array(states, dtype=np.float32)
        actions = np.array(actions, dtype=np.int64)
        rewards = np.array(rewards, dtype=np.float32)
        next_states = np.array(next_states, dtype=np.float32)
        dones = np.array(done, dtype=np.float32)

        states = torch.tensor(states, dtype=torch.float32)
        actions = torch.tensor(actions, dtype=torch.int64)
        rewards = torch.tensor(rewards, dtype=torch.float32)
        next_states = torch.tensor(next_states, dtype=torch.float32)
        dones = torch.tensor(done, dtype=torch.float32)

        return states, actions, rewards, next_states, dones

    def save_buffer(self, filepath = "buffer.pkl"):
        with open(filepath, 'wb') as f:
            pickle.dump(list(self.buffer), f)

    def load_buffer(self, filepath = "buffer.pkl"):
        with open(filepath, 'rb') as f:
            self.buffer = deque(pickle.load(f))
I am creating this properly or not?
 tulip wind

YouTube
What's up, Data Nerds! I'm Luke, a data analyst who is exploring how to use AI for analysis.
❓ If you have a question, just drop a comment in any video.
📩 Email is for business inquiries only, please.

 slender gust
Can anyone recommend a good public repo (or three) of a data science / ML / AI project I can read through? I'm not looking for implementation of ML algorithms (such as the sklearn repo) so much as applications of them. The more production-oriented, the better. thx 🙂
lapis sequoia
Is 4chan sentiment analysis a bad idea?
 dusty valve
lapis sequoia
Is 4chan sentiment analysis a bad idea?
dusty valve
lapis sequoia
Is 4chan sentiment analysis a bad idea?
why would it be
Its sentiment analysis
tulip wind
natural language processing?
like for ML
Kaggle is the world’s largest data science community with powerful tools and resources to help you achieve your data science goals.
brave sand
will removing outliers in datasets remove the one in mine?
 narrow tiger
how should someone who is good at programming(python, Js, blockchian stuff) approach machine learning to get grasp as fast as possible
the book and yt i see focus more on coding then ml concepts
left tartan
narrow tiger
how should someone who is good at programming(python, Js, blockchian stuff) appr...
So you're looking for resources that focus on theory and concepts?
Is there a particular topic you want to start with? It's a wide field.
narrow tiger
not too much theory though i found those too, and it goes over my head 😆
hmm let me think
i want to start with training basic models / and knowing y one model is better then other for some tasks
and to create agents (like mold the llm models for spcific tasks)
should i also look at job market and focus in that area too?
left tartan
narrow tiger
i want to start with training basic models / and knowing y one model is better t...
That's mostly applied stuff: how to use particular libraries. But, knowing when to use which model would require some theory.
Or at least more than how to's
narrow tiger
so where would u suggest i get started
i am reading this
Aurelien-Geron-Hands-On-Machine-Learning-with-Scikit-Learn-Keras-and-Tensorflow_-Concepts-Tools-and-Techniques-to-Build-Intelligent-Systems-OReilly-Media-2019
left tartan
I think you gain that intuition from practice, tackling concrete problems like Kaggle.com challenges
narrow tiger
that is exactly what i needed, thats how i learned coding, by doing challenges
left tartan
narrow tiger
should i also look at job market and focus in that area too?
If you're trying to optimize, I'd say it's probably a fools errand: you can't possibly guess at what skills particular employers will want. Having a broad portfolio of projects is useful -not- for the resume entries, but because it'll give you well rounded knowledge (which will help you in an interview)

 left tartan
You don't have to do the actual challenge, there's many archived ones and all sorts of projects
The cool part is also studying what techniques people used
narrow tiger
left tartan
If you're trying to optimize, I'd say it's probably a fools errand: you can't po...
bro i am already a little too well rounded
since 2022
i have done python based bots, api creations , trading bots, smart contracts, Js frameworks
i was just enjoying lol and doing whatever peaked my intrest
narrow tiger
left tartan
You don't have to do the actual challenge, there's many archived ones and all so...
no like are there any challenges like i did hangman in python to get started and doing some leetcode stuff
rich moth
This is the best I've gotten it to work so far. Its finally making sense. ```Generated Caption: What's in the image? Image 6: Image 7:
Image 8: Images 9 and 10:
The image above was taken at the end of the day, but I'm not sure how long it took me to get there. I think it was about 10 minutes. It's not like I was going to be able to do it all at once, so I'll have to wait and see what happens.
Feature shape: torch.Size([768]), Input IDs: torch.Size([1, 9])
Generated Caption: What's in the image? Image 7: Image 8:
Image 9: Images 10:
The image above was taken on the day of the attack. It shows what appears to be a man in a white shirt and a black hooded sweatshirt. The man is wearing a T-shirt with the word "ISIS" written on it, and his face is covered in blood. There is no sign of a
Feature shape: torch.Size([768]), Input IDs: torch.Size([1, 9])
Generated Caption: What's in the image? Image 8:
Image 9: Image 10: Images 11:
This is the first time I've ever seen an image of an animal. I'm not sure what it is, but I can tell you that it looks like an elephant. Image 12:
Feature shape: torch.Size([768]), Input IDs: torch.Size([1, 9])
Generated Caption: What's in the image? Image 9:```
left tartan
narrow tiger
no like are there any challenges like i did hangman in python to get started and...
I'm not sure there's any ml/ai ones, I've seen some data challenges but not ml ones
Kaggle probably your best bet tho. Study past challenges? Etc
narrow tiger
alr i'll try to study them but not sure if they'll make any sense to a new-bie
thanks
mild dirge
narrow tiger
i am reading this
```Aurelien-Geron-Hands-On-Machine-Learning-with-Scikit-Learn...
Hands on approach will allow you to implement machine learning models, but not really understand them. It depends on if you simply want to implement existing models or existing architectures, or understand how to create an architecture yourself.
Especially a lot of the videos on yt about how to create a model with TF/pytorch or w/e just tell you how to code it, without explaining the lower level stuff.
narrow tiger
mild dirge
Hands on approach will allow you to implement machine learning models, but not r...
yes i am at chapter 3 and that's exactly what it is doing, I mean if it is just implementing anyone can do
narrow tiger
mild dirge
Especially a lot of the videos on yt about how to create a model with TF/pytorch...
how low should i go?
mild dirge
However far you want to go, you don't need all the nity and grity for the most part.
90% you can do with very surface level knowledge.
narrow tiger
that's what i keep hearing i don't have to "KNOW" how it works i should just be able to it
mild dirge
I studied AI so I get most of my basics from my study, but to better understand it I mostly read books on probability theory and statistics specific for AI.
That will also teach a bit about the notation that is used in papers, that will help you to understand the papers on more recent model architectures.
But it's a big investment for that last 10%, so think about whether you even want to do that.
lapis sequoia
dusty valve
why would it be
Thank you
rich moth
i think this VQ-VAE with manifold autoencoder could be huge in image and video compression. Instead of storing raw data like jpegs, you can represent the images in discrete latent codes, reducing storage while maintaining quality. If the model can adaptively learn this method of storage, it seems like the next step in compression.
 deep sleet
mild dirge
I studied AI so I get most of my basics from my study, but to better understand ...
deep sleet
mild dirge
I studied AI so I get most of my basics from my study, but to better understand ...
Can you recommend some of these books? I want to understand Ml models on a deeper level and most tutorials as you mentioned don't dive into it deeply
 topaz stirrup
Im trying to make a reinforecement learning algorithm, but i dont understand how rewards work... like what do i use as
serene scaffold
topaz stirrup
Im trying to make a reinforecement learning algorithm, but i dont understand how...
it's like a video game, and your model is trying to get the high score.
what is the model supposed to do?
topaz stirrup
Balance an upside down pendulum
topaz stirrup
serene scaffold
it's like a video game, and your model is trying to get the high score.
What do ppl mean by a reward and punishement...? Ai has no feelings or sadness variables lol
serene scaffold
topaz stirrup
What do ppl mean by a reward and punishement...? Ai has no feelings or sadness v...
when you implement a reinforcement learning algorithm, you're producing an agent that receives inputs from its environment and interacts with that environment. you could use reinforcement learning to train a self-driving car, where the inputs are its destination and the data from its sensors, and it interacts with the environment by moving and deciding when to speed up or slow down or hit a pedestrian.
make sense so far?
topaz stirrup
Yea
How does the agent tune the network parameters
Pls take the inverted pendulum as the example, cuz self driving car seems easier
serene scaffold
topaz stirrup
How does the agent tune the network parameters
the network parameters are part of the agent. it doesn't interact with them.
you're saying that you do not want to use the inverted pendulum example?
topaz stirrup
I do want to use it as the example
serene scaffold
okay, well I don't really understand that example. I don't know what the agent or the environment is, in that context.
topaz stirrup
Cuz the agent needs to make the result worse in order to get momentum for the pendulum to go, wich in turn yields the wanted result
topaz stirrup
serene scaffold
okay, well I don't really understand that example. I don't know what the agent o...
Imagine balancing a long broom on ur finger. And u are the agent trying to balance it (2d)
U get the angle, angular velocity, angular acceleration
rich moth
I think I finally got this. Its exciting!! You should see my generate_captions def. It was insane amount of work to get it working this good


appreciate you guys
serene scaffold
@topaz stirrup regardless, the agent has a "score". and the reward is when you add points to the score. so you might give it more reward points the closer it gets to balancing the pendulum.
the agent is supposed to learn what sequence of actions maximizes the score.
topaz stirrup
serene scaffold
<@451744736030490635> regardless, the agent has a "score". and the reward is whe...
K thx, ima get some sleep and see if i can deal with it tmrw, gn.
deep sleet
so is weakest link pruning in decision trees based on RL in some sense?
serene scaffold
deep sleet
so is weakest link pruning in decision trees based on RL in some sense?
What does RL stand for in this context?
deep sleet
reinforcement learning
serene scaffold
No.
deep sleet
oh okay I thought since it puts a penalty for the number of leaves it would be kinda similar
Thx boss!
just a random thought xd
 fiery stump
hey question:
does this simple image recognition ai count as an ai?
(python 3.8 and forward will work with it)
agile cobalt
by a strict definition of AI? sure, it is a computer doing something "intelligent"
by what people typically are thinking about when they talk about AI? not really, to begin I don't think it can be considered machine learning
fiery stump
so it is, but it also isn't?
agile cobalt
I mean, some extremists would go as far as considering a single if statement AI
fiery stump
lmao
agile cobalt

Stack Overflow
So I'm making a TicTacToe "AI" and the code itself doesn't have any deep learning implications such as Tensor flow in min-max algorithms. The code simply consists of a jumble of if/else statements....
fiery stump
but seriously, what would i need to add to make it an ACTUAL ai?
agile cobalt
I would not go as far as saying "actual" AI, but you might want to look into image classification and things like ImageNet
fiery stump
the way i've seen other people and programming youtubers do ai is to give it not just an image, but an image AND what the image is supposed to represent
fiery stump
35 minutes and zero activity in this channel whatsoever
spring field
agile cobalt
I mean, some extremists would go as far as considering a single `if` statement A...
I mean, it do be a decision tree
apparently decision trees can also be machine learned though those are a bit different from simple conditionals
 worn estuary
Hello everyone
country description designation points price province region_1 region_2 taster_name taster_twitter_handle title variety winery
1 Portugal This is ripe and fruity, a wine that is smooth... Avidagos 87 15.0 Douro NaN NaN Roger Voss @vossroger Quinta dos Avidagos 2011 Avidagos Red (Douro) Portuguese Red Quinta dos Avidagos
2 US Tart and snappy, the flavors of lime flesh and... NaN 87 14.0 Oregon Willamette Valley Willamette Valley Paul Gregutt @paulgwine Rainstorm 2013 Pinot Gris (Willamette Valley) Pinot Gris Rainstorm
3 US Pineapple rind, lemon pith and orange blossom ... Reserve Late Harvest 87 13.0 Michigan Lake Michigan Shore NaN Alexander Peartree NaN St. Julian 2013 Reserve Late Harvest Riesling ... Riesling St. Julian
4 US Much like the regular bottling from 2012, this... Vintner's Reserve Wild Child Block 87 65.0 Oregon Willamette Valley Willamette Valley Paul Gregutt @paulgwine Sweet Cheeks 2012 Vintner's Reserve Wild Child... Pinot Noir Sweet Cheeks
5 Spain Blackberry and raspberry aromas show a typical... Ars In Vitro 87 15.0 Northern Spain Navarra NaN Michael Schachner @wineschach Tandem 2011 Ars In Vitro Tempranillo-Merlot (N... Tempranillo-Merlot Tandem
spring field
fiery stump
the way i've seen other people and programming youtubers do ai is to give it not...
wdym "what the image is supposed to represent"? like text that describes it or just a classification label?
worn estuary
What combination of countries and varieties are most common? Create a Series whose index is a MultiIndexof {country, variety} pairs. For example, a pinot noir produced in the US should map to {"US", "Pinot Noir"}. Sort the values in the Series in descending order based on wine count.
fiery stump
spring field
wdym "what the image is supposed to represent"? like text that describes it or j...
a classification label, i.e. a picture of the number 5 accompanied by a label saying it is a 5.
worn estuary
worn estuary
What combination of countries and varieties are most common? Create a Series who...
Please someone help i stuck here
spring field
fiery stump
a classification label, i.e. a picture of the number 5 accompanied by a label sa...
ah, right, so just image classification
fiery stump
yep.
worn estuary
What combination of countries and varieties are most common? Create a Series whose index is a MultiIndexof {country, variety} pairs. For example, a pinot noir produced in the US should map to {"US", "Pinot Noir"}. Sort the values in the Series in descending order based on wine count.
please someone tell me how to proceed
worn estuary
worn estuary
What combination of countries and varieties are most common? Create a Series who...
...
past meteor
spring field
I mean, it do be a decision tree
apparently decision trees can also be machine l...
the distinction is that AI can "autonomously" make decisions. If/else is not autonomous decision making, you code it yourself 🙂
If you use if/else to make an autonomous decision making system that uses say BFS/DFS then it is AI
spring field
they were once considered AI, just like expert systems (or are those exactly what expert systems were?)
past meteor
conditionals or decision trees?
spring field
yeah
past meteor
which one haha?
spring field
ah, lol, conditionals?
past meteor
decision trees are still 100 % AI and so are expert systems
spring field
oh
past meteor
Doing DFS to solve pacman is also still AI but it's "just" graph search
spring field
I understand pathfinding and steering behaviours are also technically AI
past meteor
exactly
spring field
wait, but aren't conditionals basically like decision trees?
past meteor
There is a tendency to relegate everything that isn't fancy / state of the art to "not AI" but imo that's for laymen and not for folks like us 😄
past meteor
spring field
wait, but aren't conditionals basically like decision trees?
good question, the difference is that the algorithm found the conditionals on the data so it is autonomous in that sense
spring field
I see