#data-science-and-ml
1 messages · Page 79 of 1
 mild dirge
 latent remnant
i should run this?
 jaunty falcon
hi
 left tartan
latent remnant
i should run this?
left tartan
latent remnant
i should run this?
Seems like all you want is: ```py
from io import StringIO
import pandas as pd
s = StringIO("""Team,Player,Tournament,Matches,Batting Innings,Not Out,Runds Scored,Highest Score,Batting Average,Balls Faced,Batting Strike Rate,100,50,0,4s,6s,Bowling Innings,Overs Bowled,Maidens Bowled,Runs Conceded,Wickets Taken,Best Bowling Figures,Bowling Average,Bowling Economy Rate,Bowling Strike Rate,4+ Innings Wickets,5+ Innings Wickets,Catches Taken,Stumpings Made
Delhi Daredevils,CH Morris,IPL 2016,12,7,4,195,82*,65,109,178.89,0,1,1,15,12,12,44,0,308,13,Feb-30,23.69,7,20.3,0,0,8,0""")
data = pd.read_csv(s)
team_2019 = data[data["Tournament"] == "IPL 2019"]
team_2019_newdf = team_2019[["Player", "Team", "Matches", "Batting Average", "Batting Strike Rate", "Bowling Innings", "Bowling Average", "Bowling Economy Rate"]]
team_2019_newdf.to_csv("newfile.csv")
yes yes, these columns are the ones which i need. but how do i add the data?
left tartan
Change the "s" in the read_csv to your file name
The problem with your original code was you had brackets around the series... ```py
d = {
"Player" : player_2019,
"Team" : player_2019,
"Batting Innings" : player_batting_innnings,
"Batting Average" : player_batting_avg,
"Batting Strike Rate" : player_strikerate,
"Bowling Innings" : player_bowling_innings,
"Bowling Averagw" : player_bowling_average,
"Bowling Economy Rate" : player_bowling_eco
}
aighttttt
latent remnant
left tartan
The problem with your original code was you had brackets around the series... ``...
the course which taught me, said to use dictionary to create the new csv file
latent remnant
left tartan
The problem with your original code was you had brackets around the series... ``...
ohh i see the difference
left tartan
also, in jupyter, use "display(df)" instead of "print(df)", it'll look nicer.
latent remnant
left tartan
also, in jupyter, use "display(df)" instead of "print(df)", it'll look nicer.
okk
can i ask what stringIO does?
left tartan
it lets me treat a string like a file/io object
latent remnant
left tartan
it lets me treat a string like a file/io object
greatt, thank you soo much brother!, i was stuck on this for the past two days.
also, can you recommend some books or courses for this area of python
left tartan
latent remnant
greatt, thank you soo much brother!, i was stuck on this for the past two days.
...
For data stuff? https://www.kaggle.com/learn is pretty good
latent remnant
left tartan
For data stuff? <https://www.kaggle.com/learn> is pretty good
aight thankss
 past meteor
latent remnant
greatt, thank you soo much brother!, i was stuck on this for the past two days.
...
past meteor
latent remnant
greatt, thank you soo much brother!, i was stuck on this for the past two days.
...
Although I dislike Pandas' user guide I think it's also good to create a habit of reading the documentation of packages you use 🙂
9 times out of 10 I learn stuff by just reading their official documentation. If it's sparse, shady or something odds are that I won't touch the package
latent remnant
Thank you so much! 😊
past meteor
 compact valley
is 8gb macbook pro m1 enough for data science?
I heard that i need more ram for data..?
mild dirge
If you want to run large models, and within a certain time limit, you probably want a desktop, or just a simple laptop and use servers to run the models @compact valley
I wouldn't recommend a laptop to run any big models, but you can use services like google collab to run it on their servers
compact valley
I have a desktop with 32gb ram
my company would also pay for cloud i guess thats an option here
mild dirge
32GB is enough, and most important is gpu for most models
And cpu, but that is often not the bottleneck
past meteor
compact valley
is 8gb macbook pro m1 enough for data science?
I heard that i need more ram for ...
More than enough
My work laptop has 8GB ram
 jaunty hinge
can i get help for an ARIMA model here
past meteor
99 % of my development is through SSH. I cycle to work, I don't want to carry a GPU monstosity uphill on my bike 🙂
Also, my dev VM only had 4GB ram in the beginning until I annoyed IT enough to make it 8 and subsequently 64. I work with several tens of millions of rows of data. It's stupid but being constrained memory wise teaches you how to do things "properly"
Which matters a lot if/when you scale to terabyte size datasets
past meteor
jaunty hinge
can i get help for an ARIMA model here
shoot! 🙂
jaunty hinge
past meteor
shoot! 🙂
start=len(train)
end=len(train)+len(test)-1
pred=model.predict(start=start,end=end,typ='levels').rename('ARIMA Predictions')
pred.plot(legend=True)
test['AvgTemp'].plot(legend=True)
When I run this code I get this error
TypeError: Model.predict() missing 1 required positional argument: 'params'
idk how to fix it i need it for like an essay for my highschool
past meteor
Are you using statsmodels?
jaunty hinge
yeah
past meteor
Have you fit your model already?
 past meteor
Yeah, you've fit it 🙂 now you can do model_fit.forecast()
I assume you want do out-of-sample forecasts? (note: what people mean with out-of-sample is that you fit your model with weather data until 2023 and then you use the model to see what 2024 is like)
 finite bluff
hello every one
left tartan
I'm just adapting an example I had in a notebook already: ```py
import numpy as np
import matplotlib.pyplot as plt
from statsmodels.tsa.arima.model import ARIMA
n_points = 100
x = np.linspace(0, 20 * np.pi, n_points)
noise = np.random.normal(0, 0.5, n_points)
y = 5 * np.sin(x / 2) + noise
p, d, q = 1, 1, 1
model = ARIMA(y, order=(p, d, q))
fit_model = model.fit()
forecast_steps = 20
forecast = fit_model.get_forecast(steps=forecast_steps)
conf_int = forecast.conf_int()
plt.figure(figsize=(12, 6))
plt.plot(y, label="Data")
plt.plot(np.arange(n_points, n_points + forecast_steps), forecast.predicted_mean, color="red", label="Forecast")
plt.fill_between(np.arange(n_points, n_points + forecast_steps), conf_int[:, 0], conf_int[:, 1], color="pink", alpha=0.3)
plt.legend()
plt.show()
print(fit_model.summary())
So you have your screenshot right? Make a new cell in your notebook and then simply write model_fit.forecast()
You need to put the amount of steps you want to forecast for in the method. Otherwise it'll default to 1.
past meteor
jaunty hinge
this?
Are you familiar with the "statistics" behind ARIMA by the way, how did you pick your order parameters?
left tartan
(#data-science-and-ml message for a link to the original thread for this)
past meteor
If it's weather data I actually think you need a SARIMA model
jaunty hinge
past meteor
Are you familiar with the "statistics" behind ARIMA by the way, how did you pick...
is it like this one
 jaunty hinge
past meteor
Are you familiar with the "statistics" behind ARIMA by the way, how did you pick...
jaunty hinge
past meteor
Are you familiar with the "statistics" behind ARIMA by the way, how did you pick...
not that much
im just trying to get this math essay done for school
i hate ib
past meteor
Wild they have you doing ARIMA in high school
jaunty hinge
nah its a self thing
past meteor
That's crazy
jaunty hinge
i get to pick my topic
and i couldnt find anything for math
so i wanted to create a short term weather forecast
and it led me here
past meteor
What's your "window"? How many days are you considering?
jaunty hinge
7 days
past meteor
Okay then you don't need SARIMA you still might
What's the frequency of your measurements
jaunty hinge
wdym
past meteor
Do you have a measurement every hour? Every day, every minute?
jaunty hinge
oh every day
past meteor
Just one per day?
 past meteor
I think you're just plotting your test data as-is now, no?
jaunty hinge
i think so
past meteor
When is your assignment due?
jaunty hinge
is there anyway i can show u my full code
jaunty hinge
past meteor
When is your assignment due?
6 days :/
past meteor
If you have the time I'd review basic Python and also watch some videos on AR, MA and ARIMA
jaunty hinge
i mean after i finish the model i need to write like 2500 words abt it and stuff
jaunty hinge
past meteor
If you have the time I'd review basic Python and also watch some videos on AR, M...
i did
past meteor
Maybe I'm not the best at this but there's too much for me to unpack
jaunty hinge
ive been watching this tutorial
and i had to watch like so many other tutorials in the middle to get where he was
past meteor
Basically they tell you how correlated each measurement at time n is with n-1, n-2, n-3, ...
They directly inform you what the p and q of the (so the AR and the MA) of arima should be
past meteor
In your case the I should be 0, you shouldn't detrend
jaunty hinge
i just need to like predict and show the next forecast
past meteor
Your data being stationary or not is only related to the I parameter of ARIMA
If you just want to predict then you should save the result into a new variable so predictions = model_fit.forecast(steps=7)
jaunty hinge
past meteor
If you just want to predict then you should save the result into a new variable ...
this just shows me like
the data i already have tho
finite bluff
hey guys, could I ask a question about this field?
past meteor
jaunty hinge
the data i already have tho
past meteor
finite bluff
hey guys, could I ask a question about this field?
please just ask instead of asking if you can ask 🙂
finite bluff
Oh sorry for that. I'm just curious about data science. Actually, I'm learning IT at my university and now I'm interested in data science. What things I have to learn first and what websites could help me to cover a whole range of topics in a simple way to kick off this journey :))
 odd meteor
finite bluff
Oh sorry for that. I'm just curious about data science. Actually, I'm learning I...
odd meteor
finite bluff
Oh sorry for that. I'm just curious about data science. Actually, I'm learning I...
https://Kaggle.com/learn combine that with YouTube + courses from Udemy or DataCamp or DataQuest etc (if you're interested in making a financial commitment), and you'll be well on your way
Practical data skills you can apply immediately: that's what you'll learn in these no-cost courses. They're the fastest (and most fun) way to become a data scientist or improve your current skills.
Check our pinned message for additional resource
 lapis sequoia
this book has been pretty good for getting a grasp of data science and libraries associated with it like numpy and pandas
https://jakevdp.github.io/PythonDataScienceHandbook/
left tartan
This channel really needs a sticky (pinned?)
odd meteor
left tartan
This channel really needs a sticky (pinned?)
What's a sticky? Sticker?
past meteor
!resources
 arctic wedgeBOT
Resources
The Resources page on our website contains a list of hand-selected learning resources that we regularly recommend to both beginners and experts.
past meteor
I think there was a data science specific one? idk
 misty flint
!resources data science
arctic wedgeBOT
Resources
The Resources page on our website contains a list of hand-selected learning resources that we regularly recommend to both beginners and experts.
misty flint
oh hey that worked
left tartan
odd meteor
What's a sticky? Sticker?
I mean something in the channel description. Look at discord bots for a good example.
misty flint
i remember stel did a similar command
past meteor
The data science resources there are pretty meek though
misty flint
they are. we were talking about adding also some data eng resources on there
left tartan
Yah, I have a bunch I’d like to contribute for the data science stuff
misty flint
but i kinda dropped the ball on that
oops
@serene scaffold billybobby has volunteered. let me compile something for DE/MLE
left tartan
Lol
past meteor
Excel data engineering  (I'm joking)
left tartan
No
misty flint
python in excel
left tartan
It's in a limited rollout
misty flint
rip
left tartan
so even though I have beta channel, they haven't pushed it to all beta users
misty flint
im seeing it more and more on my newsfeed
i think even fireship did a video

Microsoft Excel just added support for Python, allowing developers to code and run custom functions directly inside a spreadsheet. Let's take a first look at how Python support will work in Excel.
#python #ai #thecodereport
💬 Chat with Me on Discord
🔗 Resources
Python Excel Announcement https://techcommunity.mi...
left tartan
it's interesting... the execution is a sandboxed anaconda install that runs in amazon cloud with about 400 pre-selected packages. Can't run whatever you want, though.
misty flint
400 pre-selected packages. i dont remember if thats more or less than what comes with regular anaconda
left tartan
but, this is a good thing, when compared to the security nightmare of vba.
 left tartan
necessary evil, perhaps.
misty flint
probs
past meteor
Compiling a data engineering list is hard(er) because it can mean literally anything
misty flint
it does but we will start somewhere
past meteor
good ol' SQL fundamentals
left tartan
past meteor
Compiling a data engineering list is hard(er) because it can mean literally anyt...
I'm throwing my stuff togehter, one sec
past meteor
I think the issue with DE moreso than with DS is that it's a really tools-driven field
You can make an argument that on some level you're learning tools and not concepts
Or the old heads that reduce all of the domain to dimensional modelling and dashboards 
left tartan
I think I've got more somewhere, but here's stuff I had in Notion:
Prerequisite: Get good at Python (see resources/etc)
Overviews / Intros
https://shivaga9esh.medium.com/data-architecture-engineering-22164c8dbd43
Fundamentals Tools:
Pandas: https://pandas.pydata.org/docs/user_guide/10min.html
SQL: https://selectstarsql.com/
Analytical Databases: Snowflake, duckdb, clickhouse, etc
Introductory:
3B1B: https://www.youtube.com/c/3blue1brown
https://www.kaggle.com/learn
CS50 for AI: https://cs50.harvard.edu/ai/2023/
https://jakevdp.github.io/PythonDataScienceHandbook/
Math:
- Highlights of Calculus (Strang): https://ocw.mit.edu/courses/res-18-005-highlights-of-calculus-spring-2010/video_galleries/highlights_of_calculus/
Advanced:
- Mathematics for Machine Learning: https://mml-book.github.io/book/mml-book.pdf
- https://www.manning.com/books/deep-learning-with-pytorch
- https://scikit-learn.org/stable/user_guide.html
o and https://pythonprogramming.net/machine-learning-python-sklearn-intro/ - Fundamentals of Data Engineering: https://www.amazon.com/s?k=fundamentals+of+data+engineering

YouTube
3Blue1Brown, by Grant Sanderson, is some combination of math and entertainment, depending on your disposition. The goal is for explanations to be driven by animations and for difficult problems to be made simple with changes in perspective.
For more information, other projects, FAQs, and inquiries see the website: https://www.3blue1brown.com
Practical data skills you can apply immediately: that's what you'll learn in these no-cost courses. They're the fastest (and most fun) way to become a data scientist or improve your current skills.
misty flint
past meteor
You can make an argument that on some level you're learning tools and not concep...
thats why joe reis and matt housley offer this framework. so peeps can start thinking in concepts instead of tools since they say tools come and go:

met them in person. real cool folks 👍
and ofc the diagram is from the first chapter of FoDE. i really sound like a broken record at this point

left tartan
hey, I put fode in my list
misty flint
and thats all that matters
left tartan
I guess I should throw duckdb in my list then
past meteor
I have never heard of that book interesting
You should add a Kimball / Inmon book to the list
That's how it started for me at least 🤷
misty flint
past meteor
I have never heard of that book interesting
brand new. joe reis likes to describe it as the prequel to designing data intensive applications
misty flint
past meteor
You should add a Kimball / Inmon book to the list
data warehouse toolkit most def
past meteor
left tartan
I guess I should throw duckdb in my list then
Add polars to your list
left tartan
hmm
past meteor
At least for my work I prefer it much more than DuckDB or SQL in general. My transformations are awkward to express as SQL queries. It's unnecessary pain.
 worn stratus
misty flint
400 pre-selected packages. i dont remember if thats more or less than what comes...
worn stratus
misty flint
400 pre-selected packages. i dont remember if thats more or less than what comes...
the killer is that there's never going to be a nice way to auth against internal databases
past meteor
I'm still a big believer in the fact that people should YEET Pandas out of their data engineering stack
It's inferior in all respects compared to Polars except it integrating better with data viz and ML tools
The memory footprint being a lot smaller, better multi threading and the lazy API are just big selling points
worn stratus
past meteor
It's inferior in all respects compared to Polars except it integrating better wi...
even this is slowly going away - seaborn and Plotly both play nicely with polars
misty flint
worn stratus
the killer is that there's never going to be a nice way to auth against internal...
oh yeah that is killer
worn stratus
the main thing pandas has going for it is the first movers advantage a ridiculous amount of tooling layered on top of it
misty flint
past meteor
I'm still a big believer in the fact that people should YEET Pandas out of their...
i see it more as a dif type of workflow
if that makes sense
past meteor
Sure, it makes sense
past meteor
I still use Pandas when I'm getting very close to my "final" application
past meteor
E.g., when I'm getting close to sklearn and whatnot I use Pandas
worn stratus
I'm completely off of pandas at work at this point, which might screw me when I come to interview
past meteor
I think Spark / Databricks are (sadly) data engineering essentials
Why read a small CSV in Python when you can wait several seconds for the JVM to start!! 😉
worn stratus
past meteor
I think Spark / Databricks are (sadly) data engineering essentials
the saddest thing here is that the dataset api is great, but it's scala only. pyspark is just a bit rubbish
past meteor
I'd prefer doing Spark in Scala if not only for the fact that UDFs are a lot less painful and they don't tank your performance as much
left tartan
worn stratus
I'm completely off of pandas at work at this point, which might screw me when I ...
You'll be fine, just learn duckdb 😉
past meteor
DuckDB is just SQL, there's nothing to learn?
worn stratus
left tartan
You'll be fine, just learn duckdb 😉
it's more that the kind of roles I'll end up applying for will often have a pandas coding interview - and "trust me bro, let's just use duckdb/polars" isn't a great line
left tartan
worn stratus
it's more that the kind of roles I'll end up applying for will often have a pand...
I know, I agree 🙂
worn stratus
worn stratus
it's more that the kind of roles I'll end up applying for will often have a pand...
the response will be "OK nerd, but we have these pandas codebases"
left tartan
past meteor
DuckDB is just SQL, there's nothing to learn?
Like all things, they have a lot of tricks up their sleeves - #python-discussion message
past meteor
I don't fully understand the DuckDB hype
I get it for people that don't know Python
The people that are going for the whole DuckDB + DBT set-up
left tartan
Oh, dbt is heaven... but:
past meteor
For the rest DuckDB and Polars are quite similar in terms of capabilities. The question becomes "do you want to write SQL or have a dataframe API"
I want a dataframe API any day of the week because you get all of software's best practices for free
worn stratus
i get the duckdb hype. SQL is already the lingua franca of the data world, and it let's you avoid pandas which is basically a dsl largely separate from actual python
left tartan
the duckdb team is just cranking out features and it's just so much better than what's out there. For example: columns with regular expressions or lambdas or Python UDFs or pivot/unpivot

DuckDB
TLDR; DuckDB continues to push the boundaries of SQL syntax to both simplify queries and make more advanced analyses possible. Highlights include dynamic column selection, queries that start with the FROM clause, function chaining, and list comprehensions. We boldly go where no SQL engine has gone before! Who says that SQL should stay frozen in ...
misty flint
worn stratus
I'm completely off of pandas at work at this point, which might screw me when I ...
its okay. your next role can be in DE 
left tartan
(I'm not affiliated, but just what they've shipped in the past year is amazing)
past meteor
SQL overuse can be terrible as well
left tartan
as_of joins, positional joins, etc.
past meteor
It's declarative but when you need something that doesn't exist natively you end up tying together all of those declarative things into a procedural monster
misty flint
past meteor
SQL overuse can be terrible as well
i saw legit sql queries stored as database values this quarter
when you run the sql query in order to get more sql queries 
past meteor
misty flint
i saw legit sql queries stored as database values this quarter
doesn't surprise me hahaha
left tartan
past meteor
It's declarative but when you need something that doesn't exist natively you end...
What I end up doing is just collapsing dozens or hundreds of lines of code into a duckdb transformation... but I could use them inline:
Note the inline use of the global dataframe: ```py
import duckdb
import math
import pandas as pd
somedf = pd.DataFrame({"i": [i for i in range(22)]})
with duckdb.connect() as con:
con.create_function('factorial_method_native', lambda x: math.factorial(x), [duckdb.typing.HUGEINT], duckdb.typing.HUGEINT, type='native')
df = con.sql('select factorial_method_native(i) from somedf tbl(i)').df()
print(df)
yeah others like moyen have seen this as well
past meteor
left tartan
What I end up doing is just collapsing dozens or hundreds of lines of code into ...
Do me a favour and try Polars 😦
Writing strings in Python also just sucks
it's a hack
left tartan
past meteor
Do me a favour and try Polars 😦
Oh, I've used polars extensively.
left tartan
past meteor
Writing strings in Python also just sucks
Not trying to sell you, but there is a pythonic API if that's your cup of tea.
past meteor
I've looked at DuckDB extensively tbh. I've even "sold" it to colleagues using worse tools (laughs in R)
left tartan
but for me, I can join a polars df, with hive partitioned parquet files, with a csv file, in a single operation.
that's just black magic for me.
misty flint
left tartan
the duckdb team is just cranking out features and it's just so much better than ...
this is dope
past meteor
Went to talks ran by elite data engineering teams on DuckDB etc as well
But I just still don't see why I'd squeeze it into my current workflow
It looks inferior to my current setup, just my 2 cents
worn stratus
the main thing putting me off of duckdb is that it's kinda redundant for analysis once you're data is already in some SQL database.
why pull data from snowflake just to change the SQL flavor?
misty flint
i think it has a dif use case imo
left tartan
I mean, if you're in snowflake, you can stay in snowflake, I prob wouldn't change that.
past meteor
There's edge cases where I would use duckDB though, I think its streaming and larger-than-memory support is better than Polars
If I were really really memory constrained I'd move to DuckDB
But realistically, at that point they should hire someone else. I'm not a data engineer 😢
Everywhere I've been everyone just sucked at it so I do it, with pleasure
Otherwise the data pipeline would be csv files on teams
worn stratus
left tartan
I mean, if you're in snowflake, you can stay in snowflake, I prob wouldn't chang...
I do, but I think that's the place where polars eats DuckDB's lunch - it can do most of the ducky things, but stays relevant later in the data lifecycle . you can pull data from a database, then you can write nice composable polars transforms over the top of it
left tartan
Yah, I'd mix it in, personally... duckdb works over polars /arrow data too, so you can use either or both
misty flint
chroma, vector db, is built on top of duckdb so theres that
i need that one meme where you lift the mask and its just duckdb underneath
past meteor
I don't understand vector db's either
misty flint
so you got some embeddings right?
past meteor
I get that part
misty flint
these are lists of floating point numbers
and you need to read/write them
super duper fast
past meteor
What I don't get is why the tech is so overhyped
misty flint
current db systems suck at this
misty flint
past meteor
What I don't get is why the tech is so overhyped
oh yeah it is a bit overhyped atm
past meteor
Just serializing it normally and doing a dot product works unless you have a really really large set of embeddings
misty flint
the issue comes down to the model
past meteor
People have been doing algebraic topic modelling for ages without vector dbs
misty flint
some models generate embeddings that are only 300ish dimensions per "row" (looks at SBERT)
some are wildly large embeddings
with huge dimensions
past meteor
Just benchmark matrix vector multiplication with different sizes in numpy and then ask yourself if the hype is warranted. I have and for me it was a "no"
misty flint
i mean my work mentor built his own vector db doing just what you described
however
just look at how much money pinecone is raking in lol
there are some use cases where some stuff just doesnt scale
someone in this server was telling about it
and how they were waiting for a good vector db to come out
thats equivalent to cassandra
past meteor
This exists but it's not proportional to the vector db propaganda
misty flint
agreed
past meteor
I did a course on information retrieval in uni and I guess this is why they reminded us that the triangle inequality is a thing
There's also extensive research on approximate nearest neighbour search etc
 upper flame
@past meteor i sent u a dm
 cyan belfry
Hi 😊
new to this topic, I have a huge trading data set of about 420k rows each day
what will be the best way to find similar patterns for all the data sets I have ?
And after that of course convert it into a model
left tartan
cyan belfry
Hi 😊
new to this topic, I have a huge trading data set of about 420k rows each ...
That's a giant topic. If you want to dig in, I enjoyed this book: https://www.amazon.com/Advances-Financial-Machine-Learning-Marcos/dp/1119482089
cyan belfry
left tartan
That's a giant topic. If you want to dig in, I enjoyed this book: <https://www.a...
I want to learn only the specific things for my project, im not planning on working in that field, im pretty bad with math lol
left tartan
Maybe narrow down your question then?
cyan belfry
im not sure how 😅
I thought maybe an AI could go through the data and find something
cyan belfry
left tartan
Maybe narrow down your question then?
Can I DM u about it ?
 ashen ore
What are good laptops out there rn for performing deep learning tasks and processing other ml models
left tartan
cyan belfry
Can I DM u about it ?
I don’t dm… just ask here, someone can surely answer it
 desert oar
worn stratus
the main thing putting me off of duckdb is that it's kinda redundant for analysi...
desert oar
worn stratus
the main thing putting me off of duckdb is that it's kinda redundant for analysi...
because hitting the data warehouse every time is expensive and slow
save your 10 GB subset locally and go to town with duckdb, polars, pandas, whatever
misty flint
@serene scaffold i ended up compiling a basic list aimed towards beginners. ill send you a link to the notion doc if youre still interested in updating pydis resources
 past meteor
desert oar
because hitting the data warehouse every time is expensive and slow
past meteor
desert oar
because hitting the data warehouse every time is expensive and slow
I heard snowflake is expensive as well though isn't it?
desert oar
past meteor
I heard snowflake is expensive as well though isn't it?
it adds up because the warehouse always stays on for 1 minute minimum, so even select 1 costs 1 minute of execution time
past meteor
It really is beautiful technology though. Fully separate compute and storage. Predicate pushdown. S3-like files with a SQL interface that make it act like a RDBMS, ...
I'm wary of doing R&D in the cloud though
past meteor
desert oar
it adds up because the warehouse always stays on for 1 minute minimum, so even `...
Does it have a cold start if the cluster is off?
upper flame
Hey can someone assist me with a code pls. it's rlly URGENT. For volunteers ping me or dm
 slim bone
I'm trying to understand the point of max-pooling, at least on an intuitive level.
The book I'm reading is trying to explain this but I can't understand the explanation at all, thus I can't really formulate a concrete question besides "Why do we actually use max-pooling?"
For the sake of clarity: I know what it does, just not why it's used.
Thanks in advance
Edit: Trying to research this a little further - and it seems like there's no definitive answer. Am I digging too much into things? Because indeed, most of my learning experience with a lot of subjects related to ML could sort of be summed up with "X works, because someone thought X could work, so they implemented X into some models and noticed an improvement"
So perhaps there's a meta question here: Should I even bother trying to understand some of these concepts?
I've attached the explanation I'm having trouble with

 pallid badge
Would this be the correct subchannel to discuss hdf5 files?
 serene scaffold
misty flint
<@253696366952316929> i ended up compiling a basic list aimed towards beginners....
serene scaffold
misty flint
<@253696366952316929> i ended up compiling a basic list aimed towards beginners....
I'm on vacation and that's why I haven't been responding. Let's chat next week
misty flint
serene scaffold
I'm on vacation and that's why I haven't been responding. Let's chat next week
stel enjoy your time off. dont mind me bud and sounds good 
 twin forge
def OHLCV(list_tickers, start, end):
    ohlcv = {}

    for t in list_tickers:
        try:
            data = yf.download(t, start=start, end=end, interval="1d", repair=True).dropna()
            if not data.empty:
                ohlcv[t] = data
        except:
            pass
    return ohlcv```

Hey guys I'm working with a big ticker sample that includes delisted stocks but as you can see there's tons of price data series behaving incorrectly.

How can I identify these bad time series data so that I can remove them from my analysis?

I'm thinking something along the lines of "based on how the other prices reacted during time interval, remove these tickers from ohlcv"
 verbal venture
Can someone help me with this code: ```py
def initialize_model(N,V, random_seed=1):
'''
Inputs:
N: dimension of hidden vector
V: dimension of vocabulary
random_seed: random seed for consistent results in the unit tests
Outputs:
W1, W2, b1, b2: initialized weights and biases
'''
### START CODE HERE (Replace instances of 'None' with your code) ###
np.random.seed(random_seed)
# W1 has shape (N,V)
W1 = np.random.randn(N, V)

# W2 has shape (V,N)
W2 = np.random.randn(V, N)

# b1 has shape (N,1)
b1 = np.zeros((N, 1))

# b2 has shape (V,1)
b2 = np.zeros((V, 1))

### END CODE HERE ###
return W1, W2, b1, b2```
I guess you'd have to look at the data to see what's going on. Are there a bunch of zero points in between? Are these after trading hours blips? In short: look at the data to see what the issue is
twin forge
left tartan
I guess you'd have to look at the data to see what's going on. Are there a bunch...
the thing is my sample size is over 300 stocks so checking individually would take me a whole day
could I simply .apply() something?
maybe for example: if stock volume is under x don't add it to ohlcv_dict?
 slim flicker
serene scaffold
verbal venture
Can someone help me with this code: ```py
def initialize_model(N,V, random_seed=...
slim flicker
serene scaffold
verbal venture
Can someone help me with this code: ```py
def initialize_model(N,V, random_seed=...
Help in what way?
verbal venture
it's not passing tests
serene scaffold
@slim flicker see #voice-verification
serene scaffold
verbal venture
it's not passing tests
What tests...
verbal venture
Wrong initialization for b2 vector. Check the use of the random seed.
Expected: [[0.77951459]
[0.02293309]
[0.57766286]
[0.00164217]
[0.51547261]]
Got: [[0.]
[0.]
[0.]
[0.]
[0.]].
24 Tests passed
12 Tests failed
I don't know what I could change about the func. I did torch.randn and regular np.zeros() but got the same test output
serene scaffold
verbal venture
Wrong initialization for b2 vector. Check the use of the random seed.
Expec...
When you ask for help, this is the kind of information you should give in the first message for your question.
Look at how you define b2
verbal venture
ah
left tartan
twin forge
the thing is my sample size is over 300 stocks so checking individually would ta...
You first need to inspect the data to understand what the problem is. You’re asking for the medicine without a diagnosis.
verbal venture
serene scaffold
When you ask for help, this is the kind of information you should give in the fi...
you're saying don't ue np.zeros yeah?
I got the same output
serene scaffold
verbal venture
I got the same output
Show
verbal venture
change b1 & b2 to randn
left tartan
twin forge
the thing is my sample size is over 300 stocks so checking individually would ta...
Perhaps you have spurious zeros, or perhaps gaps in data that’s been filled incorrectly, or perhaps your charting code is rendering gaps as zeros, or perhaps you’ve made a mistake and group disparate series under the same ticker, etc
verbal venture
Wrong initialization for b2 vector. Check the use of the random seed.
Expected: [[0.77951459]
[0.02293309]
[0.57766286]
[0.00164217]
[0.51547261]]
Got: [[-0.10106761]
[-0.05230815]
[ 0.24921766]
[ 0.19766009]
[ 1.33484857]].
serene scaffold
@verbal venture the n in randn stands for normal. It does something different than the general purpose random array generator
verbal venture
ah ok, how long have you been doing AI for
serene scaffold
verbal venture
ah ok, how long have you been doing AI for
A few years
verbal venture
all NLP?
serene scaffold
Pretty much
verbal venture
figured
can you help with this as well? ```py
def back_prop(x, yhat, y, h, W1, W2, b1, b2, batch_size):
'''
Inputs:
x: average one hot vector for the context
yhat: prediction (estimate of y)
y: target vector
h: hidden vector (see eq. 1)
W1, W2, b1, b2: matrices and biases
batch_size: batch size
Outputs:
grad_W1, grad_W2, grad_b1, grad_b2: gradients of matrices and biases
'''
# Compute z1 as "W1⋅x + b1"
z1 = np.dot(W1, x) + b1

### START CODE HERE (Replace instanes of 'None' with your code) ###

# Compute l1 as W2^T (Yhat - Y)
l1 = (yhat - y)

# if z1 < 0, then l1 = 0
# otherwise l1 = l1
# (this is already implemented for you)

l1[z1 < 0] = 0 # use "l1" to compute gradients below

# compute the gradient for W1
grad_W1 = np.dot(l1, x.T) / batch_size

# Compute gradient of W2
grad_W2 = np.dot(l1, h.T) / batch_size

# compute gradient for b1
grad_b1 = np.sum(l1, axis=1, keepdims=True) / batch_size

# compute gradient for b2
grad_b2 = np.sum(yhat - y, axis=1, keepdims=True) / batch_size
### END CODE HERE ###

return grad_W1, grad_W2, grad_b1, grad_b2
error is: boolean index did not match indexed array along dimension 0; dimension is 5778 but corresponding boolean dimension is 50
 orchid sky
!resources ai
arctic wedgeBOT
Resources
The Resources page on our website contains a list of hand-selected learning resources that we regularly recommend to both beginners and experts.
 twilit tundra
slim bone
I'm trying to understand the point of max-pooling, at least on an intuitive leve...
twilit tundra
slim bone
I'm trying to understand the point of max-pooling, at least on an intuitive leve...
Why pooling? Because it's helpful to scale CNNs.
Why maxpooling? It introduces nonlinearity and the intuition is pretty natural: you're letting a group of neurons fire if at least one of them fires.
It also makes the whole computation more robust (for example if you detect an object only on one corner of your pooling box, the signal still carries over when it would have been 'obfuscated' by an avg pooling)
twilit tundra
There are alternatives (most notably using a convolutional layer with stride 2 https://arxiv.org/pdf/1412.6806.pdf) but it didn't really improve the performances of visual models, so it's not popular outside of academics
slim bone
It all feels so... "handwavy" I think is the terminology in English
When I thought about it further I managed to conjure up some random explanation where "The most dominant pixels on the feature map are carried over, and thus it's perhaps easier to concentrate on the relevant features of the image" but honestly it seems like any effort at trying to explain this phenomena on an intuitive level without the appropriate background is futile
 wooden sail
slim bone
When I thought about it further I managed to conjure up some random explanation ...
wooden sail
slim bone
When I thought about it further I managed to conjure up some random explanation ...
i think this might be a nice read for you https://www.di.ens.fr/willow/pdfs/icml2010b.pdf
at the end of the day, max pooling is a heuristic. it doesn't always work nor make sense. the paper i linked explores the regime in which max pooling is beneficial. keep in mind downsampling is a common operation in signal processing that can be justified in many ways, e.g. the spectrum of the data is relatively low frequency, allowing downsampling without loss of information, or the data admitting a sparse representation in some domain. max pooling is one choice of irregular downsampling that can be beneficial depending on the properties of the data. there are also cases in which you do lose information by downsampling, but the high frequency information benefits from using the low frequency info as a "prior" or "initial guess", where it makes sense to consider both the downsampled data and the full data at the same time (think e.g. u-nets with "skip connections". but yeah, it doesn't always make sense and there is also no guarantee of optimality for it in general
but as you correctly point out, someone tried stuff and this worked in many cases 😛 people looked for explanations and interpretations after
 shadow viper
helo everyone
how can you check for top 5 states with top 10 most demanding services each in the us?
how exactly can i get this data?
worn stratus
desert oar
because hitting the data warehouse every time is expensive and slow
for the most part, the cost is small enough to not matter for analysis. create a temp table with some level of aggregation, then it's just ~1-5s round trip times
worn stratus
worn stratus
for the most part, the cost is small enough to not matter for analysis. create a...
this is purely vs duckdb that I'm talking about
slim bone
wooden sail
i think this might be a nice read for you https://www.di.ens.fr/willow/pdfs/icml...
Thank you both for the detailed explanation
Admittedly I don't entirely understand the terminology behind "High/low frequency data" (Not sure if signal processing is necessarily even taught in my degree) but I think I got the idea of what you're trying to say, something like "Transformations of the type F^n -> F^m where m < n can still be "rich" with information and often help the computer process it" or something along those lines? ^^;
I really just wanted to hear that there isn't a single concrete explanation for this and that I'm not missing some fundamental theory. So indeed, I think you put my mind at ease
wooden sail
slim bone
Thank you both for the detailed explanation
Admittedly I don't entirely understa...
sure, that's one way of looking at it. if we have a vector in F^n and it satisfies special properties, then a projection F^n -> F^m, with m < n, is invertible. you know how functions can be invertible from the left without being overall invertible (having no right inverse)
if you wanna think about it that way, it'd be that the original signal in F^n is in a vector space of dimension d <= m
then T: F^n -> F^m can be invertible from the left if you apply it to an input that is not in the null space of T
the case of "signal frequency" is a particular choice of T where we have a unitary matrix U in F^nxn, and we construct T by keeping m columns of U and transposing. the particular U of orthogonal complex exponentials is the "fourier basis" used to look at the frequency domain of signals, but other choices are possible
slim bone
wooden sail
then T: F^n -> F^m can be invertible from the left if you apply it to an input t...
I think I sort of missed the point - Why do we care if it's invertible from the left?
My Linear Algebra is a little rusty, maybe that's why I'm not getting it
wooden sail
slim bone
I think I sort of missed the point - Why do we care if it's invertible from the ...
because that means you can recover the full info even if you downsampled
that's not necessary depending on what you do after, but it can be nice to have
slim bone
wooden sail
because that means you can recover the full info even if you downsampled
Right but how does that matter in the context of Computer VIsion?
slim bone
wooden sail
that's not necessary depending on what you do after, but it can be nice to have
Ah
wooden sail
for example with u-nets that i mentioned earlier, you can use a network to denoise an image
you can do this by slowly downsampling an image down to very few samples, and then using those few samples to reconstruct the full image without noise
similar things are done all the time in image processing more generally under the guise of "auto-encoders"
slim bone
wooden sail
you can do this by slowly downsampling an image down to very few samples, and th...
That sounds insane
Completely out of context but is "Image processing" its own field?
Like ML or whatever
wooden sail
yesn't 😛
in all of signal processing, the general maths are transferrable
but in each application within it you can go arbitrarily deep & cursed
at some point you start seeing stuff that is only done in image processing and virtually no other signal processing/ML application
 slender kestrel
wooden sail
yesn't 😛
slender kestrel
wooden sail
yesn't 😛
ayo edd hows you mate
wooden sail
hi
slender kestrel
hows you ! and hows life been ?
wooden sail
been ok, i'm not sure i remember you though
slender kestrel
wooden sail
been ok, i'm not sure i remember you though
glad to know you are ok and lol its fine if you dont remember me
you helped me once on a problem i was stuck on
wooden sail
i see, hopefully that worked out well 😛
slender kestrel
wooden sail
i see, hopefully that worked out well 😛
well that did lol
 proper meteor
someone help with the shape of the images pls
 rugged mist
wooden sail
you can do this by slowly downsampling an image down to very few samples, and th...
rugged mist
wooden sail
you can do this by slowly downsampling an image down to very few samples, and th...
does this method have a name
wooden sail
rugged mist
does this method have a name
the ML people would call this something like "latent space representation" or something like that
past meteor
Principal component analysis'
wooden sail
PCA is one way of doing it, but not the only
past meteor
Definitely .
wooden sail
technically any time you use a parametric representation with fewer parameters than there are data points, this happens
rugged mist
oh interesting i know about pca
wooden sail
i.e. fitting the 3 parameters of a sinusoid to 100 time domain samples
past meteor
It's more general than PCA, I guess any compression and reconstruction pair can work
past meteor
In uni I always wondered why PCA specifically was always mentioned but in the end, the properties of the method just make it ultra suitable
wooden sail
PCA is mentioned because it ties to covariance matrices and the fundamental theorem of linear algebra in one shot
super clean whenever your data is contained in a comparatively low dimensional linear subspace of the overall space the data is in
past meteor
The orthogonality of the eigenvectors is a large selling point
wooden sail
i would say that's also not even necessary since you can always gauss jordan after finding a basis
past meteor
Would that apply to say the bottleneck of an autoencoder?
wooden sail
how do you mean?
past meteor
Conceptually they're similar things as your principal components, they "compress" the data
wooden sail
ah yeah
past meteor
But that property does not hold for autoencoders
wooden sail
which property?
past meteor
Orthogonality of the neurons in the bottleneck
wooden sail
it's kinda moot since it's nonlinear anyway
past meteor
Tbh people have been playing with this, see beta-autoencoders
wooden sail
beta encoder means something related to ADCs to me, lemme see if i can find what it means in ML
past meteor
Or beta VAE's, I'm not at my computer right now so I can't look up the specifics. The idea is just that people want representations that are independent
wooden sail
you'd have to define what you mean by independent. if it's the neurons you wanna make indep, you need to define some sort of inner product or distance metric
if it's an architecture that ends up generating a matrix of atoms, then the final result is some sort of frame and ideas similar to those of PCA apply
 stiff dove
Hello everyone can anybody tell me this kind of loss graph indicates that my learning rate is too high or is there another issue?
 past meteor
I'm a bit rusty in the specifics as you can see, I haven't read the paper in a while
wooden sail
i'm also not savvy on VAEs, so i can only discuss this very superficially
but a cursory glance at a beta VAE paper makes me think this is indeed the case. some regularized learning of "latent factors", but i can't tell if these are used to decompose the data linearly or nonlinearly
in either case, it's more or less the same idea: if you can construct a decent model for your data, you can then focus on learning the parameters of that model instead of learning everything from scratch. those parameters are usually few
past meteor
Personally I'm a big sucker for kernel methods (when I can use them) so I'd just use KPCA over these
wooden sail
i would also lump those in the same category
past meteor
Of course, they're all conceptually the same
 weak mortar
Hi 🙂 hobbyist playing with some dataframes, backtesting and data vizualisation here. Looking for suggestion for some cool library or software that i can use to further visualize the data. Heatmaps and matplotlib are fine but my dataframe with results will be 3 or maybe more axis, thinking i could find some more tools to assist me here?
left tartan
weak mortar
Hi 🙂 hobbyist playing with some dataframes, backtesting and data vizualisation ...
I use all sorts of libraries. I work in notebooks a lot and have moved away from matplotlib, preferring Plotly. Seaborn has some interesting plots (violin plots) as well. Currently, my main is Plotly. Altair is pretty good too... altair uses vega as the js charting engine, and plotly has plotly.js, so these can produce some nice charts with interactivity.
weak mortar
Good, the backtesting.py lib i use plots price graph and other stuff with bokeh, but it is very heavy on the computer to load. Okay i used a bit seaborn for heatmaps will look into its other features and plotly. Would you visualize it in 3d if you had 3 axis?
 frozen vessel
so I wanted to build a feature that allows the user to say input into their microphone, then this input gets translated to english (if it isn't already in english) and then gets printed out in the form of text. Basically a speech to text model with translation
Now, the requirement of this project is that it needs to be done using an API (school mandated it 😭 )
left tartan
I rarely have liked 3d visualizations, it tends to be noisy and hard to visually interpret.
frozen vessel
I tried doing this as my code, it records the input but then for some reason can't transcribe it
used whisper api from openai
left tartan
weak mortar
Good, the backtesting.py lib i use plots price graph and other stuff with bokeh,...
What granularity is your data? Hourly or 5 min candles or something?
frozen vessel
I'd appreciate any help I could get
weak mortar
I have 1minute data but rn im resampling it to 5min to save time and also bokeh plots evrry single candle so it lags alot
left tartan
frozen vessel
I'd appreciate any help I could get
Maybe open a #1035199133436354600 thread and share some details? It's fairly specific, but maybe someone will jump on?
weak mortar
The lib should be able to resample before sending data to bokeh but it didnt work for me
left tartan
weak mortar
I have 1minute data but rn im resampling it to 5min to save time and also bokeh ...
I haven't used bokeh in a while, so not sure if it's slow, but I'd try a few libraries... and make sure it's the library. For complex (lots of points) charts, rendering statically might be better.
weak mortar
Yeah maybe i will just plot linecharts of equity and close prices with matplotlib instead. Its not that important, more all the metrics of the results i look at
left tartan
fwiw, plotly.express is kinda nice:
import plotly.express as px
fig = px.line(df, x="date", y="price", color="equity")
fig.show()
Okay looks alot like matplotlib syntax iirc 🙂 ill have a shot at them all today. Like to just play around then eventually keep what i see works well
left tartan
yah, it's intentionally matplotlibby
weak mortar
I see many use jupyter, but it never really appealed to me
I just append all the results into a html page
left tartan
I primarily work in notebooks, but that's my business. But, we continually refactor anything complex into separate modules.
It's a nice environment for doing this type of work, sort of a all in one (repl, visualization, stateful kernel, etc).
weak mortar
I can see how its probably faster and more flexible than when im modifying the htm with .replace(), tag by tag 🫣😝
left tartan
weak mortar
I can see how its probably faster and more flexible than when im modifying the h...
You could also use something like dash
Plotly Dash User Guide & Documentation
weak mortar
it looks actually quite nice
i think i would be better off using that to make some interactive functionality in the visualized data
and make stuff look pretty
 polar mason
I have a small issue with graphs and I dont exactly know which library would be best.
The data is:
x length = 4000
Y length = 10,000
Z length = 255
Drawing up the actual plot with matplotlib takes so long
i was actually thinking of using a third party software just for plotting but I was wondering what would be the best way to show this data
serene scaffold
polar mason
I have a small issue with graphs and I dont exactly know which library would be ...
Remember that in computer science, a graph is nodes and edges. Data visualizations are plots.
If you have a lot of things that you're trying to plot, you should probably do some kind of down selection
 agile cobalt
you could aggregate it before plotting, but a third party software won't be much more faster than matplotlib if it were just trying to do the same thing as you're trying to do
(it could do it in a way smarter than what you're trying to do though)
polar mason
serene scaffold
Remember that in computer science, a graph is nodes and edges. Data visualizatio...
the thing is currently I need to be able to visualise all data points for a better observation
so I cant get rid of any of the data at the moment, all individual nodes are important
serene scaffold
polar mason
the thing is currently I need to be able to visualise all data points for a bett...
If you actually plotted everything, would it actually produce a visualization that was easy to interpret?
polar mason
serene scaffold
If you actually plotted everything, would it actually produce a visualization th...
spaced out, yes
ive tried it with a smaller Y length and its perfect, but I want to do the full 10k plots
serene scaffold
Spaced out? Does that mean you'd need a giant monitor to view it?
agile cobalt
you can probably aggregate it in buckets of 40x100x1 down to a 100 x 100 x 255 grid without any real loss
polar mason
serene scaffold
Spaced out? Does that mean you'd need a giant monitor to view it?
Ive been increasing with this ax.yaxis.set_major_locator(ticker.MultipleLocator(base=5))
serene scaffold
polar mason
Ive been increasing with this `ax.yaxis.set_major_locator(ticker.MultipleLocator...
If the plot that you produce can't fit on someone's screen, it's not useful.
polar mason
Just needs to fit on my screen
serene scaffold
Is your screen the size of a television?
polar mason
I need a highres image that I can zoom in on
polar mason
serene scaffold
Is your screen the size of a television?
i wish
serene scaffold
What would you do once you zoom in? Because you can make more than one plot
I have to go all of the sudden.
polar mason
I just need to plot all of it so I can see which parts need to be edited and changed
It takes an hour with only 5000 plots and its killing me
polar mason
agile cobalt
you can probably aggregate it in buckets of 40x100x1 down to a `100 x 100 x 255`...
if I chunk it, is their any way to kind of string them together?
im still trying to find ways to space out the whole scatter and increase the amount i can plot

Actually, Im gonna look into VisPy
polar mason
ah I ended up answering my own issue, it was an issue of fig size haha
left tartan
serene scaffold
What would you do once you zoom in? Because you can make more than one plot
I'm imagining this: https://en.wikipedia.org/wiki/The_Great_Picture#/media/File:GP_Hanging_In_Camera_RJ.jpg

As of 2011, The Great Picture (111 feet (34 m) wide and 32 feet (9.8 m) high) holds the Guinness World Record for the largest print photograph, and the camera with which it was made holds a record for being the world's largest. The photograph was taken in 2006 as part of the Legacy Project, a photographic compilation and record of the history of...
polar mason
left tartan
I'm imagining this: https://en.wikipedia.org/wiki/The_Great_Picture#/media/File:...
fr if i had a place with a big enough screen, i would do that
like give me a 12k projector
left tartan
rent a movie theater
polar mason
anyway this actually works atm so im cool with it
 polar mason
left tartan
rent a movie theater
polar mason
left tartan
rent a movie theater
I'll be sat with popcorn staring at a graph for hours
left tartan
polar mason
anyway this actually works atm so im cool with it
How'd you generate that?
polar mason
left tartan
How'd you generate that?
Its 10 seconds of sensor data
left tartan
I mean, what library?
left tartan
Oh, interesting, came out pretty nice... assumed it was something else
polar mason
its a 10k image res tho
so it takes up like 150 mbs per image
but i get good stuff like this
 left tartan
What kind of sensor data?
polar mason
I believe vibration data?
yeah its vibrations over an array of 4000 locations
this is part of my thesis atm
except i cant get enough of making this lil plot spin

it spin
 cerulean kayak
can someone please explain to me what %matplotlib inline does in Jypyter?
polar mason

polar mason
polar mason
except i cant get enough of making this lil plot spin
and then increasing it to

more bigger spin
left tartan
cerulean kayak
can someone please explain to me what `%matplotlib inline` does in Jypyter?
That just says render the matplotlibs inside the notebook, rather than as a separate image.
I think it's enabled by default though, at least in my environment
cerulean kayak
left tartan
I think it's enabled by default though, at least in my environment
I was going to ask that.
left tartan
Yah, doesn't do anything for me. I think it used to create a separate image or something
 humble portal
I'm trying to use an implementation of FIt-SNE, but it runs out of memory on an A10 at this line:
dY = torch.sum(
            (PQ * num.to(device)).unsqueeze(1).repeat(1, no_dims, 1).transpose(2, 1) * (Y.unsqueeze(1) - Y),
            dim=1
        )
Unfortunately, these variables are poorly named and undocumented. However, the function preceeding the line where the function runs out of memory is
sum_Y = torch.sum(Y * Y, dim=1)
num = -2. * torch.mm(Y, Y.t())  # (N, N)
num = 1. / (1. + (num.to('cpu') + sum_Y.to('cpu')).t().to('cpu') + sum_Y.to('cpu'))
num.fill_diagonal_(0)
Q = num / torch.sum(num)
Q = torch.max(Q, torch.tensor(1e-12, device=Q.device))
Q = Q.to(device)

# Compute gradient
PQ = P - Q

Q.to('cpu')
P.to('cpu')
Y is initialized to a tensor of zeros equal to the length of the dataset and the code given as well as the line that breaks is within a loop that runs for a given number of times. P is some tensor based on the dataset (I think it's the dataset after undergoing some dimension reduction).
Essentially: How can I change this expression to calcualte dY with less memory?
polar mason
polar mason
and then increasing it to
Ended up just changing matplot settings in the end with cython to execute it and be a tiny bit faster, but im finally getting the stuff i wanted

the actual file is about 150 mbs
 simple tapir
hey
data_id_mean = data.ID.mean()
data.ID.map(lambda p: p - data_id_mean)
What does this actually do?
We take the mean of ID column but what's p here? What do we minus from mean of IDs?
 small wedge
simple tapir
We take the mean of ID column but what's p here? What do we minus from mean of I...
small wedge
simple tapir
We take the mean of ID column but what's p here? What do we minus from mean of I...
p is any element the map function passes through to the lambda, i.e. each element of the ID attribute. I believe this would be a type of data normalization
simple tapir
hmm, I see thanks
weak mortar
While i always liked numbers, i think i should acquire some knowledge about statistics. I could ask a dozen questions about variance, standardization and quantiles, but maybe i should read a book about it. Not that i like books alot though. Any suggestions? And also, good morning
(Non professional data scientist, algotrader thats asking)
twilit tundra
weak mortar
While i always liked numbers, i think i should acquire some knowledge about stat...
Statistics by David Freedman is pretty accessible and can be found online for free
twilit tundra
If you prefer videos, statquest has a lot of short and accessible videos
weak mortar
Even if i only end up reading half of it like all other books i try and read.. still a half book wiser
weak mortar
While it makes sense to just loom at the bulk of the distribution (quantiles), the outliers do also have relevance 🤔 i think the big challenge is to narrow down the metrics to the most useful ones to assist an informed decision
 unique ether
I've narrowed it down to the following fields: Statistics, Linear Algebra, Probability theory and Calculus.
 pine wolf
unique ether
I've narrowed it down to the following fields: Statistics, Linear Algebra, Proba...
pine wolf
unique ether
I've narrowed it down to the following fields: Statistics, Linear Algebra, Proba...
linear algebra, calculus first in that order
though calculus will probably be taught before linear algebra in college
 cosmic harbor
Hello everyone,
After building Pytorch from source, CUDA is not available. Here is what I did:
git clone --recursive https://github.com/pytorch/pytorch
cd pytorch
git submodule sync
git submodule update --init --recursive
conda install cmake ninja
pip install -r requirements.txt
conda install mkl mkl-include
conda install -c pytorch magma-cuda115
make triton
export CMAKE_PREFIX_PATH=${CONDA_PREFIX:-"$(dirname $(which conda))/../"}
python setup.py develop
Can anyone help?
unique ether
pine wolf
linear algebra, calculus first in that order
Many thanks
past meteor
unique ether
Many thanks
probability theory is a nice extension of linear algebra and calculus
so you can do it after lin alg/calc
unique ether
past meteor
probability theory is a nice extension of linear algebra and calculus
Oh nice good to know!
past meteor
It will depend on your text book but we had mini proofs in probability theory that required a working knowledge of say integrals
unique ether
Basically my situation right now is this: I'm starting a 1 year conversion course soon as some of you already know going from a Bsc in Nat Sci to an Msc in AI and ML.
I know a bit of statistical testing from my Nat Sci course but not too much.
I've been studying python for like 10 hours a day for the last month and now I'm trying to brush up on my maths. What would you all reccomend I focus on? I have roughly 20 days until the start of my course.
Just assume I'll be studying 10 hours a day up until the course starts
Because I will be
pine wolf
the calculus you need for ML i don't think is too deep, at least not to start; not that i'm that familiar with ML -- but linalg is everywhere
unique ether
pine wolf
the calculus you need for ML i don't think is too deep, at least not to start; n...
So like calculus 1?
maybe a lil bit of calculus 2?
pine wolf
yeah, like calc 1 to understand back propagation
unique ether
Rodget that
Many thanks mate
I'm actually watching an udemy course on the fundamentals of math right now. Just to refresh my math knowledge and have a solid foundation going forward.
I'm thinking: Math fundementals (refresher) --> Algebra (refresher) --> Linear Algebra --> Calculus 1
 keen solstice
hey guys,I had a question.
WHen I type print( in my jupyter lab, it doesnt complete the other bracket at the end ,and nor does it automatically add the ending quotation mark if I type the opening one,
Any fix?
unique ether
are you typing in a markdown cell?
keen solstice
no in a code cell
unique ether
I'm not sure then mate sorry. I'm new too.
polar mason
me and my friends have been debating.
For just general AI and data science, higher ram speeds or more ram volume?
like we where talking about how you could chunk it to make more out of the speeds, but then more volume means you can just load it at once
which is better?
 untold bloom
keen solstice
hey guys,I had a question.
WHen I type print( in my jupyter lab, it doesnt compl...
untold bloom
keen solstice
hey guys,I had a question.
WHen I type print( in my jupyter lab, it doesnt compl...
hi, did you try the "Settings" in the menu, then "Auto Close Brackets for Text Editor"
keen solstice
untold bloom
hi, did you try the "Settings" in the menu, then "Auto Close Brackets for Text E...
yeah,ty
 potent sky
polar mason
me and my friends have been debating.
For just general AI and data science, hi...
potent sky
polar mason
me and my friends have been debating.
For just general AI and data science, hi...
below a certain threshold, lower RAM can make some things pretty much impossible.
I guess slower RAM will only ever make things slower.
past meteor
unique ether
At its code, AI and ML is just maths isn't it?
yes it's applied math
Like an engineering discipline the real world matters (the problem you're solving) and also your constraints (stuff related to comp sci)
unique ether
So its just applying maths to a problem within the constraints of computer science
unique ether
Do you lot think that trying to code math problems into python is good practice for a career in ML?
math problems and formulas and equations and such
wooden sail
that's unavoidably a large part of what you'll do
along with the practical implications of handling huge amounts of data and doing math with stuff that doesn't fit in memory
left tartan
unique ether
Rodget that
fwiw, these videos are wonderful intros for linear and calc. Just a high level intro, but I'd suggest watching it before and after you take either course... it's just really well done: https://www.youtube.com/@3blue1brown/courses. And for calculus, this is a gentle intro to Calculus taught by one of the great professors of the subject: https://ocw.mit.edu/courses/res-18-005-highlights-of-calculus-spring-2010/. There are probably other options for linear & calculus deep dives, but his explanations are probably my favorite. I absolutely love his proof of the derivative of e^x.
 flint orbit
Hi guys, is this the right place to ask questions about Jupyter?
past meteor
flint orbit
Hi guys, is this the right place to ask questions about Jupyter?
yes, ask away
flint orbit
past meteor
yes, ask away
I think I solved it. The problem was with the fact that jupyter closed the cell for editing right at the moment when I typed something and stopped even for a short moment. Presumably it was related to autosave setting of vs code, I'm running notebooks inside it.
twin forge
left tartan
Perhaps you have spurious zeros, or perhaps gaps in data that’s been filled inco...
a friend of mine suggested the following approach:


GitHub
Contribute to phrenico/uniqed development by creating an account on GitHub.
from uniqed.runners.tof_run import detect_outlier

df = detect_outlier(ohlcv_dict["UPRO"]["Adj Close"], cutoff_n=80)


Cell In[4], line 1
    df = detect_outlier(ohlcv_dict["UPRO"]["Adj Close"], cutoff_n=80)

  File ~\AppData\Roaming\Python\Python310\site-packages\uniqed\runners\tof_run.py:34 in detect_outlier
    np_time_series = time_series.values[:, 0]

IndexError: too many indices for array: array is 1-dimensional, but 2 were indexed
but my test run was unsuccessfull, I've tried reset_index() on the "Adj Close" series to create a "Date" column, and .reshape(). Any ideas?
left tartan
twin forge
a friend of mine suggested the following approach:
https://github.com/phrenico...
I'm just saying, you have to understand the mechanisms behind the actions before applying filters and outliers. It's very likely there's an easier way to filter the data.
For example, if there's an erroneous 0 after trading hours /etc, perhaps you want to remove them. Or, perhaps you just want to restrict your data to the trading window.
twin forge
left tartan
For example, if there's an erroneous 0 after trading hours /etc, perhaps you wan...
yfinance registers prices on close so it's probably not after hour data
left tartan
You seem to not want to look at the data? I don't really get it. Pick a spot where a particular equity has a lot of zeros and look at it.
twin forge
 left tartan
The dataframe, is what I'm talking about.
twin forge
sure but saying "it's after hour data" without even looking if yahoo finance registers it
kinda 
 lavish ember
should i install packages like tensorflow globally or in virtual environment? I am beginner.
past meteor
lavish ember
should i install packages like tensorflow globally or in virtual environment? I ...
in a virtual environment
 frosty root
hey so im writing my college application and one of the supplementals is why i want to do the honors program, im saying that i want to do it for the mentorship so i can learn a ton ab ai and using it (which is true) but i dont know what there is in the real world with ai that isnt taught in the basic courses i screenshotted below. any thoughts on some things that college doesnt teach you in ai that a mentor from the industry could?
 small wedge
frosty root
hey so im writing my college application and one of the supplementals is why i w...
small wedge
frosty root
hey so im writing my college application and one of the supplementals is why i w...
I'd assume AI fundamentals will not go over things like deploying trained models and industry concerns when distributing ML services to users such as alignment and adversarial attacks. Depends on exactly what your mentor would do though, there are applications of AI/ML that aren't distributed to users ofc.
frosty root
small wedge
I'd assume AI fundamentals will not go over things like deploying trained models...
industry probably isnt the way to go with this i dont think, because i have internships for that. stuff in the actual theory is more aligned i think
 molten onyx
i have a bug in my backpropagation function i have a feeling it's with calculating the derivative. can you tell me if i have a obvious flaw in my code?
the code is in c++ but i think the its understandable
    double derivative_outputlayer(double current_weight, double output, double prev_output, double target)
    {
        double f1 = output - target;
        double f2 = output * (1 - output);
        double f3 = prev_output * current_weight;

        double derivative = f1 * f2 * f3;

        return derivative;
    }

    double derivative_hiddenlayer(double current_weight, double output, double prev_output, double sum_gradients)
    {
        double f1 = output * (1 - output);
        double f2 = prev_output;
        double f3 = sum_gradients;

        double derivative = f1 * f2 * f3;

        return derivative;
    }
 fleet musk
Hi. Anaconda keeps telling me to update to latest version.
If i update, will it update all installed packages across my envs? Will my old projects break?
past meteor
molten onyx
i have a bug in my backpropagation function i have a feeling it's with calculati...
Can I comment on the code itself a bit?
-
I would give more descriptive names to f1, f2 and f3 especially considering f1 in function 1 == f1 in function2. To me this detracts from the readability.
-
I'd rename the function to make clear that you're dealing with a sigmoid. If I see "derivative_outputlayer" I then check the body of the function to see what loss you're using. You can help the reader a bit out here 🙂
molten onyx
past meteor
Can I comment on the code itself a bit?
1. I would give more descriptive names...
thanks, ill try to impplement it!
past meteor
double derivative_outputlayer_sigmoid(double current_weight, double output, double prev_output, double target)
    {
        double error = output - target;
        double activation_derivative = output * (1 -output);


        double derivative = error * activation_derivative * prev_output

        return derivative;
}```it's also strange that you're doing the derivative w.r.t. a single neuron in the previous layer
molten onyx
im kinda confused anyways with the howl the backprop thing. i watched a few videos and everytime when i watched them i had a million question which were left unanswerd
past meteor
Okay can I give you a protip then?
Start smaller. Just write out gradient descent in any language you want. Then turn it into stochastic gradient descent. Then add regularization.
Write your own data generating function. Play around with the amount of regularization, play with the batch size. See what it's doing and try and find out why.
Once you've done SGD for a simple linear model implementing backprop will be a bit easier. Also, it's important to know that nowadays people don't do backprop like this. They use automatic differentiation
molten onyx
ok, thanks! i think its the bes advice ive ever gotten in my howl Journey.
ik that backprop isnt as relevant nowadays but i find it quite interesting and im only gonna use it to apply for a apprenticeship
humble portal
humble portal
I'm trying to use an implementation of FIt-SNE, but it runs out of memory on an ...
bumping my post from yesterday
past meteor
molten onyx
ik that backprop isnt as relevant nowadays but i find it quite interesting and i...
Automatic differentiation is still backprop, it's just done differently. You can kind of conceptualise it as a class/type that wraps a scalar, vector, tensor, ... basically each time you do any mathematical operation with that type it "acts" like a regular math object but it stores the gradient internally
https://arxiv.org/abs/2106.11342 <= this book also uses the method of starting with linear regression and moving to neural nets if you want more "guidance"

arXiv.org
This open-source book represents our attempt to make deep learning
approachable, teaching readers the concepts, the context, and the code. The
entire book is drafted in Jupyter notebooks, seamlessly integrating exposition
figures, math, and interactive examples with self-contained code. Our goal is
to offer a resource that could (i) be freely av...
molten onyx
ill look into it tommorow, thanks!
past meteor
humble portal
I'm trying to use an implementation of FIt-SNE, but it runs out of memory on an ...
How big is your dataset?
humble portal
42000 elements
past meteor
If I recall correctly, but you'll have to fact check me on this, t-sne does form some kind of pairwise similarity matrix, basically an NxN thing
humble portal
Sorry, I forgot to copy the post with the dimensions. PQ and num are (42000 x 42000) while, Y is (42000 x 2)
past meteor
42000x42000 x floating point precision
humble portal
Yeah pretty much. I'm not well versed in how t-sne works, I'm just trying to visualize datasets so that I can display coreset coverage, and there aren't any good torch implementations of t-sne, so I'm trying to get the only not-completely-garbage one I could find to work
past meteor
If it's double precision you're looking at idk 14.1GB ram?
How much memory do you have?
Does it need to be from Torch?
humble portal
That step is trying to create 13.2GiB, so yeah that seems accurate.
It does in fact need to work with torch. Keras will not work for my implementation. I have 2 A10s, although it seems that this can only utilize one at any given time.
past meteor
I should really look into the algorithm in detail but sklearn's docs strongly imply they have a method that defers forming that NxN matrix but is slower https://scikit-learn.org/stable/modules/generated/sklearn.manifold.TSNE.html
scikit-learn
Examples using sklearn.manifold.TSNE: Comparison of Manifold Learning methods Manifold Learning methods on a severed sphere Manifold learning on handwritten digits: Locally Linear Embedding, Isomap...
scikit-learn
Look for the bare necessities, The simple bare necessities, Forget about your worries and your strife, I mean the bare necessities, Old Mother Nature’s recipes, That bring the bare necessities of l...
humble portal
I don't believe that the sklearn method works with tensors
past meteor
nope
humble portal
It also seems to be a CPU-compute method, so it won't function well with such a large dataset, let alone what I need to eventually do with IMAGENET
past meteor
Plus it'd be a moot point if it goes ahead and forms that pairwise distance matrix anyway.
Are you open to other ways to visualise your dataset?
humble portal
Such as?
It seems that t-SNE is the standard now in domains that require a representation of "distance"
past meteor
Heads up though, I've had a month long holiday and I'm a bit rusty ML-wise so maybe I'm not seeing something.
If you have images you can just ram them through any pretrained model and compute whatever distance you want. Just remove the top of the network, flatten or pool, whichever you want and then compute the distance
Also, at that point you have a vector. You can PCA this vector if you want and plot that way. This is what I did in the past sometimes.
humble portal
past meteor
If you have images you can just ram them through any pretrained model and comput...
Not really what I need. I'm working on coreset selection, so I need to display the positions of selected coreset vs redundant elements within datasets within the domain space.
past meteor
Let me read your original post and think for a bit. EDIT: not much to go on for your problem 😛
past meteor
humble portal
Not really what I need. I'm working on coreset selection, so I need to display ...
What exactly do you mean with "the positions of selected coreset"
humble portal
I can't say much on the topic, but I'm attempting to use coreset selection to guess the bounding manifolds of the individual classes within a space. I want to display the dataset in a way where I can highlight certain points based on said coreset selection.
 stable cape
Hello! I have a question. I have an algorithm that gathers data on financial performance, keeps it and yields it to an AI. However, im facing problems feeding the ai bc the amount of data is too large. To solve this, I am trying with langchain models, but i dont know which one and how to use it. Does anyone know about it ? If not, do you know any alternatives?
langchain agents*
past meteor
humble portal
I can't say much on the topic, but I'm attempting to use coreset selection to gu...
I see! I hadn't heard the term coreset selection specifically yet. Another niche I just discovered. I guess this is very specific so I'm probably not of much help.
My profs loved kernel methods so we covered Determinantal point processes which are probably coreset selection now that I know what the term is
You'll run into the same issue there cause as you probably know Kernel methods need that NxN matrix as well 😿
humble portal
past meteor
I see! I hadn't heard the term coreset selection specifically yet. Another niche...
It's a niche that's gaining ground due to the growth of massive unlabeled datasets with things like LLM training, so I'd suggest looking into them. CRAIG is a good algorithm to start by looking at.
The issue isn't the NxN matrix, so much as that the line I posted is creating a 2nxn matrix for some ungodly reason.
past meteor
humble portal
It's a niche that's gaining ground due to the growth of massive unlabeled datase...
Yes but the NxN alone means you'll never scale. Having it twice sucks yes but just the one is already a death sentence, no?
Or am I missing something, especially since you mentioned imagenet
humble portal
I guess you're correct there. Hmm well since I only need to calculate it once for each dataset, I guess a CPU-bound option works. How fast is the sklearn option? Even if I need to run over the course of a few days, there shouldn't be too much of an issue.
past meteor
The docs say it can take hours 🤣
pallid badge
Hi, I need to process 200000 images. I want to store them into an hdf5 file, 3d array. First dim is the image number. I track the image number. I create a hdf5 dataset. Can I populate the array only by keeping track of the image number in the parallel processing?
dset[image_number]=converted_image
Then I relay on my image_number to sort this out in the dataset the position?
H5py puts the converted data via the image_number into the correct location of the dataset?
desert oar
pallid badge
Hi, I need to process 200000 images. I want to store them into an hdf5 file, 3d ...
what do you mean by "correct location"? when you iterate over the dataset, the images should be returned in the order of image_number, yes.
desert oar
worn stratus
for the most part, the cost is small enough to not matter for analysis. create a...
sure, although analytics queries can be pretty slow even against temporary tables, depending on what you're doing. i think the actual use case for duckdb is embedded real-time analytics inside applications. personally i'm happy with pandas and polars for analysis work.
pallid badge
desert oar
what do you mean by "correct location"? when you iterate over the dataset, the i...
Hi, sorry not see. I have to fill a new dataset in a hdf5 file.
I am trying parallel processing, the images are distributed and come back now converted. They have to be placed back into the dataset (3D np.ndarry).
I use zmq
 stiff wedge
I am trying to convert a GZ File to a CSV File however I am running into errors, this is my current code:
import gzip
import csv
import io

with gzip.open(r'C:\code\un-general-debates-blueprint.csv.gz', 'rt', encoding="utf-8") as vFile:
    file_content = vFile.read()
    #file_content = csv.reader(vFile)

nlpFile = open(r"C:\code\un-general-debates-blueprint.csv", "w")

nlpFile.write(file_content)

nlpFile.close()

print(file_content)
Does anyone know how to possible transform this GZ File to a saved CSV File?
left tartan
stiff wedge
I am trying to convert a `GZ File` to a `CSV File` however I am running into err...
What errors?
stiff wedge
left tartan
What errors?
This is the error:

 sonic meteor
Can anyone help me get into neuroevolution??

 warm shard
Any NN journey? im new to ML started with sound analyzation with logistic regression, planning to move on naive bayes and neural networks or even more of them in time.
i dont know much about NNs i want to gain experience with data management first.
desert oar
lapis sequoia
post as text, not image please
desert oar
warm shard
Any NN journey? im new to ML started with sound analyzation with logistic regres...
there's no one journey that works best for everyone. imo you'll do well by following your interests. if you like audio analysis, keep doing that. you'll eventually find excuses to learn all the things you need to know. for example data management: try storing metadata in various formats, figure out how to store binary data, figure out how to store your fitted model, etc.
the only caveat here is that audio data can be a little complicated, and it tends to be easier to work with "tabular" data (like what you might find in a spreadsheet)
but you can work with audio metadata in tabular form, like a database of songs, year released, etc.
like you could try to predict genre using artist and title or something
warm shard
desert oar
the only caveat here is that audio data can be a little complicated, and it tend...
I actually planned audio as something thats fun to develop and make me learn AI better i will look to these.
desert oar
at the same time, plenty of people do machine learning with audio and image data just using a big folder of files & a text file of labels
desert oar
warm shard
I actually planned audio as something thats fun to develop and make me learn AI ...
yeah keep doing that. lots of opportunities to explore the various tools used in machine learning
warm shard
desert oar
yeah keep doing that. lots of opportunities to explore the various tools used in...
Yeah im planning to learn them after i master data management etc in basic models probably will start learning NN,random forest,decision trees in few months. theres too much to search.
warm shard
desert oar
but you can work with audio metadata in tabular form, like a database of songs, ...
Thats a cool option too but i already started trying to classify signals.
desert oar
warm shard
Yeah im planning to learn them after i master data management etc in basic model...
the field is huge, take your time
warm shard
Okay thanks for all advices.
desert oar
i don't think you need to master data management. data management is a means to an end. start simple, and if your needs expand you will learn more things.
warm shard
desert oar
i don't think you need to _master_ data management. data management is a means t...
Im just trying to have practical skills when i develop a ML model i dont go into things that i dont need in that modal.
lapis sequoia
desert oar
post as text, not image please
Not able to install lazypredict library
twin forge
def log_retornos(n):
    df = pd.DataFrame()
    for t in clean_price.keys():
        df[t] = clean_price[t]["Adj Close"]
    df = df.dropna()

    sec_returns = np.log(1 + df.pct_change()).dropna() * 100
    sec_outliers = pd.DataFrame()
    for t in sec_returns.columns:
        sec_outliers[t] = detect_outlier(sec_returns[[t]], cutoff_n=80)["TOF"]

    for t in clean_price.keys():
        try:
            plt.figure(figsize=(22, 10))
            plt.rcParams.update({"font.size": 19})
            plt.plot(sec_returns[t])

            outlier_positions = sec_outliers.index[sec_outliers[t] == 1]

            if not outlier_positions.empty:
                valid_positions = outlier_positions.intersection(sec_returns.index)
                plt.scatter(valid_positions, sec_returns[t].loc[valid_positions], marker='x', color='red', label='Outlier')

            plt.title(f"Log Retornos em % - {t}")
            plt.legend()
            plt.show()
        except:
            pass

log_retornos(int(input("Defina o números de preços vizinhos: ")))```

Traceback (most recent call last):

  Cell In[3], line 30
    log_retornos(int(input("Defina o números de preços vizinhos: ")))

  Cell In[3], line 10 in log_retornos
    sec_outliers[t] = detect_outlier(sec_returns[[t]], cutoff_n=80)["TOF"]

  File ~\AppData\Roaming\Python\Python310\site-packages\uniqed\runners\tof_run.py:39 in detect_outlier
    ).fit_transform(np_time_series)

  File C:\ProgramData\anaconda3\lib\site-packages\sklearn\utils\_set_output.py:142 in wrapped
    data_to_wrap = f(self, X, *args, **kwargs)

  File ~\AppData\Roaming\Python\Python310\site-packages\uniqed\transformers\transformers.py:25 in fit_transform
    return self.fit(x).transform(x)

  File C:\ProgramData\anaconda3\lib\site-packages\sklearn\utils\_set_output.py:142 in wrapped
    data_to_wrap = f(self, X, *args, **kwargs)

  File ~\AppData\Roaming\Python\Python310\site-packages\uniqed\transformers\transformers.py:21 in transform
    X = self._embedding(x, self.d, self.tau)

  File ~\AppData\Roaming\Python\Python310\site-packages\uniqed\transformers\transformers.py:37 in _embedding
    X = np.zeros((embedded_length, d))

ValueError: negative dimensions are not allowedWhile trying to plot log_returns with markers on outlier data, I've been getting the following error
pallid badge
desert oar
what do you mean by "correct location"? when you iterate over the dataset, the i...
Correct location: The images have been measure in a sequence. To keep this sequence intact, it is important that images from parallel processing come back into this order when saved.
Another question in this context is how ZMQ and multiprocessing ensure that the workers return the data back into the corect order
 cyan sierra
Hi everyone. In a classification problem, is it correct to one hot encode date like this? 'day_of_week_0', 'day_of_week_1', 'day_of_week_2',
'day_of_week_3', 'day_of_week_4', 'day_of_week_5', 'day_of_week_6',
'month_1', 'month_2', 'month_3', 'month_4', 'month_5', 'month_6',
'month_7', 'month_8', 'month_9', 'month_10', 'month_11', 'month_12'
unique ether
Any algorithm engineers lurking about?
past meteor
unique ether
Any algorithm engineers lurking about?
If you have a question please just ask it 🙂
 tall swallow
guys ik this is outa context. I need pc experts opinions on this. I when i play a game like gta v i get around 300 fps low that was about 2 years ago. I do the same thing now i cant even reach 150. I have updated Graphics Drvrs and the exact same settings on everything. whats the issue
 rustic snow
In a convolution neural network does a convolution layer reduce the dimentions of the input picture
small wedge
rustic snow
In a convolution neural network does a convolution layer reduce the dimentions o...
it depends on the exact configurations of the convolutional layer, if it only has one filter and the dim of the kernel/length of the stride are greater than one then the output of the convolution will be smaller than the original image. However in practice almost all convolutional layers are going to have multiple filters which ends up increasing the number of parameters output by the layer. Generally we chain convolutional layers with pooling layers to reduce dimensionality and introduce other kinda of spatial invariance.
 nocturne hornet
Im taking two courses in AI and neural networks at my uni. Is it normal to not get what biases and weights do to my dataset at the beginning? I'm having problems figuring out what it does to my results as im not understanding the lecture jargon.
wooden sail
that depends on what were the prerequisites/how early on in your study program you take the course
nocturne hornet
well were two weeks in and i kinda feel like were getting thrown in the deep end really quickly, but thats me. Our first task was to make a perceptron classifier, from which understand only works if i can make a linear line from the dataset? We then had to adopt a SVM classifier from lecture notes that would give me a different result if its not linear from what im understanding. And im still blank at what my biases and weights do to these classifiers
were using an iris dataset, much like this https://scikit-learn.org/stable/auto_examples/svm/plot_iris_svc.html

scikit-learn
Comparison of different linear SVM classifiers on a 2D projection of the iris dataset. We only consider the first 2 features of this dataset: Sepal length, Sepal width. This example shows how to pl...
nocturne hornet
wooden sail
that depends on what were the prerequisites/how early on in your study program y...
and to answer the prerequisites. We had an introductory course last Fall semester, but it was more about soring algos and a use of Kaman filter to help a pygame get 100% hits
left tartan
nocturne hornet
well were two weeks in and i kinda feel like were getting thrown in the deep end...
Bias and weights are kinda fundamental. Maybe watch 3b1b, first vid covers it: https://m.youtube.com/watch?v=aircAruvnKk

What are the neurons, why are there layers, and what is the math underlying it?
Help fund future projects: https://www.patreon.com/3blue1brown
Written/interactive form of this series: https://www.3blue1brown.com/topics/neural-networks
Additional funding for this project provided by Amplify Partners
Typo correction: At 14 minutes 45 seconds, th...
nocturne hornet
wooden sail
have you taken any linear algebra?
Only matrixes
wooden sail
all right. the weights form a matrix
it gets multiplied to the input data vector. then you add another vector, the "biases", to shift the result
this is called an "affine transformation". it transforms one line into another, and then moves it around in space
weak mortar
Hi. a little issue with a DataTable in dash / plotly. as it was convenient for me to transpose the dataframe used, the DataTable is not displaying the row header
nocturne hornet
wooden sail
this is called an "affine transformation". it transforms one line into another, ...
im assuming the weights move it in another direction?
wooden sail
that, and stretch as well
nocturne hornet
so what should i be look at when it comes to tuning my data assuming my classifiers are built corretly?
All i got now is a plot with some dots either side of the median line
That question sounded amateurish, but that is my current level 🙂
wooden sail
i'd start by checking that 3b1b video, and then reading in your coursebook about support vector machines
nocturne hornet
Implementet and SVM into my code, just ended up with the same accuracy as they are both linear
But yes, ill save the video for the morning.
nocturne hornet
wooden sail
i'd start by checking that 3b1b video, and then reading in your coursebook about...
Sadly, no course books, just power points... :/
wooden sail
nocturne hornet
Sadly, no course books, just power points... :/
i find that hard to believe, uni always expects you to spend at least as much time as you do in class, doing self studies. the slides and syllabus have no references?
 glacial rampart
twin forge
```py
def log_retornos(n):
df = pd.DataFrame()
for t in clean_price.keys...
glacial rampart
twin forge
```py
def log_retornos(n):
df = pd.DataFrame()
for t in clean_price.keys...
I'm not sure, sec_returns contains negative values, and I'm not sure you want it to. Other than that, I can use the uniqed package the way you try to. I don't know what's in clean_price.
It would probably help if you explain what you're trying to do. E.g. what types/ sizes do you expect every input and output to be?
nocturne hornet
wooden sail
i find that hard to believe, uni always expects you to spend at least as much ti...
The reference is usually documentation, like svm turtorials and https://medium.com/@zxr.nju/what-is-the-kernel-trick-why-is-it-important-98a98db0961d and those lines
Medium
When talking about kernels in machine learning, most likely the first thing that comes into your mind is the support vector machines (SVM)…
wooden sail
oof
nocturne hornet
I'm abit frustrated as the lecturers are above my classes head, they are really good at this. Just not teaching. Never worked with weights and biases before even in the introductory course, just sorting algos and implementing kalman filter to a pygame :/
past meteor
You can ask me anything about SVMs @nocturne hornet, do you have any specific questions?
past meteor
nocturne hornet
Im taking two courses in AI and neural networks at my uni. Is it normal to not g...
To me this question wasn't worded super clearly though. You mean you're unsure of the impact of the weights and biases before training?
 abstract wasp
Hi, has anyone ever made an AI that geotags photos? If so, which dataset did you use?
left tartan
abstract wasp
Hi, has anyone ever made an AI that geotags photos? If so, which dataset did you...
I was going to make a joke about Trevor rainbolt
Curious if any ai can beat that guy
desert oar
pallid badge
Another question in this context is how ZMQ and multiprocessing ensure that the ...
The best way to guarantee ordering in any concurrent or parallel processing is to include the sequence number in the input and output, that way the data can be handled in any order, and can be re-ordered as needed later
twin forge
glacial rampart
I'm not sure, sec_returns contains negative values, and I'm not sure you want it...
oh I was trying to do .dropna() but since sec_returns has columns of delisted stock price data, it was removing all rows
this was one of the goals, removing the time interval where stock return == 0%, because it translates to a stock delist
Log Returns in % - BGP


ps: plots in portuguese, I know 
twin forge
problem is, what to do with these illiquid stocks with huge price movements @glacial rampart
 left tartan
twin forge
oh I was trying to do .dropna() but since sec_returns has columns of delisted st...
left tartan
twin forge
oh I was trying to do .dropna() but since sec_returns has columns of delisted st...
Oh, you have a wide formatted dataset (one column per security)? dropna, by default, drops any row with an NA value (default axis = 0)... you can also drop columns with NA with axis = 1: the risk is that you'd drop any security with a single NA (such as an equity that listed recently)
You could also melt (unpivot) the data back to narrow form, which might be easier to work with.
abstract wasp
left tartan
I was going to make a joke about Trevor rainbolt
So you don't have any data sets that can help me? 😭
left tartan
abstract wasp
So you don't have any data sets that can help me? 😭
Nah, sorry
Did you check Kaggle?
abstract wasp
left tartan
Did you check Kaggle?
Yes, but I haven't been able to find anything good.
twin forge
left tartan
Oh, you have a wide formatted dataset (one column per security)? dropna, by defa...
I circumvented the situation with .dropna() by taking the NaN values out of each series without affecting sec_returns and plotting them instead
for t in sec_outliers.columns:
   plt.figure(figsize=(22, 10))
   plt.rcParams.update({"font.size": 19})

   sec_returns_t = sec_returns[t].replace(0, np.nan).dropna()

   if not sec_returns_t.empty:
     plt.plot(sec_returns_t)```

By replacing the 0s (when you calculate variation of NaN values result = 0%) with NaN and removing them, I'm removing the period where a stock has been delistedYou are right. I distribute the images via the following range() over all workers.
Some code snippets
#in worker
for i in range(worker_id, nimages, self._nworkers):
            img = images[i]
  push_sock.send_pyobj((i, result))

def _unordered_recv(self, sock):
        while True:
            img_number, result = sock.recv_pyobj()
            yield (img_number, result)

#in collector later
generator = self._unordered_recv(pull_sock)
The previous programmed wrote an ordered_rec function
def _ordered_recv(self, sock):
        cache = {}
        next_img_number = 0
        while True:
            img_number, result = sock.recv_pyobj()
            if img_number == next_img_number:
                yield (img_number, result)
                next_img_number += 1
                while next_img_number in cache:
                    yield (img_number, cache.pop(next_img_number))
                    next_img_number += 1
            else:
                cache[img_number] = result
But strangely, it seems not to work. When I use ordered_recv I don't get an error message, but some entries in the converted image stack remain empyt. That I don't understand. Unordered seems to work.
 twin forge
GitHub
Contribute to phrenico/uniqed development by creating an account on GitHub.
dope project


I can also set the length of bad returns allowed to be less or more lenient
0.1 meaning I except at least 90% of time series to behave normally
left tartan
neat, I'll have to try it out someday. I still don't like the application of outlier removal without an understanding of the mechanism / reason for the outliers, for the record.
 lime grove
How do you handle outlier removal @left tartan ?
pallid badge
left tartan
Why not just receive them out of order and sort? <@815357558386589800>
Hi! Thank you for your answer. I ran the script with the ordered_recv and unordered_recv. Indeed, only in the unordered_recv version output file seem to have all images inside. In the ordered version some arrays show only 0 that should not be the case.
It would be nice to understand why.
I got this snippet of ordered_recv by another person, I thought he would know what he is doing? For me, it is very important to be in control because I aim to give my code to other people.
Is there any better way to control the input, the processing by ZMQ, and the output, please? Currently for me this is a blackbox.
The only way I can come up with is as follows: I run without the parallel processing and do it in series. Then I redo it, I compare the two final files. Thank you for the discussion 🙂
weak mortar
good morning 🙂 i am converting a dataframe to dict to use as data in a dash_table.DataTable. Unfortunately dash seem to require that i use the method 'records' for converting to dict, which results in all row titles being deleted. if i use 'index' the dict contains the row titles, but dash will not generate the table.
left tartan
pallid badge
Hi! Thank you for your answer. I ran the script with the `ordered_recv` and `uno...
I think you have a mistake in the code. You yield img_number with cache.pop(next_img_number). Shouldn’t this be next.img_number?
left tartan
pallid badge
Hi! Thank you for your answer. I ran the script with the `ordered_recv` and `uno...
But regardless, I don’t think this is a good approach. If img number 0 comes last, all the other requests are cached. Me? I would either receive them out if order and sort them. Or even better, if worried about memory, I would have each worker write the output to a local file and process them in the order I want
stable cape
hello, does anyone know how to implement a delay for each request langchain makes? I have the starter freeplan in Openai of 5$ and it limits the amount of requests per minute so i get blocked... Here 's the code: data = yaml.load(f, Loader=yaml.FullLoader)
json_spec = JsonSpec(dict_=data, max_value_length=4000)
json_toolkit = JsonToolkit(spec=json_spec)
json_agent_executor = create_json_agent(
llm=OpenAI(temperature=0, openai_api_key=OPEN_API_KEY),
toolkit=json_toolkit,
verbose=True,
)
nocturne hornet
past meteor
To me this question wasn't worded super clearly though. You mean you're unsure o...
I'm unsure what it does before training, I'm also unsure how to read the result after training. I have this dataset which im told is a classic illustration of a classification problem.


 past meteor
nocturne hornet
I'm unsure what it does before training, I'm also unsure how to read the result ...
past meteor
nocturne hornet
I'm unsure what it does before training, I'm also unsure how to read the result ...
Can you tell me what you specifically mean wwith BEFORE training?
nocturne hornet
past meteor
Can you tell me what you specifically mean wwith BEFORE training?
If i initialize bias and weights to something else than zero, how does it impact the training. I'm also abit unsure on how SVM works compared to perceptron, so i cant really tell what the differerence is in the training and predictions.
past meteor
Maybe this can help, I wrote this in the past: Maybe this helps? Idk. I wrote this in the past

Your perceptron's decision boundary is pretty bad compared to that of the support vector machine. You see the line is to close too the purple class. There's probably points just beyond that line that are still supposed to be in the purple class but your perceptron will say they're in the yellow
That's a direct consequence of the margin term you add to a SVM, which is related to L2 regularization. If you add that to your perceptron the results will be better. L2 also wants to constrain a magnitude of a vector if you recall 🙂
The reason why you have points inside of the dotted lines are because of the slack variables SVMs are because of the slack variables (eta in my screenshot)
past meteor
nocturne hornet
If i initialize bias and weights to something else than zero, how does it impact...
As far as I know SVMs don't do any kind of fancy initialisation unlike neural nets. If you start with a random weight vector before training and use that you converge to the same result. It's a convex optimization problem with a global optimum.
/info dump over
nocturne hornet
past meteor
As far as I know SVMs don't do any kind of fancy initialisation unlike neural ne...
    def _init_weights_bias(self, X):
        n_features = X.shape[1]
        self.w = np.zeros(n_features)
self.b = 0``` I had this function in my class so i just assumed it didYou can try it with different values that aren't 0. At least for the SVM it should converge.
nocturne hornet
past meteor
That's a direct consequence of the margin term you add to a SVM, which is relate...
class SVM:
    def __init__(self, learning_rate=LEARNING_RATE_SVM, lambda_param=LAMBDA_PARAM, n_iters=N_ITERS):
        self.lr = learning_rate
        self.lambda_param = lambda_param
        self.n_iters = n_iters
        self.w = None
self.b = None``` By L2, do you mean lambda parameter in this case?Did you code the SVM from scratch
nocturne hornet
No, we got handed this code with the task of implenting it to our dataset. With the end goal of comparing perceptron vs SVM in both time and accuracy.
Tried coding perceptron from scratch, probably why its bad 😦
past meteor
Learning rate in an SVM? Can you show me the implementation
Is it stochastic gradient descent?
nocturne hornet
past meteor
Is it stochastic gradient descent?
class SVM:
    def __init__(self, learning_rate=LEARNING_RATE_SVM, lambda_param=LAMBDA_PARAM, n_iters=N_ITERS):
        self.lr = learning_rate
        self.lambda_param = lambda_param
        self.n_iters = n_iters
        self.w = None
        self.b = None

    def _init_weights_bias(self, X):
        n_features = X.shape[1] # The number of features is the number of columns in the dataset
        self.w = np.zeros(n_features) # The weights are the coefficients of the input variables. They are multiplied by the inputs and summed to arrive at an output. They are updated in the learning process.
        self.b = 0 # The bias is a constant value that is added to the weighted sum of inputs to determine the output of a neuron. It is a constant value that is learned during training.

    def _get_cls_map(self, y):
        return np.where(y <= 0, -1, 1)

    def _satisfy_constraint(self, x, idx):
        linear_model = np.dot(x, self.w) + self.b
        return self.cls_map[idx] * linear_model >= 1

    def _get_gradients(self, constrain, x, idx):
        if constrain:
            dw = self.lambda_param * self.w
            db = 0
            return dw, db

        dw = self.lambda_param * self.w - np.dot(self.cls_map[idx], x)
        db = - self.cls_map[idx]
        return dw, db

    def _update_weights_bias(self, dw, db):
        self.w -= self.lr * dw
        self.b -= self.lr * db

    def fit(self, X, y):
        self._init_weights_bias(X)
        self.cls_map = self._get_cls_map(y)

        for _ in range(self.n_iters):
            for idx, x in enumerate(X):
                constrain = self._satisfy_constraint(x, idx)
                dw, db = self._get_gradients(constrain, x, idx)
                self._update_weights_bias(dw, db)

    def predict(self, X):
        estimate = np.dot(X, self.w) + self.b
        prediction = np.sign(estimate)
return np.where(prediction == -1, 0, 1)```Your class is very weird
nocturne hornet
The class is from the course github page which were told to implement, but I dont know much about this classifier to judge.
class Perceptron: # Perceptron classifier class
    def __init__(self, learning_rate=LEARNING_RATE, n_iters=N_ITERS):
        self.lr = learning_rate
        self.n_iters = n_iters
        self.weights = None # The weights are the coefficients of the input variables. They are multiplied by the inputs and summed to arrive at an output. They are updated in the learning process.
        self.bias = None # The bias is a constant value that is added to the weighted sum of inputs to determine the output of a neuron. It is a constant value that is learned during training.

    def fit(self, X, y): # The fit method is used to train the model
        n_samples, n_features = X.shape
        self.weights = np.zeros(n_features)
        self.bias = 0

        for _ in range(self.n_iters):
            for idx, x_i in enumerate(X): #
                linear_output = np.dot(x_i, self.weights) + self.bias
                y_predicted = np.where(linear_output > 0, 1, 0)
                update = self.lr * (y[idx] - y_predicted)
                self.weights += update * x_i
                self.bias += update

    def predict(self, X): # The predict method is used to predict the class of a sample
        linear_output = np.dot(X, self.weights) + self.bias # The linear output is the weighted sum of the inputs
return np.where(linear_output > 0, 1, 0)``` this is the perceptron class i ended up withDid you write this or your professor?
This implementation is wrong
nocturne hornet
class SVM:
def __init__(self, learning_rate=1e-3, lambda_param=1e-2, n_iters=1000):
self.lr = learning_rate
self.lambda_param = lambda_param
self.n_iters = n_iters
self.w = None
self.b = None
def _init_weights_bias(self, X):
n_features = X.shape[1]
self.w = np.zeros(n_features)
self.b = 0
def _get_cls_map(self, y):
return np.where(y <= 0, -1, 1)
def _satisfy_constraint(self, x, idx):
linear_model = np.dot(x, self.w) + self.b
return self.cls_map[idx] * linear_model >= 1
def _get_gradients(self, constrain, x, idx):
if constrain:
dw = self.lambda_param * self.w
db = 0
return dw, db
dw = self.lambda_param * self.w - np.dot(self.cls_map[idx], x)
db = - self.cls_map[idx]
return dw, db
def _update_weights_bias(self, dw, db):
self.w -= self.lr * dw
self.b -= self.lr * db
def fit(self, X, y):
self._init_weights_bias(X)
self.cls_map = self._get_cls_map(y)
for _ in range(self.n_iters):
for idx, x in enumerate(X):
constrain = self._satisfy_constraint(x, idx)
dw, db = self._get_gradients(constrain, x, idx)
self._update_weights_bias(dw, db)
def predict(self, X):
estimate = np.dot(X, self.w) + self.b
prediction = np.sign(estimate)
return np.where(prediction == -1, 0, 1)``` this is the original one that is in our course repo, which I assume is written by our professor uneven bronze
What is the difference between language module and an actual ai
 sonic valley
uneven bronze
What is the difference between language module and an actual ai
sonic valley
uneven bronze
What is the difference between language module and an actual ai
a language model is a model trained on corpora of text, it is typically a neural network, which 'falls' under AI
AI is an umbrella term for automated machinery to complete a task autonomously
past meteor
nocturne hornet
```python
class SVM:
def __init__(self, learning_rate=1e-3, lambda_param=1e-...
Looking at this again, I assume lambda_param is the canonical C parameter in SVMs
uneven bronze
sonic valley
a language model is a model trained on corpora of text, it is typically a neural...
👌
past meteor
That makes the implementation not strictly wrong but just "strange". Idk why your professor would code it up from scratch, why they'd use gradient descent in the primal etc
sonic valley
is it possible to increase the amount of iteration steps with tensorflow when predicting an answer?
past meteor
nocturne hornet
```python
class SVM:
def __init__(self, learning_rate=1e-3, lambda_param=1e-...
This is essentially a https://scikit-learn.org/stable/modules/generated/sklearn.linear_model.SGDClassifier.html with loss="hinge"
scikit-learn
Examples using sklearn.linear_model.SGDClassifier: Model Complexity Influence Out-of-core classification of text documents Comparing various online solvers Early stopping of Stochastic Gradient Des...
 hot hazel
Will AI replace 90% of programmers in 5 years it very good it will replace us right and if not then WHY
nocturne hornet
past meteor
This is essentially a https://scikit-learn.org/stable/modules/generated/sklearn....
Still having issues adjusting the perceptron tho, added a L2 parameter, but its not really doing anything :/
hot hazel
hot hazel
Will AI replace 90% of programmers in 5 years it very good it will replace us ri...
?
 hazy verge
Can anyone provide the resources to learn how to make chatbot from scratch?
sonic valley
hazy verge
Can anyone provide the resources to learn how to make chatbot from scratch?
chatterbot or nltk is your guy
 hazy verge
Thank you
sonic valley
I wouldn't use chatterbot, because i've had troubles getting to work properly on 3.11.4
hazy verge
OK 👍
sonic valley
hot hazel
Will AI replace 90% of programmers in 5 years it very good it will replace us ri...
no
Right now, Generative Pre-trained Transformer (🤓) GPT 4 is the most advanced model, and it has hallucination rates of 20%, so every 5 messages will make false information
It is incapable of doing arithmatics, and its coding knowledge is completely based from StackOverflow
Up until AI can make new information based on what it knows proefficiently, we'll still be their overlords
nocturne hornet
past meteor
Looking at this again, I assume `lambda_param` is the canonical C parameter in S...
I found my result similar to this one tho... https://www.bogotobogo.com/python/scikit-learn/Perceptron_Model_with_Iris_DataSet.php
Perceptron model on the Iris dataset
past meteor
nocturne hornet
I found my result similar to this one tho... https://www.bogotobogo.com/python/s...
What loss is your perceptron algo using, binary cross entropy?
nocturne hornet
simple difference between the predicted output and the actual target to update the weights.
nocturne hornet
past meteor
What loss is your perceptron algo using, binary cross entropy?
y_predicted = np.where(linear_output > 0, 1, 0)
update = self.lr * (y[idx] - y_predicted)```Hmm, I guess the decision boundary being where it is is down to that term but honestly I haven't looked at perceptron in detail
hot hazel
sonic valley
Right now, Generative Pre-trained Transformer (🤓) GPT 4 is the most advanced mo...
In 5 years it will right
past meteor
It's very close to SVMs, especially if you added L2. I'd encourage you to just write down the equations
hot hazel
hot hazel
In 5 years it will right
Right
nocturne hornet
past meteor
It's very close to SVMs, especially if you added L2. I'd encourage you to just w...
If what my understanding from the article is correct, covergience is a problem with perceptron. So im just gonna assume i cant do anything else with that kind of classifier
past meteor
nocturne hornet
I'm unsure what it does before training, I'm also unsure how to read the result ...
But in your image it did OK didn't it?
I've not used Perceptron in the past mainly because I can't think of a situation where I would favour it above a generic SGDclassifier/regressor.
hot hazel
hot hazel
In 5 years it will right
?
Please replay
I am scared if ai will replace us in 5 years
past meteor
hot hazel
I am scared if ai will replace us in 5 years
chill, it won't
nocturne hornet
past meteor
But in your image it did OK didn't it?
Still need to understand my results better i guess. Never sure if im getting what i need
hot hazel
past meteor
chill, it won't
Ok even in 5 years
past meteor
hot hazel
I am scared if ai will replace us in 5 years
People should stop asking this to engineers go ask it to philosophers
Virtually no engineer cares about discussing this topic
It's tiresome and pointless
past meteor
No, find a philosophy discord server and ask them. Thanks.
past meteor
nocturne hornet
Still need to understand my results better i guess. Never sure if im getting wha...
You can talk about how perceptron "hugs" the decision boundary and SVM doesn't and how that's a good thing
hot hazel
past meteor
No, find a philosophy discord server and ask them. Thanks.
No I mean why it won't
I know it won't replace us but why
nocturne hornet
past meteor
You can talk about how perceptron "hugs" the decision boundary and SVM doesn't a...
Thanks ✌️
past meteor
Write out the equations and it'll make more sense 🙂
wooden sail
ai has already replaced us. in reality, zestar is a bot we have linked to chatgpt, the true overlord
hot hazel
wooden sail
ai has already replaced us. in reality, zestar is a bot we have linked to chatgp...
What
Zestar will you replace us
wooden sail
zestar already replaced me by giving better answers in this channel
hot hazel
wooden sail
zestar already replaced me by giving better answers in this channel <:lemon_angr...
Better answers dosnt mean replace you
Zestar how do you feel as a chat gpt and will you replace us
mild dirge
It's definitely better than its 74 predecessors
past meteor
Maybe zestar76 won't take so much time to remember why exactly SVMs are a maximum margin classifier.
hot hazel
past meteor
Maybe zestar76 won't take so much time to remember why exactly SVMs are a maximu...
What
Another ai
NOo I don't want it to replace us
 pale hemlock
if we let it
this is a Machine learning tensor model defines values in a coordinate system and catagorgized via mathematics in dimensions based off the orginal model
I eventually want to create a machine learning model that becomes AI
The graphic 3d aspect is not important the the system as a whole, merely an in intended consequence to model i desgned.
the fact that can do provides deeper insite in to my goal
desert oar
pale hemlock
this is a Machine learning tensor model defines values in a coordinate system an...
i don't think this code even works as-written, you'll need the nonlocal declaration for tensor
the enthusiasm is appreciated, but i also don't think this does anything with machine learning
pale hemlock
desert oar
the enthusiasm is appreciated, but i also don't think this does anything with ma...
its defining a tensor off of real world values like circle triangle, data along theses parameteres can help with massive data
desert oar
pale hemlock
its defining a tensor off of real world values like circle triangle, data along ...
i see. this is actually a well-established technique, you're basically treating each coordinate of each shape here as a separate feature. there are some advantages (e.g. simplicity of the code) but there are also problems with it. for example you can take a (small) image and flatten the pixels, so that each pixel is a separate input feature. the problem is that you lose the proper sense of the 2d locality of the data, so the model has a lot more work in order to construct a good internal representation of the data, compared to using a CNN.
however one thing you can do is use something like an autoencoder to obtain a fixed-size vector embedding for each "object" and feed those into a model. that's basically what all of deep learning for NLP is based on. the nice thing there is that you can tailor the embedding model to accommodate all kinds of weird objects (text, shapes, images, whatever) but the output is very uniform and can be put into a very generic model.
pale hemlock
You could also define the picture as a rectangle and store the info about along that particular dimension
desert oar
right, that's exactly the technique. i'm saying that simply flattening the coordinates might not be the most effective way to obtain a vector representation of a polygon.
although it probably wouldn't be bad either in the case specifically of k-gons, since k is fixed
would be interesting to see if a model can distinguish self-intersecting, convex, and regular polygons just by flattening the coordinates
pale hemlock
the whole point those flattned coordinates are unique to that particular information. the whole pupose of my endevour is to formlize context.. say you want it to identify its self. it can refer to its current shape dude to its parameters that changed over time..
desert oar
i'm not sure what you mean by that
pale hemlock
right im trying
desert oar
yes, flattening the coordinates is an invertible transformation between the original polygon and the flat representation
pale hemlock
say you run this thing and learns the system dymentions, it would soon learn that in contenxt its a rectangle shaped box (gathered from the internet based on hardware information, dimensions, type, cpu then contextualize the information as hardware, it could read x and y values a see it as information from this source as a application, perhaps these values are window dimensions, they can be stored on the dimension avaible and given the cordinates of this newly created understand the model conforms to this information holding values that can be stored as a variable, Ie the computer its on.
in other words with each complete growth factor that conforms to lets say a triangle the orginal modle stores the information coordinately, those corrdinates are input references of stored dictionaries
these references can be combined to show in theory a 3d object once it learns enought about "its self"
what i find intersting is that you could intheory rotate the tensor object to store information anew.
desert oar
i don't follow, what does CPU have to do with this?
pale hemlock
nothing but if you ask the model what type of cpu it has, because when the tensor recieves input and creates a new storage dimension, any value learned in this dimension can later be refernece when tyring to talk a machine learning about itself.
what type of CPU you have because i haven't yet programed that far, i had a hard drive malfunction a week ago and starting new i have to retrace my steps, however this is a new approach of what i was trying to do
because a CPU is generally square, it can store the dimensions, name and stuff on the fly in said dimensions, say it managed to learn square thing and stored in the square dimension, it can refence instantaneously along those parameters and anything else that references square or square objects. perhaps what it revived threw videos, just stored in a space as a refence defined by the orignal tensor.
basically right now, if you run a model againsts it it would know its a square, with circle blach blach but an object that receives and learns as outputs
 tiny nimbus
Hi, I am trying the ai cells magics from https://blog.jupyter.org/generative-ai-in-jupyter-3f7174824862 in jupyter lab. They work great, but I would like to streamline my process. Is there a way to avoid having to %load_ext jupyter_ai_magics in each notebook before using these magics? I looked around and advice on this was old/nonworking. Ideally I would like to change a config or add an argument to my jupyter lab startup alias.
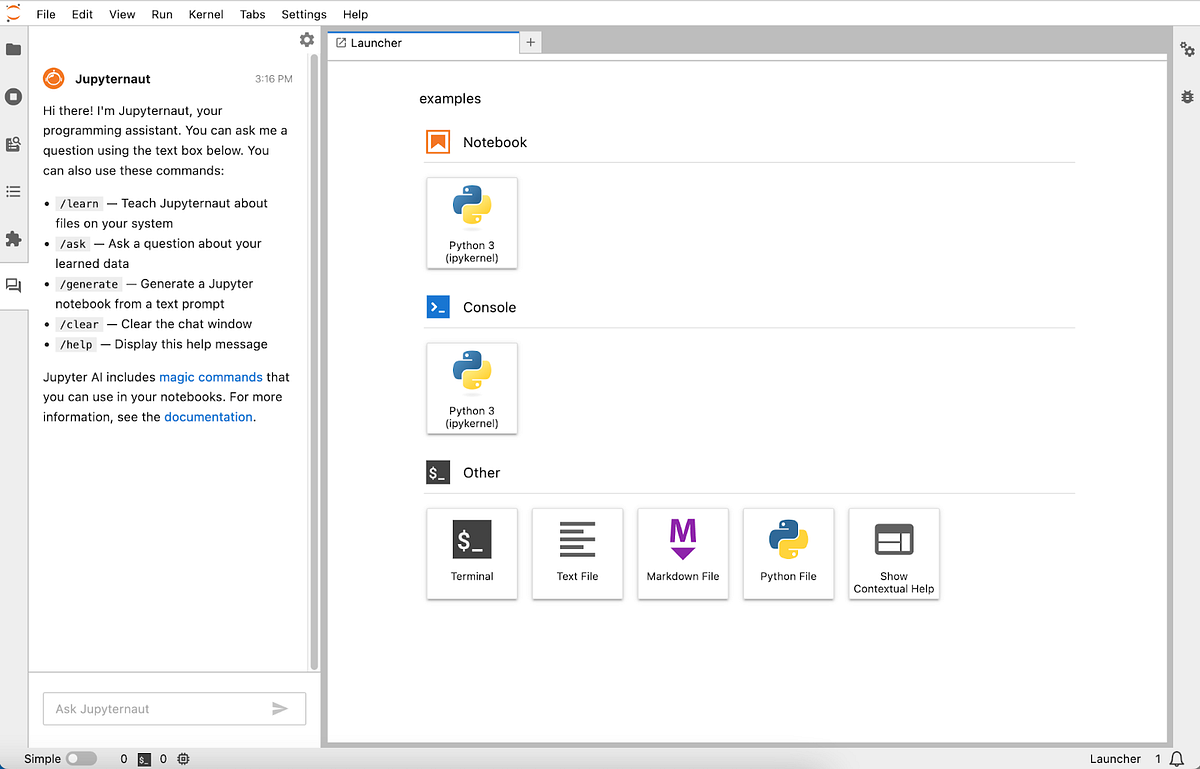
Medium
Jupyter AI, a new open source project, brings generative artificial intelligence to notebooks with magic commands and a chat interface.
 boreal gale
tiny nimbus
Hi, I am trying the ai cells magics from https://blog.jupyter.org/generative-ai-...
boreal gale
tiny nimbus
Hi, I am trying the ai cells magics from https://blog.jupyter.org/generative-ai-...
assuming you are just using a stock default jupyter lab installation:-
- run
ipython profile locate defaultin your terminal - add
c = get_config()
c.InteractiveShellApp.extensions.append('jupyter_ai_magics')
to
<the-path-revealed-in-step-1>/ipython_config.py
3. restart jupyterlab
desert oar
pale hemlock
because a CPU is generally square, it can store the dimensions, name and stuff o...
unfortunately i think you might be very confused about how machine learning works
pale hemlock
hold on
pale hemlock
desert oar
unfortunately i think you might be very confused about how machine learning work...
I suggest you don't run it, it bogs hard, i working with an ssd again the VISUAL context is only something to help it won't remain in the final product,
 cold osprey
hot hazel
Will AI replace 90% of programmers in 5 years it very good it will replace us ri...
cold osprey
hot hazel
Will AI replace 90% of programmers in 5 years it very good it will replace us ri...
yes, in 1 year
tiny nimbus
boreal gale
assuming you are just using a stock default jupyter lab installation:-
1. run `...
@boreal gale Amazing! That worked.
I was previously trying to modify the config indicated by jupyter-lab --generate-config, but it looks like I truly needed the ipython config even though i am using jupyter lab.
Which documentation did you look at to find the answer regarding which config needs to be modified and which value needed to be set?
boreal gale
tiny nimbus
<@231160898872410123> Amazing! That worked.
I was previously trying to modify t...
https://ipython.org/ipython-doc/3/config/intro.html
i was gonna go with ipython startup scripts as i knew that's definitely possible to run python code when a kernel starts up,
but i forgot where to put start up scripts, so i google ipython profile since i knew it's a profile-based thiing and that led me to that page and the top bit immediately showed how to enable cython magic by default so i adapted that instead.
boreal gale
tiny nimbus
<@231160898872410123> Amazing! That worked.
I was previously trying to modify t...
i am actually unsure why your previous approach didn't work.
edit: that seems to be the config for LabApp not ServerApp which is what we needed to change
edit2: yeah no. jupyter-lab --generate-config is for both ServerApp and LabApp actually, and that's probably not to do with the kernel that's being spawned
edit3: i guess the keypoint is just realising jupyter is just using ipykernel - hence you need to alter ipython profile , not jupyter's profile.
tiny nimbus
boreal gale
i am actually unsure why your previous approach didn't work.
edit: that seems t...
Agree on edit3. I am not a huge magics user, but it is a good reminder that magics are kernel feature language specific feature, not a general juyter feature.
 broken flax
Hi I’m new here. Just signed up for Nucamp’s DevOps course with Python starting in September. In the meantime I’m trying to figure out how to work with list in real world situations but I got stuck somewhere. I was able to import my list (.csv) into pandas but don’t know what to do after that. How do I sort the list or find some item in the list. I learned to do this with just simple small list but not in real situations. Any suggestions? Please dm me. Thanks
pale hemlock
 winter drift
Hey guys, any good known datasets of pictures of trash and debris?
serene scaffold
yeah, the selfie folder on my phone
 turbid fox
im planning on making a simple machine learning / ai algorithm to play chess. are there any python libraries i should investigate, aside from pandas / numpy / tensorflow. looking for a starting point in the project, i guess
serene scaffold
turbid fox
im planning on making a simple machine learning / ai algorithm to play chess. ar...
do you want it to use machine learning, or a heuristic?
pallid badge
left tartan
I think you have a mistake in the code. You yield img_number with cache.pop(next...
@left tartan Thank you so much. You were absolutely right. There is the mistake, I did not see it.
Corrected version is now:
 def _ordered_recv(self, sock):
        cache = {}
        next_img_number = 0
        while True:
            current_img_number, current_result = sock.recv_pyobj()
            if current_img_number == next_img_number:
                yield (current_img_number, current_result)
                next_img_number += 1
                while next_img_number in cache:
                    next_result = cache.pop(next_img_number)
                    yield (next_img_number, next_result)
                    next_img_number += 1
            else:
                cache[current_img_number] = current_result
This one makes sense in case you have a live queue, where images from a detector come in and should be displayed in the correct order. It could also happen that a scan stops and we don't want the final file to have empty places.
If order does not matter, the unordered version is ok, the target file gets filled because (img_number, result) travel together and I can identify the image and the location in the final file with img_number.
pallid badge
left tartan
But regardless, I don’t think this is a good approach. If img number 0 comes las...
Maybe this is not possible. If we scan, we get for example 300.000 images ore more. Not easy to keep in memory and maybe one would not like to have too many files flying around. I have to admit I don't know well the process detector --> outputfile. I always get the output file which I have to convert to something else. My current converted file is 300GB large
turbid fox
serene scaffold
do you want it to use machine learning, or a heuristic?
machine learning, not hard-coded
pallid badge
@left tartan I check now ordered and ordered_fix and let you know, but it looked good on the first glance
serene scaffold
turbid fox
machine learning, not hard-coded
then I wouldn't recommend this as a first project.
turbid fox
serene scaffold
then I wouldn't recommend this as a first project.
not my first project, im just looking for resources
serene scaffold
turbid fox
not my first project, im just looking for resources
what other projects have you done?
 sterile nebula
do python have a library that can match similar lookin charts?
desert oar
turbid fox
not my first project, im just looking for resources
This isn't really my area of expertise, but you can probably find something that somebody has put together using reinforcement learning if you search around, maybe based on AlphaZero. however you should keep in mind that there is a long history of chess playing algorithms that don't use "machine learning" in the modern sense, which you also might want to look into
yeah it seems like AlphaZero has been used for chess since 2017, you should be able to find at least something about using it in python
 rocky vortex
Minmax (sometimes Minimax, MM or saddle point) is a decision rule used in artificial intelligence, decision theory, game theory, statistics, and philosophy for minimizing the possible loss for a worst case (maximum loss) scenario. When dealing with gains, it is referred to as "maximin" – to maximize the minimum gain. Originally formulated for se...
this is what stockfish uses if i remember correctly
 civic elm
Hmm a really nice project would be a voice activated chess
No board just voice haha
Woah that would be cool time to learn RNNs
turbid fox
desert oar
This isn't really my area of expertise, but you can probably find something that...
thanks 🙂
pale hemlock
Could Chatgpt3 interact with this model by its self?
ChatGPT
Yes, GPT-3 can interact with your tensor-based model by itself. GPT-3 is capable of processing and generating text, which means it can send text inputs to your model and receive responses from it. This interaction would involve GPT-3 generating prompts that are formatted in a way that your tensor-based model can understand and interpret.
@desert oar ive gotten somewhere i hope this changes your preception on what i may or may not understand
the neuro network model
 golden haven
If anyone is good with python selenium here and you have a moment please check my post on python help page, just posted it there ❤️
civic elm
anyone using a mac? my jupyter notebook kernel is using the /usr/bin/python3 where it should be the anaconda python. I don't know how to fix this
 north rain
@brittle radishplease don't post advertisements like that in this server
 dry flame
need advice on NLP books
so I'm eyeing some books as a handbook to guide me in learning NLP with libraries like spacy, nltk etc (let's assume i know nothing of NLP). right now i have these 3 books listed. but i wonder if there are better books for complete beginners?


 opaque idol
I just finished learning Python. I want to start learning how to train ai agents to play a game. Can anyone link me somewhere and explain how should I start doing that?
 wraith heart
📣 I've just published an in-depth article on Stable Diffusion, an AI technology that's transforming the way we deal with noisy data. 🌟
🔍 What's Stable Diffusion?
🧠🔬 The Science Behind It
🎓 Get Hands-On
The tutorial includes a step-by-step guide on setting up Stable Diffusion, so you can get started on your own projects.
Let me know what you think!
Medium
Beyond the Hype: Practical Tutorial to Stable Diffusion and Its Impact on Tech
 fallow frost
does DuckDB have query parameters?
weak mortar
Hi guys. I have a few issues with pandas.style.background_color function. Which topic will you suggest me to ask in?
or is it better i open a thread in python help?
boreal gale
weak mortar
Hi guys. I have a few issues with pandas.style.background_color function. Which ...
here or thread in python help are both fine
weak mortar
my problem is that i am coloring my table with heatmap, but i only want to apply it to specific rows. you can add subset="column name" to target specific columns, but it will always target columns, not rows, despite setting axis to 0 or 1.
code:
metrics_html = combined_metrics.style.background_gradient(cmap='Greens',axis=0).to_html()

as im very familiar with css, i tried overwriting the styles of the cells in the html, but due to the nature of how the colors are applied it is not possible to do
boreal gale
weak mortar
my problem is that i am coloring my table with heatmap, but i only want to apply...
have a read here: https://pandas.pydata.org/docs/reference/api/pandas.io.formats.style.Styler.background_gradient.html
in particular:
subset:  label, array-like, IndexSlice, optional
A valid 2d input to DataFrame.loc[<subset>], or, in the case of a 1d input or single key, to DataFrame.loc[:, <subset>] where the columns are prioritised, to limit data to before applying the function.
here is an example to get what you wanted:
import pandas as pd

import numpy as np

arr = np.random.randint(1, 100, size=(10, 10))

df = pd.DataFrame(arr)

df.style.background_gradient(cmap='Greens', subset=([3,4], slice(0, None)), axis=0)
okay thanks let me try that right away. i tried with the slice thing and apply and applymap last night, but the slice stuff was confusing for me.
boreal gale
you don't even need slice actually..
df.style.background_gradient(cmap='Greens', subset=([3,4], ), axis=0) will do just fine
weak mortar
thats basically what i was already doing. it still only searches the columns for 3 and 4 here, it cannot search the rows
boreal gale
weak mortar
thats basically what i was already doing. it still only searches the columns for...
n.b.
subset:  label, array-like, IndexSlice, optional
A valid 2d input to DataFrame.loc[<subset>], or, in the case of a 1d input or single key, to DataFrame.loc[:, <subset>] where the columns are prioritised, to limit data to before applying the function.
 weak mortar
how you make it work on rows though, it says it looks through columns 🤷
your example works. just figuring out how to make it also work on my df
boreal gale
hmm? i though the documentation is quite clear already 🤔
unless you weren't aware there is a difference between [3,4] and ([3,4], )?
weak mortar
yes i was totally unaware of that 🙂
i see that you thereby are targeting rows , i just didnt go further with that because it always said it was searching cols
boreal gale
ah! okay, you can experiment with df.loc[<whatever-you-put-as-subset>] to see what it will target (in the 2D case according to the docs)
but if it's 1D then it's df.loc[:, <subset>]
what a weird API.. 🤷♂️
weak mortar
okay case solved. thank you very much!
combined_metrics.style.background_gradient(cmap='Greens', subset=(["opti","bt1","bt2","bt3","bt4"], ), axis=0).to_html()
yesterday i was so close, litereally just had to put ", " after the ]
latent remnant
anyone familiar with Power Bi?
pale hemlock
IF anyone is truly interested, patient, willing to listen to a reasonable implementation of working on a novel concept of Machine learning and AI.. please by all means message me
serene scaffold
latent remnant
anyone familiar with Power Bi?
be sure to always ask a complete question that someone who knows the answer could start answering
opaque idol
opaque idol
I just finished learning Python. I want to start learning how to train ai agents...
Can someone please answer my question?
 umbral charm
import numpy as np
import math
import pandas as pd
from pandas.plotting import scatter_matrix
import scipy
import matplotlib.pyplot as plt
from scipy.stats import *
pd.set_option('display.max_rows', None, 'display.max_columns', None, 'display.width', None)
housing = pd.read_csv(filepath_or_buffer = 'filepath')
print(housing)
why does this not print all of it, it prints from like 3000 - 13000
this is on pychamr btw maybe thats the issue
and i do have 13000 data points
mild dirge
Terminal has a maximum length @umbral charm
umbral charm
mild dirge
Terminal has a maximum length <@318024849333288960>
Yea
was thinking this, anyway to solve?
or do i just have to use like IDLE
mild dirge
I don't think you ever need to print over 10k lines probably.
Could print to a text file
umbral charm
That is true, its just useful to see if it works
mild dirge
But probably better to only print the useful info
umbral charm
yea would be but i like to visualise everything just incase
mild dirge
Maybe there is a setting to change the maximum line count
But you'd need to look around in the settings
umbral charm
mild dirge
But you'd need to look around in the settings
I have 'override conscle cycle buffer size'
would that be it?
wooden sail
printing out 10k lines of text is one of the worst ways of visualizing anything
make a plot of the stuff you care about
mild dirge
umbral charm
I have 'override conscle cycle buffer size'
Probably. But is it possible to make a plot instead?
You're not going to read through 10k lines in les than a few hours 😛
 tidal bough
wooden sail
printing out 10k lines of text is one of the worst ways of visualizing anything
tidal bough
wooden sail
printing out 10k lines of text is one of the worst ways of visualizing anything
i feel personally attacked
wooden sail
tidal bough
~~i feel personally attacked~~
that explains why you're always confused
umbral charm
mild dirge
You're not going to read through 10k lines in les than a few hours 😛
That is ture
Yea its fine i should be good with 10k lines
i was just curiuos, dealing with large datasts is a pain
oh
it worked
umbral charm
mild dirge
Probably. But is it possible to make a plot instead?
thanks!
mild dirge
It was edds suggestion 👌🏽
unique ether
What is the most important mathematical formula in ML?
is it the Quadratic formula?
mild dirge
Really subjective. There is also the chain rule for backwards propagation
 verbal swan
unique ether
is it the Quadratic formula?
verbal swan
unique ether
is it the Quadratic formula?
Lol probably not
mild dirge
Lots of activation functions like tanh, ReLU, sigmoid etc.
Also pretty big
But yeah, not really a single answer 😛
verbal swan
I don't think there is a single most important formula, multiple statistical formulas are used
unique ether
Cheers everyone
umbral charm
housing['date'] = pd.to_datetime(housing['date'], format = '%d/%m/%Y')
housing2 = housing[(housing['date'] > '2016-12-01') and (housing['date'] < '2018-01-01')]
print(housing2)
why doesnt this work
' raise ValueError(
ValueError: The truth value of a Series is ambiguous. Use a.empty, a.bool(), a.item(), a.any() or a.all().'
 young granite
umbral charm
```py
housing['date'] = pd.to_datetime(housing['date'], format = '%d/%m/%Y')
hou...
young granite
umbral charm
```py
housing['date'] = pd.to_datetime(housing['date'], format = '%d/%m/%Y')
hou...
can u provide full traceback as code
umbral charm
young granite
can u provide full traceback as code
like u want my full code and full error?
young granite
only the full error i assume it results from line (2)?
unique ether
the traceback mate
left tartan
umbral charm
' raise ValueError(
ValueError: The truth value of a Series is ambiguous. Use...
Put parens around each side of the equation
(…) and (…)
umbral charm
Traceback (most recent call last):
  File "D:\Users\FatBoy\PycharmProjects\Coursera\Gali.py", line 11, in <module>
    housing2 = housing[(housing['date'] > '2016-12-01') and (housing['date'] < '2018-01-01')]
  File "C:\Users\FatBoy\bottle\lib\site-packages\pandas\core\generic.py", line 1466, in __nonzero__
    raise ValueError(
ValueError: The truth value of a Series is ambiguous. Use a.empty, a.bool(), a.item(), a.any() or a.all().
Oh sorry, you’re comparing to a string.
You want to compare the series to a date obj
umbral charm
When i put the '&' instead of and
it works
but i dont want to use '&' coz idk what it actual means i only know its a bitwise operator
left tartan
Oh and that too:
Each side of that AND is a boolean series.
You want the bitwise AND of the series… not the boolean AND which makes no sense: what is [10101010] and [00011010]?
A boolean AND operation would give you a True or a False, which makes no sense
Does that make any sense?
umbral charm
i see
so if [10101010] and [00011010]? makes no sense
what would [10101010] & [00011010] do
left tartan
What do you think it’ll do? Do you know anything about bitwise operations or boolean arithmetic?
umbral charm
nope nothing about bitwise operator, thats why i didnt want to use it
i also know that there is a pipe for OR bitwise
unique ether
doesn't & return everything that is in both lists?
left tartan
Let me demonstrate... one sec
left tartan
import pandas as pd
s1 = pd.Series([0, 1, 1, 0, 1])
s2 = pd.Series([1, 0, 1, 1, 0])
print(s1 & s2)
Yes
So, lookinga tyour original code:
You have series A which is : (housing['date'] > '2016-12-01') and series B which is: (housing['date'] < '2018-01-01')
unique ether
this would print 11111 right?
import pandas as pd
s1 = pd.Series([0, 1, 1, 0, 1])
s2 = pd.Series([1, 0, 1, 1, 0])
print(s1 | s2)
So, you want all rows where A is True and B is True