#data-science-and-ml
1 messages · Page 18 of 1
 rigid bronze
 odd meteor
What are y'all thoughts on this? 🙄😒🤔

 serene scaffold
odd meteor
What are y'all thoughts on this? 🙄😒🤔
serene scaffold
odd meteor
What are y'all thoughts on this? 🙄😒🤔
they're just being silly
 lapis sequoia
Hi there! I am relatively new to data science.
I am currently participating in a kaggle competition to improve my skills.
I have made 2 predictive machine learning models using RandomForestClassifier and GradientBoostingClassifier. I managed to reach an accuracy of about 79%.
I was wondering, what can I do to increase this number? How do I get familiar with other algorithms and know when to use them? How do I know which parameters to tweak (e.g. number of estimators, leafs etc.)?
Any advice is highly appreciated!
serene scaffold
lapis sequoia
Hi there! I am relatively new to data science.
I am currently participating in ...
hey, these are good questions for a beginner to be asking, but we also need to know what those models are intended to do, and what the training data is.
odd meteor
In this case, a better alternative to Github would be DagsHub. You're allowed more than 150Mb file size on DagsHub. I haven't digged much into it but I've heard several good stuff about it from friends. It has a couple of advantages over Github (as regards doing ML, Deep Learning projects)
You might wanna explore the platform
https://dagshub.com/

DAGsHub
DAGsHub is where people create data science projects. Use DAGsHub to discover, reproduce and contribute to your favorite data science projects.
lapis sequoia
serene scaffold
hey, these are good questions for a beginner to be asking, but we also need to k...
Thanks for asking! I am participating in the Spaceship Titanic competition on Kaggle. There is a dataset containing information on passengers that all have a different destination/home planet, seat allocation and other passenger info recorded. The spaceship gets hit by an anomaly and some passengers disappear. Due to this hit, the computer got damaged and there is a lot of missing data. The goal is to predict which passengers did not reach their final destination.
Does this answer your question?
serene scaffold
lapis sequoia
Thanks for asking! I am participating in the Spaceship Titanic competition on Ka...
pretty much! do you have a link to the dataset?
odd meteor
serene scaffold
they're just being silly
It's evident that TensorFlow isn't particularly loved by many ML Research folks but I didn't expect such condescending remark from Yannick on someone's hardwork.
Yannick should have done better tbh!
lapis sequoia
serene scaffold
pretty much! do you have a link to the dataset?
Yes of course! https://www.kaggle.com/competitions/spaceship-titanic/data

Predict which passengers are transported to an alternate dimension
serene scaffold
lapis sequoia
Yes of course! https://www.kaggle.com/competitions/spaceship-titanic/data
what do you do with each feature?
lapis sequoia
serene scaffold
what do you do with each feature?
So I went for the rough prototyping strategy to get "quick" (still took me half a day) results. Hence I replaced most NaNs with "Missing". The NaN numerical values I have replaced by 0s due to the occurrence of 0s and the age I have set to the mode age (rather than the mean, as the age was not normally distributed).
I have also split "Cabin" into Deck and Side (tried to create a Num column as well but gave me errors). Furthermore I dropped the column Name due to high cardinality.
In other words, the model has plenty of options to improve on haha
serene scaffold
lapis sequoia
So I went for the rough prototyping strategy to get "quick" (still took me half ...
(tried to create a Num column as well but gave me errors)
it should be straightforward to expand that feature into three features. did you try debugging the error?
good idea dropping the Name. unless people with cooler names were more likely to live. in which case you'd still need to convert the name to a coolness score.
what about home planet, cryosleep, destination, vip, and all the spending ones?
 arctic wedgeBOT
@worthy hollow :white_check_mark: Your 3.11 eval job has completed with return code 0.
001 | ___ ___ ___ ___ ___ ___ ___ ___ ___ ___ ___ ___ ___ ___ ___ ___ ___ ___ ___
002 | 343 344 345 346 347 348 349 350 351 352 353 354 355 356 357 358 359 360 361
003 | 342 273 274 275 276 277 278 279 280 281 282 283 284 285 286 287 288 289 290
004 | 341 272 211 212 213 214 215 216 217 218 219 220 221 222 223 224 225 226 291
005 | 340 271 210 157 158 159 160 161 162 163 164 165 166 167 168 169 170 227 292
006 | 339 270 209 156 111 112 113 114 115 116 117 118 119 120 121 122 171 228 293
007 | 338 269 208 155 110 073 074 075 076 077 078 079 080 081 082 123 172 229 294
008 | 337 268 207 154 109 072 043 044 045 046 047 048 049 050 083 124 173 230 295
009 | 336 267 206 153 108 071 042 021 022 023 024 025 026 051 084 125 174 231 296
010 | 335 266 205 152 107 070 041 020 007 008 009 010 027 052 085 126 175 232 297
011 | 334 265 204 151 106 069 040 019 006 001 002 011 028 053 086 127 176 233 298
... (truncated - too many lines)
Full output: https://paste.pythondiscord.com/ewigumiyoh.txt?noredirect
lapis sequoia
serene scaffold
> (tried to create a Num column as well but gave me errors)
it should be straig...
Yes I did try to debug but didn't work because somehow I kept getting less columns in my train data compared to my test data.
About the latter columns I just replaced NaN with "Missing". You know, just to get the model to work
lapis sequoia
lapis sequoia
In other words, the model has plenty of options to improve on haha
Hey, I'm also a newbie and also working on this competition right now! Maybe we can exchange ideas with each other and see if that helps either of us
serene scaffold
lapis sequoia
Yes I did try to debug but didn't work because somehow I kept getting less colum...
so even if the feature was numeric, you replaced it with "Missing"?
lapis sequoia
lapis sequoia
Hey, I'm also a newbie and also working on this competition right now! Maybe we ...
Yes! That sounds cool!
lapis sequoia
serene scaffold
so even if the feature was numeric, you replaced it with "Missing"?
If the feature was numeric I replaced it with a 0 due to a high probability of the value being 0.
This is the distribution of RoomService for example: (using ProfileReport)
 serene scaffold
lapis sequoia
If the feature was numeric I replaced it with a 0 due to a high probability of t...
serene scaffold
lapis sequoia
If the feature was numeric I replaced it with a 0 due to a high probability of t...
okay. and you said that your models were taking a long time to train?
lapis sequoia
serene scaffold
okay. and you said that your models were taking a long time to train?
They might take a few minutes. It took a long time for me to get those models just because I am a noob haha
Probably better to normalize your data than to zero it all out
serene scaffold
lapis sequoia
They might take a few minutes. It took a long time for me to get those models ju...
oh okay. well first I would debug the part about Cabin. and then I would just use cryosleep, the three cabin features, and vip. and see how that goes.
lapis sequoia
lapis sequoia
Probably better to normalize your data than to zero it all out
I normalized it using StandardScaler but filled out the missing data with a 0. It is indeed not the best way but the likeliness can be considered quite high for a first estimate
lapis sequoia
serene scaffold
oh okay. well first I would debug the part about Cabin. and then I would just us...
And what should the goal of this be? Checking if a higher accuracy is possible with fewer columns?
serene scaffold
lapis sequoia
And what should the goal of this be? Checking if a higher accuracy is possible w...
yeah, some of the features might be creating noise.
lapis sequoia
I think VIP can be removed, I found no relationship between VIP and the target value
serene scaffold
well nevermind about vip then 😄
lapis sequoia
Is that general practice to play with the dataset first before considering a new model? Because how do I know what model I picked is the right one in the first place? 🤔
serene scaffold
on the real titanic, higher class passengers were more likely to live, so I thought maybe that was also true here.
serene scaffold
lapis sequoia
Is that general practice to play with the dataset first before considering a new...
yes, this is "e x p l o r a t o r y d a t a a n a l y s i s"
lapis sequoia
There was a slight relationship between homeplanet and target value but I don't know how to correctly encode it...

If you're planet 1, you're less likely to be transported, if you're from planet 0 you're more likely to be transported...
but how do I enter this in the model...
I tried one-hot-encoding and it didn't really help, but maybe I did it incorrectly
Good question, that would have probably been my follow up question after the "e x p l o r a t o r y d a t a a n a l y s i s"
It's 3 categorical values fyi, 0 is earth, 1 is europa, 2 is mars
Maybe I could encode 1 as 2, and 2 as 1 and that would create a linear relationship between likelihood of being transported and your planet
lapis sequoia
lapis sequoia
There was a slight relationship between homeplanet and target value but I don't ...
Using profilereport I get this:

3 different binary inputs for each of the planets maybe?
lapis sequoia
lapis sequoia
3 different binary inputs for each of the planets maybe?
I tried that and each of those 3 binary columns had even less correlation/mutual information than the homeplanet variable on its own
 worthy hollow
please guys try to give it a look, i been struggling so hard to find it out
lapis sequoia
Hmm
lapis sequoia
lapis sequoia
Using profilereport I get this:
interesting, I've never used profilereport before
Would highly recommend! Gives a lot of info about your dataset
lapis sequoia
lapis sequoia
Hmm
what do you think about putting planet 2 in the place of 1
wouldn't that create a somewhat linear relationship
but I'm sure there has to be a better way to do this
I mean looking at the graph it's kind of obvious there IS a relationship between homeplanet and the target variable... it's just that I don't know how to encode it and use the relationship in my model
 tight knoll
how do u add whitegrid to seaborn histplots?
worthy hollow
please lads i need one of your help <@&267630620367257601>
lapis sequoia
worthy hollow
**please lads i need one of your help** <@&267630620367257601>
How is making a spiral in any way machine learning related
worthy hollow
well i've been doing all my stuff here for a while and no one texted me this
i never did machine learning help there but altho a lot of good peoples here helped me
worthy hollow
lapis sequoia
How is making a spiral in any way machine learning related
in which topic where should it be you think bud?
worthy hollow
aight thanks i'll send it over there
 spare briar
this is autoregressive modeling with markov assumption
worthy hollow
lapis sequoia
<#782713858615017503> <#650401909852864553> <#971142229462777926>
posted all over, thanks
 warped laurel
does anyone know where can i find datasets to use for basic linear regression projects?
i used this
https://archive.ics.uci.edu/ml/datasets/Student+Performance but i can't find anything else this simple
rest is either way above my knowledge or not a csv file
serene scaffold
warped laurel
does anyone know where can i find datasets to use for basic linear regression pr...
kaggle
warped laurel
serene scaffold
kaggle
alright will check it out, thank you!
 wary hatch
Can anyone help me with the linear regression function? i keep getting an error saying statistics has no attribute linear regression.

 errant spindle
import collections
import csv

with open("covid.csv", 'r') as file:
    reader = DictReader(file)
    data = list(reader)

death_totals_by_country = collections.defaultdict(int)
for row in data:
    country = row["countriesAndTerritories"]
    deaths = int(row["deaths"])
    death_totals_by_country[country] += deaths

Population_totals_by_country = collections.defaultdict(int)
for row in data:
    country = row["countriesAndTerritories"]
    popData2019 = int(row["popData2019"])
    Population_totals_by_country[country] = popData2019```

What should i print if i want to know the deaths per 100000 habitants for each country ?Hi @serene scaffold ! I tried to add the Num column but it keeps failing when I am about to compute yhat

Do you know what it could be?
Anyone know if I should include noise in my input data or not? Have 28x28 pictures with values in [0,1]
serene scaffold
lapis sequoia
Hi <@253696366952316929> ! I tried to add the Num column but it keeps failing wh...
Sorry, but I won't look at screenshots of text.
lapis sequoia
serene scaffold
Sorry, but I won't look at screenshots of text.
What would you recomend? I'm trying to do a quickdraw recognizer
serene scaffold
lapis sequoia
What would you recomend? I'm trying to do a quickdraw recognizer
I was not speaking to you. Sorry.
lapis sequoia
I know, I just wanted to ask what you thought abt it
lapis sequoia
serene scaffold
Sorry, but I won't look at screenshots of text.
Is this better?
Feature names unseen at fit time:
- Num_1042
- Num_1110
- Num_1157
- Num_1182
- Num_1222
- ...
Feature names seen at fit time, yet now missing:
- Num_1000
- Num_1002
- Num_1007
- Num_1015
- Num_1023
- ...
Yes. Why do they all start with Num_? Are they strings?
also, I would find out if there are specific regions of the ship that were more affected, and transform this feature to reflect that.
lapis sequoia
serene scaffold
Yes. Why do they all start with `Num_`? Are they strings?
I split the Cabin into Deck Num Side. On all features I applied the one hot encode.
0      0001_01     Europa     False    TRAPPIST-1e  39.0    False          0.0        0.0           0.0     0.0     0.0        False        B        0        P
1      0002_01      Earth     False    TRAPPIST-1e  24.0    False        109.0        9.0          25.0   549.0    44.0         True        F        0        S
2      0003_01     Europa     False    TRAPPIST-1e  58.0     True         43.0     3576.0           0.0  6715.0    49.0        False        A        0        S
3      0003_02     Europa     False    TRAPPIST-1e  33.0    False          0.0     1283.0         371.0  3329.0   193.0        False        A        0        S
4      0004_01      Earth     False    TRAPPIST-1e  16.0    False        303.0       70.0         151.0   565.0     2.0         True        F        1        S
Num is indeed a string (mostly numbers but NaNs are replaced by "Missing")
@serene scaffold Ultimately I get this line:
ValueError: X has 1538 features, but StandardScaler is expecting 1850 features as input.
Could it be that scaling is the cause of lost data?
 dusk tide
I am reading a definition of deep neural networks and found a statement which i cannot understand . IT IS Deep neural networks are neural networks that use deep architectures.** The term "deep" refers to functions that have a higher number of layers and units in a single layer.** Can someone explain the sentence in bold in simple words.
 tropic matrix
here's the code:
for maximum_price in max_price_list:
    # unimportant code for getting the data for the specific max price (as filtered_items variable)

    # using keras.Sequence to avoid having all the data in ram at once
    all_ids = list(range(len(filtered_items)))
    train_ids, val_ids = train_test_split(all_ids, test_size=0.2)
    train_gen = DataGenerator(train_ids, batch_size=BATCH_SIZE)
    val_gen = DataGenerator(val_ids, batch_size=BATCH_SIZE, shuffle=False)

    total_train_batches = len(train_gen)
    total_val_batches = len(val_gen)

    # Build and train model
    model = dnn_model_builder(len(all_ids))

    model.fit(
        train_gen,
        batch_size=BATCH_SIZE,
        steps_per_epoch=total_train_batches//hvd.size(),
        epochs=100,
        callbacks=callbacks,
        validation_data=val_gen,
        validation_steps=total_val_batches,
        verbose=1 if hvd.rank() == 0 else 0,
    )

    model.load_weights('model.h5')
    model.build((len(df_columns),))
    model.save(f'output/model_up_to_{maximum_price}.h5', save_format='h5')
    tf.keras.backend.clear_session()
there's nothing really special that could be using the GPU ram other than the model.fit function, which has nothing abnormal about it
it seems like tf keras not clearing the used ram unless the kernel is restarted is a design flaw/bug
serene scaffold
lapis sequoia
I split the Cabin into Deck Num Side. On all features I applied the one hot enco...
You one hot encoded every single feature?
Like, every column? Or just those three?
lapis sequoia
serene scaffold
You one hot encoded every single feature?
Yes
serene scaffold
lapis sequoia
Yes
That's not good.
lapis sequoia
serene scaffold
That's not good.
How do you encode well? I use dummies for the encode but there is no way you can apply it to one column right?
        # Create feature columns
        # Drop identifier columns
        X = df.drop(['PassengerId','Transported'], axis=1)
        # One hot encode
        self.X = pd.get_dummies(X)
        # Create target column
        self.y = df['Transported']
Also, why wouldn't it work for Num if it works for all other columns? @serene scaffold
serene scaffold
lapis sequoia
How do you encode well? I use dummies for the encode but there is no way you can...
one hot encoding is for nominal features. "Age" is a perfect example of something that shouldn't be one-hot encoded
lapis sequoia
serene scaffold
one hot encoding is for nominal features. "Age" is a perfect example of somethin...
Ahh I see, but how do you exclude those from one hot encoding?
serene scaffold
lapis sequoia
Ahh I see, but how do you exclude those from one hot encoding?
at what point in your program are you one-hot encoding every column?
lapis sequoia
serene scaffold
at what point in your program are you one-hot encoding every column?
After preprocessing the data, and before creating test and train partitions
serene scaffold
lapis sequoia
After preprocessing the data, and before creating test and train partitions
Please show.
lapis sequoia
I created a class to create and handle the models
from sklearn.model_selection import train_test_split
from sklearn.model_selection import GridSearchCV
from ml_pipelines_setup import MLPipelines
import pandas as pd

class MLModels:
    def __init__(self,df):
        # Create feature columns
        # Drop identifier columns
        X = df.drop(['PassengerId','Transported'], axis=1)
        # One hot encode
        self.X = pd.get_dummies(X)
        # Create target column
        self.y = df['Transported']

    def create_partitions(self):
        # Create training and testing partition
        self.X_train, self.X_test, self.y_train, self.y_test = train_test_split(self.X, self.y, test_size=0.3,random_state=1234)

    def create_pipelines(self):
        # Create pipeline object
        self.PL = MLPipelines()
        # Create a dictionary to contain the various models
        self.fit_models = {}
        # Iterate through algorithms to create models
        for algo, pipeline in self.PL.pipelines.items():
            # Create model
            model = GridSearchCV(pipeline, self.PL.grid[algo], n_jobs=-1, cv=10)
            # Train model
            print(f"Training {algo} model...")
            model.fit(self.X_train, self.y_train)
            self.fit_models[algo] = model
This is the main code of the training part:
import pandas as pd
from pandas_profiling import ProfileReport
from preprocessing import PrepareDataframe
from ml_model import MLModels
from performance_model import Performance

# Create dataframe containing the training dataset
df = pd.read_csv('../spaceship-titanic-data/train.csv')

# Copy dataframe
abt = df.copy()

# Preprocess data before prediction
PrepareDataframe(abt).preprocessing()

# Develop models
C = MLModels(abt)
C.create_partitions()
C.create_pipelines()

# Evaluate performance
D = Performance(C)
D.evaluate()
Okay, so self.X = pd.get_dummies(X) is the line that is intended to one-hot encode every column
lapis sequoia
Yes
serene scaffold
you want to select only the nominal features for that. you can do X[['a', 'b', 'c']] to get a DataFrame with only the a, b, and c columns of X.
lapis sequoia
Ahh!
serene scaffold
these are more robust tools for feature encoding: https://scikit-learn.org/stable/modules/classes.html#module-sklearn.preprocessing

scikit-learn
This is the class and function reference of scikit-learn. Please refer to the full user guide for further details, as the class and function raw specifications may not be enough to give full guidel...
lapis sequoia
Thank you! So would the encoding cause this error?
serene scaffold
cause what error?
lapis sequoia
With the Num column
serene scaffold
ValueError: X has 1538 features, but StandardScaler is expecting 1850 features as input.
this one?
lapis sequoia
Yes!
Because even if it would make the model worse, I don't see why it wouldn't work
serene scaffold
if there's a room number that appears in the test set, but which never appears in the training set
or vice versa
which is likely to happen when you have 1500+ possible values
lapis sequoia
It is indeed very likely
Would that mean I cannot consider those in the model to begin with?
dusk tide
Can someone explain that why it's written that back propagation mechanism is not there in feed forward and neutral network??

 tidal bough
That sounds very weird indeed. They seems to be using "backpropagation", here, to mean feeding the outputs back to the inputs like recurrent neural networks do (and feedforward ones don't), rather than the more common meaning.
worthy hollow
Soemone has gave me a working code!!
worthy hollow
ok now that its done i need one last help
this code
#############################################################################

# SPIRAL MATRIX ALGORITHM FOR SQUARE OF 9

NORTH, S, W, E = (0, 1), (0, -1), (-1, 0), (1, 0) # directions
turn_left = {S: E, W: S, NORTH: W, E: NORTH} # old -> new direction

#############################################################################

def spiral(width, height):
    if width < 1 or height < 1:
        raise ValueError
    x, y = width // 2, height // 2 # start near the center
    dx, dy = NORTH # initial direction
    matrix = [[None] * width for _ in range(height)]
    count = 0
    while True:
        count += 1
        matrix[y][x] = count # visit
        # try to turn right
        new_dx, new_dy = turn_left[dx,dy]
        new_x, new_y = x + new_dx, y + new_dy
        if (0 <= new_x < width and 0 <= new_y < height and
            matrix[new_y][new_x] is None): # can turn right
            x, y = new_x, new_y
            dx, dy = new_dx, new_dy
        else: # try to move straight
            x, y = x + dx, y + dy
            if not (0 <= x < width and 0 <= y < height):
                return matrix # nowhere to go

def print_matrix(matrix):
    width = len(str(max(el for row in matrix for el in row if el is not None)))
    fmt = "{:0%dd}" % width
    for row in matrix:
        print(" ".join("_"*width if el is None else fmt.format(el) for el in row))

my_matrix = spiral(MASTER_WIDTH, MASTER_HEIGHT)

# PLOT GANN SQUARE OF 9

out_mat = my_matrix

cell_text = []
cell_colours = []
for i in range(MASTER_HEIGHT):
    cell_text.append([])
    cell_colours.append([])
    for j in range(MASTER_WIDTH):
        cell_text[i].append(str(out_mat[i][j]))
        if  i == j \
            or i == (18-j) \
            or j == (MASTER_WIDTH // 2) \
            or i == (MASTER_HEIGHT // 2):
            cell_colours[i].append("yellow")
        else:
            cell_colours[i].append("none")

fig, ax = plt.subplots()
fig.set_size_inches(12, 12, forward=True)

ax.get_xaxis().set_visible(False)
ax.get_yaxis().set_visible(False)
ax.axes.spines["left"].set_color(None)
ax.axes.spines["right"].set_color(None)
ax.axes.spines["top"].set_color(None)
ax.axes.spines["bottom"].set_color(None)
ax.set_aspect("equal")

table = plt.table(cellText=cell_text, cellColours=cell_colours, cellLoc="center", bbox=[0, 0, 1, 1])

plt.show()
plot this

now that i have the right matrix and the right form
may someone here please help me out to do a if statement or something else

using helio dataframe and the spiral matrix
I want to change the degrees by the planets from a df I already have, as the Earth is 355 then we replace the box "355" with "Ear" and the colour "purple" because it's helio (we have two different systems helio and geo values will be blue displayed in blue in the matrix)....
using this dataframe

if anyone could help me out that'd be very keen from you
 wind barn
wary hatch
Can anyone help me with the linear regression function? i keep getting an error ...
wind barn
wary hatch
Can anyone help me with the linear regression function? i keep getting an error ...
from sklearn.linear_model import LinearRegression
try importing from sklearn
 shell crest
wary hatch
Can anyone help me with the linear regression function? i keep getting an error ...
shell crest
wary hatch
Can anyone help me with the linear regression function? i keep getting an error ...
!d statistics.linear_regression
arctic wedgeBOT
statistics.linear_regression(x, y, /)```
Return the slope and intercept of [simple linear regression](https://en.wikipedia.org/wiki/Simple_linear_regression) parameters estimated using ordinary least squares. Simple linear regression describes the relationship between an independent variable *x* and a dependent variable *y* in terms of this linear function:

>  *y = slope * x + intercept + noise*
>
>   where `slope` and `intercept` are the regression parameters that are estimated, and `noise` represents the variability of the data that was not explained by the linear regression (it is equal to the difference between predicted and actual values of the dependent variable).

Both inputs must be of the same length (no less than two), and the independent variable *x* cannot be constant; otherwise a [`StatisticsError`](https://docs.python.org/3/library/statistics.html#statistics.StatisticsError "statistics.StatisticsError") is raised.That's not the complete docs, but it's added in 3.10
 plucky locust
anyone have experience with neural networks? i am a beginner and used a tutorial to make one to train using mnist but it doesnt seem to be learning
shell crest
I don't know about specifically training using MNIST, but you should probably show some code
wind barn
tight knoll
how do u add whitegrid to seaborn histplots?
sns.set_style("whitegrid")
Are you using a custom NN? PyTorch? TF?
plucky locust
from scratch
shell crest
That will make it hard for people to help but still code is better than nothing
wind barn
plucky locust
from scratch
there is a book mentioned in resources: https://nnfs.io/
arctic wedgeBOT
Hey @plucky locust!
You either uploaded a .txt file or entered a message that was too long. Please use our paste bin instead.
plucky locust
worthy hollow
```py
##########################################################################...
how do i display it like this
plucky locust
wind barn
there is a book mentioned in resources: https://nnfs.io/
oh yeah i dont have that book but i used the author's youtube tutorials to help me
@shell crest
shell crest
I rather not read raw code of a numpy-based NN :\ but I hope you find someone who helps you later
plucky locust
thats ok tyvm
wind barn
plucky locust
thats ok tyvm
colon is missing after function ```py
def init(self, inputs, neurons)
and its not reading from .csv file, getting error: FileNotFoundError: [Errno 2] No such file or directory: '/content/train.csv'
plucky locust
wind barn
colon is missing after function ```py
def __init__(self, inputs, neurons)
```
oh its there on the actual code, i accidentally edited it out
wind barn
make sure the directory path
plucky locust
im able to access the file but i had to download it myself which might be why u have the error
everything is working except when i run it the prediction accuracy remains around <10%
wind barn
plucky locust
everything is working except when i run it the prediction accuracy remains aroun...
hmm I dont have much exp. with NN but I would run the code with .csv and there is something with function logic or data set in csv that we can consider....or in the for loop part...
lapis sequoia
When I do .corr() I get a 0.33 correlation between 2 variables, but when I check their Mutual Information, I only get a 0.05 value.
Why is there such a big discrepancy, shouldn't the MI value be higher given that there's a relationship between the 2 variables?
 plush jungle
I've got a DC gan that looks like this
class Generator(nn.Module):
    def __init__(self, ngpu):
        super(Generator, self).__init__()
        self.ngpu = ngpu
        self.main = nn.Sequential(
            # input is Z, going into a convolution
            nn.ConvTranspose2d( nz, ngf * 8, 4, 1, 0, bias=False),
            nn.BatchNorm2d(ngf * 8),
            nn.ReLU(True),
            # state size. (ngf*8) x 4 x 4
            nn.ConvTranspose2d(ngf * 8, ngf * 4, 4, 2, 1, bias=False),
            nn.BatchNorm2d(ngf * 4),
            nn.ReLU(True),
            # state size. (ngf*4) x 8 x 8
            nn.ConvTranspose2d( ngf * 4, ngf * 2, 4, 2, 1, bias=False),
            nn.BatchNorm2d(ngf * 2),
            nn.ReLU(True),
            # state size. (ngf*2) x 16 x 16
            nn.ConvTranspose2d( ngf * 2, ngf, 4, 2, 1, bias=False),
            nn.BatchNorm2d(ngf),
            nn.ReLU(True),
            # state size. (ngf) x 32 x 32
            nn.ConvTranspose2d( ngf, nc, 4, 2, 1, bias=False),
            nn.Tanh()
            # state size. (nc) x 64 x 64
)```and the input images are all resized to 64x64
I want to change the size of the input images
but if I change the size, I get this error
raise ValueError(
ValueError: Using a target size (torch.Size([1])) that is different to the input size (torch.Size([25])) is deprecated. Please ensure they have the same size```am I correct in my understanding that this means I need to change the layers to match the new input size?
 main fox
lapis sequoia
When I do .corr() I get a 0.33 correlation between 2 variables, but when I check...
main fox
lapis sequoia
When I do .corr() I get a 0.33 correlation between 2 variables, but when I check...
What type of data are your two variables?

Cross Validated
I've seen a couple talks by non-statisticians where they seem to reinvent correlation measures using mutual information rather than regression (or equivalent/closely-related statistical tests).
I ...
 cinder sleet
#help-cupcake Can someone help me in this channel, im trying to understand how to use a custom colormap to use the fill_between function to make a gradient
 unborn inlet
whats a good module to see if 2 faces are the same?
 vocal folio
Hi I have a question
Are the projects listed here accurate?
https://data-flair.training/blogs/data-science-project-ideas/
I felt like they would be ML but it says Data Science
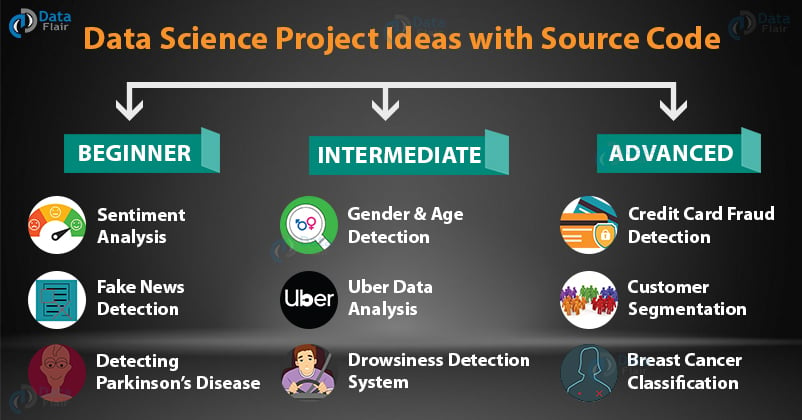
Work on real-time data science projects with source code and gain practical knowledge. Showcase your skills to recruiters and get your dream data science job. The data science projects are divided according to difficulty level - beginners, intermediate and advanced.
 compact hemlock
vocal folio
Hi I have a question
Are the projects listed here accurate?
https://data-flair.t...
compact hemlock
vocal folio
Hi I have a question
Are the projects listed here accurate?
https://data-flair.t...
from the image a beginner project is sentiment analysis. This is machine learning/IA
vocal folio
compact hemlock
from the image a beginner project is _sentiment analysis_. This is machine learn...
Yeah but is it not included in data science?
 tacit basin
vocal folio
Hi I have a question
Are the projects listed here accurate?
https://data-flair.t...
tacit basin
vocal folio
Hi I have a question
Are the projects listed here accurate?
https://data-flair.t...
What's the difference between ML and DS?
compact hemlock
vocal folio
Yeah but is it not included in data science?
it is, but ml is kinda the product
it uses the data already processed
 paper wharf
Hello, can you help on this issue : https://stackoverflow.com/questions/73769051/how-to-merge-detected-boxes-with-opencv

Stack Overflow
I wrote a code that can detect the differences between two pages, but I want the boxes close to each other to appear as a single box,I want to see it in the form of the purple box in the picture I ...
*link fixed
 woeful hedge
What is python reading this language as.
The 3 rules I made when starting it
Every variable/constant equals each other
For every variable I add, I must define the variable
For each variable within the defined variables added must be defined as well.
It essentially makes a complete body of knowledge and collection of data
Does python see the language as an enumeration of an enumeration or does it see it as a set of tuples or both. Or what else could python be interpreting it as? Let me know. I plan to make an AI with it.
https://docs.google.com/document/d/1AsC45oK5Zf1xeTJTrVZk2m-QoJ8pvDA1gFtpugMZxLA/edit?usp=drivesdk

Google Docs
POWER = "AMOUNT" STRENGTH = "LEVEL INTENSITY" ENGINE = "MOTOR IN WHICH AN OPERATOR USES TO POWER A SYSTEM" SCAN = "ANALYZE A SPECIFIC WORD OR FIELD AND OR GIVE DATA ON THE ASKED INFORMATION TO SEARCH FOR" ANALYZE = "READ AND LOOK OVER" IMMUNE = "DOES NOT AFFECT" DOMAIN = "AREA OWNED AND CONTROLLE...
plucky locust
wind barn
hmm I dont have much exp. with NN but I would run the code with .csv and there i...
u were right about the for loop, i made a neuralnetwork object inside the for loop which i assume was randomising the weights every time
now when i run my network i dont think its updating its predictions every time since the accuracy is staying the same. @ me if anyone replies
 celest vine
hey, I have sales data of 8 months of a product based company. The data contains sales records of headphones. So, I did Cohort analysis on it. So, the cohort chart looks like this
Jan 2022  3500  60  55  70
Feb 2022  4200  85  75
Mar 2022  2500  40
Apr 2022  3800
So, it's like Jan 2022 then repeat customers in Feb, Mar, Apr.
But I also want to include repeat customers of Jan as well. Means like this
Jan 2022 then repeat customers in Jan, Feb, Mar, Apr
How to to that?
 hoary wigeon
Can someone help me in doing job title clustering?
wind barn
hoary wigeon
**Can someone help me in doing job title clustering?**
you can get some idea from here:https://towardsdatascience.com/job-title-analysis-in-python-and-nltk-8c7ba4fe4ec6

Medium
A job title indicates a lot about someone’s role and responsibilities. It says if they manage a team, if they control a budget, and their…
wind barn
celest vine
hey, I have sales data of 8 months of a product based company. The data contains...
there is a function mentioned here for recurring customers: https://towardsdatascience.com/calculate-your-monthly-recurring-customer-by-cohort-analysis-3d39473482b7

Medium
Explain the calculation of recurring customers of your business using python data analytics.
celest vine
wind barn
there is a function mentioned here for recurring customers: https://towardsdatas...
Thanks
lapis sequoia
While I was feature engineering, I tried out the following code to impute missing data:
from sklearn.impute import SimpleImputer

imp_freq = SimpleImputer(strategy='most_frequent')
dataframe[dataframe.columns] = imp_freq.fit_transform(dataframe)
Unfortunately, although I manage to get a completely filled dataframe without any NaNs it gives me this error:
FitFailedWarning:
30 fits failed out of a total of 30.
The score on these train-test partitions for these parameters will be set to nan.
Does anyone know what it could be?
lapis sequoia
main fox
What type of data are your two variables?
https://stats.stackexchange.com/quest...
integers
 zenith hawk
hey, why fill between two y's is limited by x? I thought it was bc of nans but there arent any

nvm i just saw the values in array☠️
lapis sequoia
💀
 vapid crypt
Using MultiTrain to make model training and testing easier.
Learn how to use MultiTrain to train multiple regression models for a regression task
Analytics Vidhya Publication
https://www.analyticsvidhya.com/blog/2022/09/make-model-training-and-testing-easier-with-multitrain/

In this article, you will learn how to make model training and testing easier with the multitrain dataset.

About 3 days ago, I published a library called MultiTrain that makes model training and testing easier than you're used to.
With very few lines of code as…
 arctic cliff
Any Deep learning book recommendation which is beginner friendly? I am confused between resources and I don't seem to make any progress
hoary wigeon
what would be the best clustering algorithm for job_title clustering?
wind barn
arctic cliff
Any Deep learning book recommendation which is beginner friendly? I am confused ...
there is a book mentioned in resources: https://nnfs.io/
hoary wigeon
wind barn
you can get some idea from here:https://towardsdatascience.com/job-title-analysi...
need and unsupervised approach. I don't have labels
I want to categorize job titles and then provide a common label.
arctic cliff
wind barn
there is a book mentioned in resources: https://nnfs.io/
Thank you :D
What is time-series forcasting?
wind barn
hoary wigeon
need and unsupervised approach. I don't have labels
I want to categorize job ti...
not much that I know practically, but pls check this for unsupervised: https://towardsdatascience.com/k-means-clustering-for-unsupervised-machine-learning-afd96fbd37ac

Medium
The Pythonic Guide to Unsupervised Learning
wind barn
arctic cliff
What is time-series forcasting?
sry no idea..
 desert oar
arctic cliff
What is time-series forcasting?
desert oar
arctic cliff
What is time-series forcasting?
 desert oar
hoary wigeon
what would be the best clustering algorithm for job_title clustering?
desert oar
hoary wigeon
what would be the best clustering algorithm for job_title clustering?
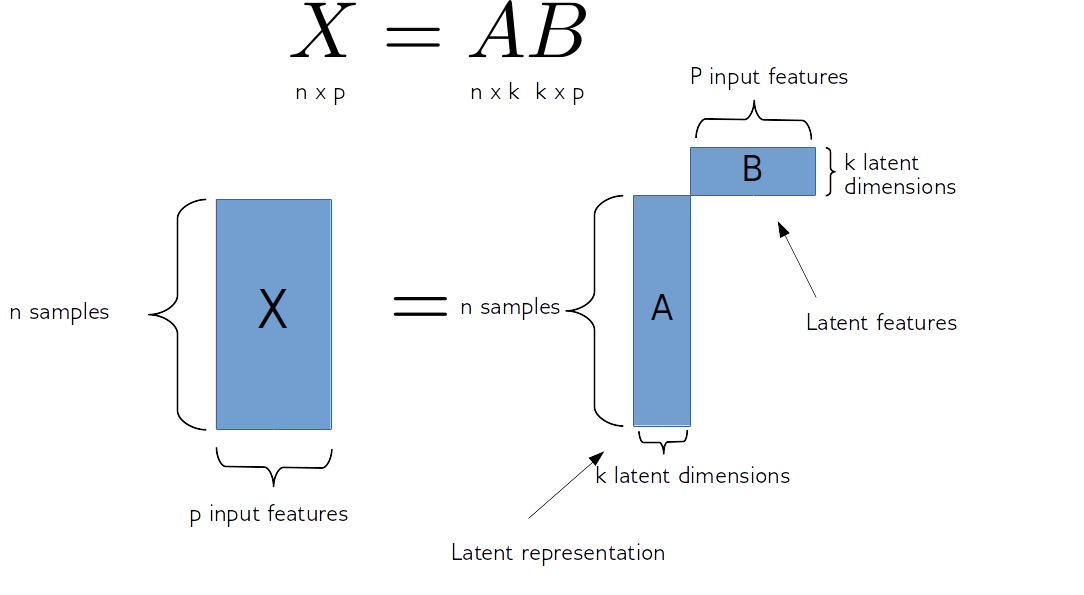
for clustering text, you usually want to perform dimension reduction first, and then perform clustering in the reduced space. i suggesting using NMF on count-vectorized text as a starting point for dimension reduction. avoid k-means in all cases imo. try hdbscan first instead
bag-of-words count vectorization -> NMF dim reduction -> HDSCAN or similar
https://scikit-learn.org/stable/modules/feature_extraction.html#text-feature-extraction
https://predictivehacks.com/non-negative-matrix-factorization-for-dimensionality-reduction/
https://hdbscan.readthedocs.io/en/latest/index.html
Dimensionality Reduction with Non-Negative Matrix Factorization
scikit-learn
The sklearn.feature_extraction module can be used to extract features in a format supported by machine learning algorithms from datasets consisting of formats such as text and image. Loading featur...
the hard part with text is always coming up with a tidy numerical representation of the text
worthy hollow
hey lads so i have one question now
Using 2 variable input i need to have this output below

here's the 2 Var_Inputs
VAR 1
!e ```py
import pandas as pd
from datetime import datetime
today = datetime.strftime(datetime.now(), "%d/%m/%Y")
VAR_1 = pd.DataFrame({"Date": [today],
"Earth": ["355"],
"Mer": ["338"],
"Ven": ["153"],
"Mar": ["31"],
"Jup": ["3"],
"Sat": ["322"],
"Ura": ["46"],
"Nep": ["354"],
"Plu": ["297"]
})
print(VAR_1)
@worthy hollow :white_check_mark: Your 3.11 eval job has completed with return code 0.
001 |          Date Earth  Mer  Ven Mar Jup  Sat Ura  Nep  Plu
002 | 0  19/09/2022   355  338  153  31   3  322  46  354  297
VAR 2
Pastebin
Pastebin.com is the number one paste tool since 2002. Pastebin is a website where you can store text online for a set period of time.
ok so VAR 2 is a spiral matrix of 361 numbers (degrees) and Var 1 is a dataframe containing the actual present day degrees of the various planets,
WHAT I NEED TO DO: change the corresponding planetary degree inside the spiral matrix to their planets, lets me explain: you have Earth = 355, so I want the "355" number inside the spiral matrix to be replaced by str('Ear'), for Mer it would be 338 that i'll replace inside the spiral matrix... I want to repeat this for every other planets and their matching degrees inside the spiral matrix. And then later on, when every planets is placed inside the spiral matrix according to their corresponding degrees, i'll want the plot code of the spiral matrix to display the planets case in purple inside the spiral matrix plot
worthy hollow
worthy hollow
should give final output like that if you manage to change in VAR 2 the matrix with their corresponding Planets / Degrees --- i've been trying to do this with an if statement but wasnt successful
Tell me if you don't understand it well with my words i'll try to rephrase the best I can
wind barn
desert oar
for clustering text, you usually want to perform dimension reduction first, and ...
thats more insights about same...I'm still in learning phase to differentiate the algos.. I wonder why cant we use K-means clustering using TfidfVectorizer & HashingVectorizer. And further for performing dimensionality reduction using LSA(latent semantic analysis) with TruncatedSVD ?
desert oar
wind barn
thats more insights about same...I'm still in learning phase to differentiate th...
k-means just generally sucks; it looks for spherical clusters and real world data is very rarely spherical, even after transforming to some low-dimensional dense feature space. also it's highly sensitive to initialization conditions and you still need to choose the correct number of clusters.
truncated svd is fine instead of non-negative matrix factorization; they should do a similar job. "non-negative" has some nice intuitive appeal for things like word counts in text.
there are some procedures for "fixing" k-means that use smart initialization settings and various metrics for choosing an optimal k, but imo it's not a good default choice for exploratory data analysis, despite being widely-available and easy to implement, because its output is sometimes "bad" and on high-dimensional non-numerical data it's very difficult to visually detect when the results come up bad
wind barn
desert oar
there are some procedures for "fixing" k-means that use smart initialization set...
hmm I see.... n_init=1 can still be used as long as the dimension of the vectorized space is reduced first to make k-means more stable.
desert oar
so "sucks" is maybe too strong. but i don't think it's a good place to start and i think it's best avoided unless you deeply understand how it works and how to make it less bad.
shell crest
desert oar
k-means just generally sucks; it looks for spherical clusters and real world dat...
Not really spherical clusters, it splits into Voronoi cells?
shell crest
desert oar
so "sucks" is maybe too strong. but i don't think it's a good place to start and...
I actually think it's a good place to start but not a good method to consider as a final product at all
desert oar
shell crest
Not really spherical clusters, it splits into Voronoi cells?
sure. in practice (in my experience) it either finds arbitrary "balls" or just arbitrarily segments the data into equal-size slices
shell crest
maybe I've never tried it with NLP as the context so I shouldn't say too much, but it's certainly very interpretable in just Euclidean-coordinate contexts
desert oar
shell crest
I actually think it's a good place to start but not a good method to consider as...
that's also fair. but i think its downsides are big enough that you shouldn't even touch it unless you have a very good understanding of its flaws
desert oar
shell crest
maybe I've never tried it with NLP as the context so I shouldn't say too much, b...
also valid. it's a lot easier to "debug" on e.g. 3 or 5 dimensions instead of ~10-100 which was reduced from 20k
worthy hollow
worthy hollow
anyone?
 wooden sail
hmm i would say they are neither balls nor equal-sized. the voronoi cell description was the most accurate
you made it sound more like a weber or sphere packing problem
lapis sequoia
How do I inerperet this data?
 unborn inlet
I am trying to make a program with a database of faces I have. The idea is that when a picture is supplied, it selects what face best matches the image, and returns the name. I am trying to use a lib called DeepFace but it takes a while and isn't really accurate, so I'm not sure the best way to proceed. Any ideas?
wind barn
unborn inlet
I am trying to make a program with a database of faces I have. The idea is that ...
for accuracy and speed you have to try with different detectors, here you can get the detailed info: https://github.com/serengil/deepface
GitHub
A Lightweight Face Recognition and Facial Attribute Analysis (Age, Gender, Emotion and Race) Library for Python - GitHub - serengil/deepface: A Lightweight Face Recognition and Facial Attribute Ana...
unborn inlet
wind barn
for accuracy and speed you have to try with different detectors, here you can ge...
thats just a link to the library i already talked about
wind barn
unborn inlet
thats just a link to the library i already talked about
hmm but it has covered all the possible methods for accuracy, RetinaFace and MTCNN specifically mentioned for accuracy, else the alignment of images matters....I didnt try with a code....seems an interesting project though...
unborn inlet
wind barn
hmm but it has covered all the possible methods for accuracy, RetinaFace and MTC...
oh ok ill check out RetinaFace thanks
i probably should have read more im sorry lol
wind barn
unborn inlet
i probably should have read more im sorry lol
hey no issues, I'm also learning...getting new project ideas..
dusk tide
In deep learning why we rescale all the images Between [-1 to +1] before feeding them to the model??
plush jungle
what's the difference between a batch and an epoch?
 hasty mountain
plush jungle
what's the difference between a batch and an epoch?
hasty mountain
plush jungle
what's the difference between a batch and an epoch?
A batch is a chunk of data, an epoch is an iteration(when every chunk of data has been passed through the model)
plush jungle
hasty mountain
A batch is a chunk of data, an epoch is an iteration(when every chunk of data ha...
but if you have 100 epochs and 10 batch size, isn't that the same thing as 10 epochs of 100 sized batches?
hasty mountain
plush jungle
but if you have 100 epochs and 10 batch size, isn't that the same thing as 10 ep...
Not exactly. When you pass 10 batch to a model, it'll take less time to train, as it'll be dealing with less data at once
I'm trying to think about an analogy, but my head isn't too good for this right now...
tidal bough
plush jungle
but if you have 100 epochs and 10 batch size, isn't that the same thing as 10 ep...
the latter takes 10 time more RAM 😛
 unique flame
But there is 100 epoch so still takes a while.
I just read somewhere that batch sweetspot is at 32, so I just use that
plush jungle
tidal bough
the latter takes 10 time more RAM 😛
ohhhh, so it's about parallelization?
batches can run at the same time, epochs cannot?
tidal bough
plush jungle
batches can run at the same time, epochs cannot?
Batch size is just... well, every iteration your model processes a tensor that might have a shape of (batch_size, width, height, channel_count) (for a model working on images) and output a result of shape (batch_size,) (if we assume just one output per picture). So batch size linearly increases the momentary RAM usage.
(You could just not use batches at all, but that'd require you to be able to load your entire dataset into RAM (and VRAM, if working on a videocard) at once, which is usually unfeasible)
How that affects the time per iteration - naively, linearly, so the time per epoch shouldn't depend on batch size much.
as for whether large or small batches are good, AFAIK "it's complicated". The smaller the batches, the "noisier" your model's trajectory is, but which can be bad (the model changes less strongly towards lower loss) or good (it means less getting stuck in local optima). So it's not just a performance thing.
hasty mountain
plush jungle
batches can run at the same time, epochs cannot?
Think about this: you have to calculate the values x where the polynomial P(x) is equal to 0:
P(x) = x^6 + 8x5 + 24x4 + 32x³ + 16x²
Is it easier to try to solve this problem by trying every single combination possible or is it easier to decompose P(x) so you can have easier parts to solve the problem, step by step?
P(x) = x² * (x-4)³ * (x+2)²
 wheat relic
plush jungle
batches can run at the same time, epochs cannot?
wheat relic
plush jungle
batches can run at the same time, epochs cannot?
yup
hasty mountain
When you pass a batch that is too great into an epoch, you're making your model deal with too much data at the same time. It has to solve many problems at once.
If you pass a small batch per epoch, you're breaking your problem into smaller parts, so it gets easier for your model to solve it
wheat relic
plush jungle
batches can run at the same time, epochs cannot?
but if you increase the batch size. Your ram usage will also increase.
plush jungle
I ask because this pytorch script seems to be making the batch size the entire length of the dataset no matter what I set the batch size to, and it doesn't seem to be slowing it down at all
so I'm wondering if it's worth fixing
hasty mountain
plush jungle
I ask because this pytorch script seems to be making the batch size the entire l...
Check the training loop and the DataLoader function
Pytorch usually uses a Dataloader function to separate the data into batches and load them into the model, as in Pytorch you have to do that when creating the training function.
plush jungle
batch_size = 64
dataloader = torch.utils.data.DataLoader(dataset, batch_size=batch_size,
shuffle=True, num_workers=workers)```seems right to me
hasty mountain
Indeed...
plush jungle
 wheat relic
plush jungle
seems right to me
wheat relic
plush jungle
seems right to me
how much ram do you have
plush jungle
wheat relic
how much ram do you have

if 2600 images were running concurrently, I would assume it would use more than 15gigs or ram, right?
but if it's not concurrent, then there's no difference between a batch and an epoch
hasty mountain
Hm...though I'm quite a fan of Pytorch, I don't really like using DataLoader...it used to throw me errors when I began learning Pytorch, so now I hate it
wheat relic
plush jungle
but if it's not concurrent, then there's no difference between a batch and an ep...
sure
hasty mountain
Try this:
def DataLoader(data, batch_size):
    for batch in range(0, len(data), batch_size):
        yield data[batch:min(batch+batch_size, len(data))]
If you're gonna use a single GPU, I don't see how this wouldn't be enough.
plush jungle
hasty mountain
If you're gonna use a single GPU, I don't see how this wouldn't be enough.
that's another thing I don't understand. my gpu never gets above 7% usage
why can't I max it out?
wheat relic
but if you face any issue try too change batch_size to 10 to 20
hasty mountain
plush jungle
that's another thing I don't understand. my gpu never gets above 7% usage
Oh...so there's something wrong there
wheat relic
for testing purpose.
plush jungle
hasty mountain
Have you installed pytorch with CUDA support?
this returns True
cuda = True if torch.cuda.is_available() else False```Have you passed your model to a cuda device?
plush jungle
if cuda:
    generator.cuda()
    discriminator.cuda()
adversarial_loss.cuda()```like this?
Tensor = torch.cuda.FloatTensor if cuda else torch.FloatTensor```netG = Generator().to(torch.device("cuda:0"))
you need this for it to be able to use the gpu?
then what does this do?
generator.cuda()```I think that perhaps you must assign generator.cuda() to a variable generator that will be your model
plush jungle
so this effectively does nothing?
generator = Generator()
if cuda:
    generator.cuda()
Maybe not
Maybe the right thing would be
if cuda:
  generator = Generator().cuda()
Try this and see how it goes
 rapid oriole
Hi, I'm studying in a data science related field and am learning Python but also R. I was wondering if there was a discord server similar to this one, but dedicated to R? I could really use some help. Thank you!
 dapper plume
rapid oriole
Hi, I'm studying in a data science related field and am learning Python but also...
dapper plume
rapid oriole
Hi, I'm studying in a data science related field and am learning Python but also...
i only know discoRd
plush jungle
hasty mountain
```py
netG = Generator().to(torch.device("cuda:0"))
```
I did this
plush jungle
hasty mountain
Maybe the right thing would be
```py
if cuda:
generator = Generator().cuda()
`...
and this
and neither one got my gpu usage above 7%
 dusty valve
why is tensorflow not showing the accuracy?

model.compile(optimizer='adamax', loss=tf.keras.losses.SparseCategoricalCrossentropy(from_logits=True), jit_compile=True)
model.fit(data, labels, epochs=10)```model is a keras.Sequential
also what's the difference between keras.Sequential.save and keras.Sequential.save_weights ?
plush jungle
plush jungle
and neither one got my gpu usage above 7%
ok it turns out my problem was that the task manager wasn't displaying cuda usage. gpu usage was actually fluctuating between 40% and 0
 supple wyvern
how do i load and use a keras file?
well, I mean like, I tried using teachable machine by google (tensorflow) then exported my model as keras file and tried using the snippit
but I'm not sure how it works
dusty valve
supple wyvern
how do i load and use a keras file?
you mean keras model?
supple wyvern
yes
dusty valve
from what i've done in the past, you do ```py
model = keras.Sequential(...) # layers here
model.compile('adam', 'loss here')
model.load_weights('PATH TO FILE')
Traceback (most recent call last):
File "c:\Users\Noah Ryu\Desktop\tensorflow\converted_keras\python.py", line 6, in <module>
model = load_model('keras_Model.h5')
File "C:\Users\Noah Ryu\AppData\Local\Programs\Python\Python310\lib\site-packages\keras\utils\traceback_utils.py", line 67, in error_handler
raise e.with_traceback(filtered_tb) from None
File "C:\Users\Noah Ryu\AppData\Local\Programs\Python\Python310\lib\site-packages\keras\saving\save.py", line 204, in load_model
raise IOError(f'No file or directory found at {filepath_str}')
OSError: No file or directory found at keras_Model.h5
I get this error
from keras.models import load_model
from PIL import Image, ImageOps
import numpy as np
Load the model
model = load_model('keras_Model.h5')
Create the array of the right shape to feed into the keras model
The 'length' or number of images you can put into the array is
determined by the first position in the shape tuple, in this case 1.
data = np.ndarray(shape=(1, 224, 224, 3), dtype=np.float32)
Replace this with the path to your image
image = Image.open('download.png')
#resize the image to a 224x224 with the same strategy as in TM2:
#resizing the image to be at least 224x224 and then cropping from the center
size = (224, 224)
image = ImageOps.fit(image, size, Image.ANTIALIAS)
#turn the image into a numpy array
image_array = np.asarray(image)
Normalize the image
normalized_image_array = (image_array.astype(np.float32) / 127.0) - 1
Load the image into the array
data[0] = normalized_image_array
run the inference
prediction = model.predict(data)
print(prediction)
using this
supple wyvern
dusty valve
from what i've done in the past, you do ```py
model = keras.Sequential(...) # la...
how do I make my code look like that?
worthy hollow
worthy hollow
Using 2 variable input i need to have this **output below**
anyone?
got 2 variable
VAR 1
!e ```py
import pandas as pd
from datetime import datetime
today = datetime.strftime(datetime.now(), "%d/%m/%Y")
VAR_1 = pd.DataFrame({"Date": [today],
"Earth": ["355"],
"Mer": ["338"],
"Sat": ["322"],
"Nep": ["354"],
})
print(VAR_1)
@worthy hollow :white_check_mark: Your 3.11 eval job has completed with return code 0.
001 |          Date Earth  Mer  Sat  Nep
002 | 0  19/09/2022   355  338  322  354
VAR2
!e ```py
import numpy as np
my_matrix_input = [[307,308,309, 310,311,312,313,314,315,316,317,318,319,320,321,322,323,324,325],[338,289,288,287,286,285,284,283,282,281,280,279,278,277,276,275,274,273,342],[361,360,359,358,357,356,355,354,353,352,351,350,349,348,347,346,345,344,343]]
print(my_matrix_input )```
arctic wedgeBOT
@worthy hollow :white_check_mark: Your 3.11 eval job has completed with return code 0.
[[307, 308, 309, 310, 311, 312, 313, 314, 315, 316, 317, 318, 319, 320, 321, 322, 323, 324, 325], [338, 289, 288, 287, 286, 285, 284, 283, 282, 281, 280, 279, 278, 277, 276, 275, 274, 273, 342], [361, 360, 359, 358, 357, 356, 355, 354, 353, 352, 351, 350, 349, 348, 347, 346, 345, 344, 343]]
and here is the OUTPUT
!e```py
import numpy as np
my_matrix_output = [[307,308,309, 310,311,312,313,314,315,316,317,318,319,320,321,"Sat",323,324,325],["Mer",289,288,287,286,285,284,283,282,281,280,279,278,277,276,275,274,273,342],[361,360,359,358,357,356,"Ear","Nep",353,352,351,350,349,348,347,346,345,344,343]]
print(my_matrix_output)```
arctic wedgeBOT
@worthy hollow :white_check_mark: Your 3.11 eval job has completed with return code 0.
[[307, 308, 309, 310, 311, 312, 313, 314, 315, 316, 317, 318, 319, 320, 321, 'Sat', 323, 324, 325], ['Mer', 289, 288, 287, 286, 285, 284, 283, 282, 281, 280, 279, 278, 277, 276, 275, 274, 273, 342], [361, 360, 359, 358, 357, 356, 'Ear', 'Nep', 353, 352, 351, 350, 349, 348, 347, 346, 345, 344, 343]]
WHAT I NEED TO DO: change the corresponding planetary degree inside the spiral matrix to their planets, lets me explain: you have Earth = 355, so I want the "355" number inside the spiral matrix to be replaced by str('Ear'), for Mer it would be 338 that i'll replace inside the spiral matrix... I want to repeat this for every other planets and their matching degrees inside the spiral matrix.
I've been struggling to find a solution online or make an if statement to do it... sorry for re asking here
wind barn
dusk tide
In deep learning why we rescale all the images Between [-1 to +1] before feeding...
range [-1,1] is zero-centered, which is further easier for the network to learn to standardize, also called the Tanh function...
 trail badge
hi everyone, How can I find python data science/data analyst open source projects that use certain libraries and also, Do i need to be assigned to an issue before we start working on OR we can just start working on it and fix it and then send them a merge request
 weary crown
im really confused 😦
Basically, I have a PyTorch model for KMNIST classification (95% acc) I'm trying to deploy to streamlit but get a weird pydantic error??
Code: https://github.com/Necl0/Bonsai (Included requirements.txt)
Error:
Traceback (most recent call last):

  File "/home/appuser/venv/lib/python3.9/site-packages/streamlit/runtime/scriptrunner/script_runner.py", line 556, in _run_script

    exec(code, module.__dict__)

  File "/app/bonsai/webapp.py", line 2, in <module>

    from main import *

  File "/app/bonsai/main.py", line 35, in <module>

    train_data = torchvision.datasets.KMNIST(root='../../data/',

  File "/home/appuser/venv/lib/python3.9/site-packages/torchvision/datasets/mnist.py", line 99, in __init__

    self.download()

  File "/home/appuser/venv/lib/python3.9/site-packages/torchvision/datasets/mnist.py", line 179, in download

    os.makedirs(self.raw_folder, exist_ok=True)

  File "/usr/local/lib/python3.9/os.py", line 215, in makedirs

    makedirs(head, exist_ok=exist_ok)

  File "/usr/local/lib/python3.9/os.py", line 215, in makedirs

    makedirs(head, exist_ok=exist_ok)

  File "/usr/local/lib/python3.9/os.py", line 225, in makedirs

    mkdir(name, mode)

PermissionError: [Errno 13] Permission denied: '../../data'```
GitHub
Hiragana classifier using KMNIST dataset with a PyTorch CNN hosted on streamlit.io as a webapp - GitHub - Necl0/Bonsai: Hiragana classifier using KMNIST dataset with a PyTorch CNN hosted on streaml...
 hallow ocean
dapper plume
i only know discoRd
hallow ocean
dapper plume
i only know discoRd
yup thats our server. You're welcome to join us @rapid oriole
lapis sequoia
weary crown
im really confused 😦
Basically, I have a PyTorch model for KMNIST classificat...
Looking in the wrong place for the data?
weary crown
yeah i see - i have to download the data to the repo or else its confused since the path isnt valid otherwise
desert oar
@rapid oriole you might want to check out https://discord.gg/JgFpP5k2 and https://discord.gg/uzwstRHB (caveat: i am a member of both)
rapid oriole
desert oar
<@314176610930655253> you might want to check out https://discord.gg/JgFpP5k2 an...
Thank you very much, very helpful!
 silver oriole
hello, anyone here have tried openvino model server ?
I trained the model for yolo v4 tiny using darknet and convert it to openvino then load it to model server openvino, But I have a hard time to digest the detected objects in model server. When trying to use directly to openvino runtime it can detect object. anyone here tried this model server ?
lapis sequoia
plush jungle
but if you have 100 epochs and 10 batch size, isn't that the same thing as 10 ep...
Just read this and didn’t like the answers but it’s a nested for loop
for i in range(0,epochs):
 for j in range(0,totaldatasize):
  currentBatch.forwardPropogate()
  currentBatch.backPropogate()
 End J
End I
A smaller batch size means forward propagating and backpropogating more total times, but the total amount of training you put your data through remains the same
plush jungle
but my understanding from the answers was that batches can be parallelized
which means it's not a nested for loop really, since each sample in a batch doesn't have to wait for the previous sample to finish propagating
lapis sequoia
I mean yeah if the library you’re using it is paralelizable then yeah you’re right
But if you have 2600 training images, depending on how big they are that will hardly matter that much.
I made my own network with just numpy and I’m too dumb to know how to implement paralelization but it’s still fast enough and accurate enough
plush jungle
lapis sequoia
I made my own network with just numpy and I’m too dumb to know how to implement ...
that's impressive though. you wrote the back propagation function too?
lapis sequoia
Why is it returning nans

 bold timber
anyone can explain about lr_scheduler equation?
 lapis sequoia
Why is it returning nans
lapis sequoia
lapis sequoia
Why is it returning nans
isn't it supposed to just return boolean
I dropped all the null values in that column already
Anything I should be worried about here?

 mental bane
lapis sequoia
Anything I should be worried about here?
mental bane
lapis sequoia
Anything I should be worried about here?
No, it's only suggesting you to use df.iloc[:,:] instead of the method you used.
Can someone help me understand why is the nan value not getting detected?

It's coming in the unique values but neither dropna nor np.where can detect it
lapis sequoia
How can I read in this excel file appropriately

I have not dealt with excel much. Just csvs
 charred cedar
you can read excel sheets into pandas dataframes fairly easily.
 shrewd grove
bold timber
anyone can explain about lr_scheduler equation?
shrewd grove
bold timber
anyone can explain about lr_scheduler equation?
10 to power (-4 + epoch/20)
lapis sequoia
whats this kinda plot called?
 tacit basin
lapis sequoia
whats this kinda plot called?
tacit basin
lapis sequoia
whats this kinda plot called?
Some kind of dotplot ? 🙂

Medium
A beautiful data visualisation speaks a thousand words. Inspired by a talk I saw by David Spiegelhalter last year I’ve created an easy to…
arctic wedgeBOT
Here's how to format Python code on Discord:
```py
print('Hello world!')
```
These are backticks, not quotes. Check this out if you can't find the backtick key.
 grave token
Guys, as you can see here... after some time val_accuracy stops increasing. How do i fix that?... There is no loss too.
 supple wyvern
dusty valve
Wdym
supple wyvern
dusty valve
Wdym
I mean like when pasting a code, the code's are in a different font
 lusty breach
00000
 scarlet moth
I am trying to merge "combined" and "teams" into one DF. Combined has 14092 rows x 34 columns and teams has 906 x 9 columns, so when I merge it, I expect 14092 rows x 41 columns as I am merging on "Teams and Years". But instead, as you can see in the "stats" ss I get 14149 columns and 42 rows. Hope someone can help please


 desert oar
scarlet moth
I am trying to merge "combined" and "teams" into one DF. Combined has 14092 rows...
desert oar
scarlet moth
I am trying to merge "combined" and "teams" into one DF. Combined has 14092 rows...
you did an outer join. this means that one of the tables has a duplicate value in one of your on columns, and/or that there is some non-overlap between the tables. also please share your code as text, images like this are almost impossible to read
!code see below for using code formatting:
arctic wedgeBOT
Here's how to format Python code on Discord:
```py
print('Hello world!')
```
These are backticks, not quotes. Check this out if you can't find the backtick key.
scarlet moth
desert oar
you did an outer join. this means that one of the tables has a duplicate value i...
stats = combined.merge(teams, how="outer",on=["Team", "Year"])```I have my 2 DF already made called combined and teams
And thats the line I used to try merge them together
desert oar
scarlet moth
```py
stats = combined.merge(teams, how="outer",on=["Team", "Year"])```
okay, thanks. do you understand my explanation of the problem?
try with inner join. if you get more than 906 rows in the result, then you know you have duplicates
actually try right join, that will tell you if you have duplicates in the left table
you can also just check with combined.duplicated(subset=["Team", "Year"]).any() and teams.duplicated(subset=["Team", "Year"]).any()
 clever flare
Anyone that have experience working with synthetic images in deep learning?
scarlet moth
desert oar
you can also just check with `combined.duplicated(subset=["Team", "Year"]).any()...
Thank you so much 
 violet gull
Anyone experience in neural nets that can help me troubleshoot mine? I would just post it here but I’ve been trying that and it just gets burried
desert oar
violet gull
Anyone experience in neural nets that can help me troubleshoot mine? I would jus...
don't ask to ask. if your post gets buried, it usually means at least of the following is true:
- nobody who saw it happened to know the answer
- you asked at a bad time (consider the active time zones of americans and western europeans; too busy or not busy enough could both be bad)
- you asked in the middle of another conversation
- your question was too complicated or ill-posed, and people didn't want to try to spend the time to understand it
- your question wasn't detailed enough and people didn't want to interview you to figure out what you meant
- it's actually a hard question and few people who hang out here regularly are likely to know the answer
violet gull
Yes
desert oar
there's no rule against reposting. the only time i personally get annoyed at "reposts" is when i or someone else spends a long time helping someone, and then the person posts the same exact question a day later as if they had never received any help. i find that incredibly disrespectful to the helper. otherwise, there's nothing else you can really do other than keep trying, and consider making your question easier to answer. if your question doesn't have a self-contained, easy-to-understand reproducible example, it's probably going to be hard to answer.
very often you solve the problem in the process of developing a self-contained example that demonstrates your problem
violet gull
Can someone have a look at this and lmk why it trains properly on X1 and y1 but won’t work on X2 and y2. https://github.com/Saratii/MLStuff
If you clone and run on x1 it will get to a really low loss and correct predictions but on X2 the loss is all over the place
And the predicted values are all equal
I already verified that they are the correct sized matrixes and have the same range of input values
The only difference between data I see is that there is more data in X2

GitHub
Contribute to Saratii/MLStuff development by creating an account on GitHub.
desert oar
violet gull
Can someone have a look at this and lmk why it trains properly on X1 and y1 but ...
this definitely falls into the "hard to answer" category
violet gull
Great
desert oar
you linked to an entire code repo and said "x1", i have no idea what that means or where to start looking
violet gull
The code repo is small, I just have no way of posting the code otherwise
desert oar
i, as someone who might be able to help, have no context for what you're working on or where i'm supposed to look in your code or what "properly" means
violet gull
x1 is defined in the code
desert oar
you can link to specific lines in github, or at least state which file and which line in which file
violet gull
Idk what line is the issue
desert oar
show the actual loss values you get, etc.
 desert oar
and what's the output on the "good" dataset?
how big are the two datasets? is this a binary classification problem or something else? is there class imbalance in one or both datsets? what are the features? (images?) what kind of model even is this?
violet gull
The loss on X1 is is 4.3e-05
No class imbalance
It’s training on cat and doggo images
desert oar
okay. my point is not necessarily that i have an answer, but that all of this is relevant info
"help debug my model" is probably one of the hardest things someone can help with in this channel
violet gull
Sorry idk what is useful and what isn’t
desert oar
i'm telling you what is useful!
violet gull
I know and I gave it
desert oar
how does the loss evolve as you run more epochs?
it bounces all over the place and doesn't go down steadily?
violet gull
Yes
desert oar
are you just training on two images?
violet gull
No
desert oar
how many images?
violet gull
12
desert oar
6 cats 6 dogs?
violet gull
Yes
desert oar
with something this bad, you'll want to debug your code before doing any "machine learning" investigation. visually inspect the processed images to make sure that your image processing code works. it also looks like you're using a plain fully-connected network. i have no idea if those should work at all on images
(image ML is not my domain)
how big are the layers?
desert oar
that makes me think you might have buggy code
violet gull
Then why does it work on the smaller data set
desert oar
since this model is not a CNN or anything special, i recommend generating a fake dataset of just 2 X dimensions and seeing if the model can classify that
desert oar
violet gull
Then why does it work on the smaller data set
hard to know until you debug further
violet gull
desert oar
since this model is not a CNN or anything special, i recommend generating a fake...
That’s what X1 y1 is
desert oar
violet gull
That’s what X1 y1 is
sure, but maybe something with more dimensions
how are you encoding the images? flattening them to a 1d array each?
desert oar
okay, using SGD with one image at a time?
worthy hollow
ok so
MASTER_WIDTH    = 19
MASTER_HEIGHT   = 19

degrees = helio[helio.Date == today].values.tolist()[0]
degrees.pop(0)
planets = ["Ear", "Mer", "Ven", "Mar", "Jup", "Sat", "Ura", "Nep", "Plu"]
planet_hash = dict(zip(degrees, planets))
planet_hash

matrix = [[307,308,309,310,311,312,313,314,315,316,317,318,319,320,321,322,323,324,325],[306,241,242,243,244,245,246,247,248,249,250,251,252,253,254,255,256,257,326],
[305,240,183,184,185,186,187,188,189,190,191,192,193,194,195,196, 197,258,327],[304,239,182,133,134,135,136,137,138,139,140,141,142,143,144,145,198,259,328],[303,238,181,132,91,92,93,94,95,96,97,98,99,100,101,146,199,260,329],
[302,237,180,131,90,57,58,59,60,61,62,63,64,65,102,147,200,261,330],[301,236,179,130,89,56,31,32,33,34,35,36,37,66,103,148,201,262,331],[300,235,178,129,88,55,30,13,14,15,16,17,38,67,104,149,202,263,332],
[299,234,177,128,87,54,29,12,3,4,5,18,39,68,105,150,203,264,333],[298,233,176,127,86,53,28,11,2,1,6,19,40,69,106,151,204,265,334],[297,232,175,126,85,52,27,10,9,8,7,20,41,70,107,152,205,266,335],
[296,231,174,125,84,51,26,25,24,23,22,21,42,71,108,153,206,267,336],[295,230,173,124,83,50,49,48,47,46,45,44,43,72,109,154,207,268,337],[294,229,172,123,82,81,80,79,78,77,76,75,74,73,110,155,208,269,338],
[293,228,171,122,121,120,119,118,117,116,115,114,113,112,111,156,209,270,339],[292,227,170,169,168,167,166,165,164,163,162,161,160,159,158,157,210,271,340],[291,226,225,224,223,222,221,220,219,218,217,216,215,214,213,212,211,272,341],
[290,289,288,287,286,285,284,283,282,281,280,279,278,277,276,275,274,273,342],[361,360,359,358,357,356,355,354,353,352,351,350,349,348,347,346,345,344,343]]
new_matrix = []

for row in matrix:
    x = []
    for i, degree in enumerate(row):
        if i < len(row):
            x.append(planet_hash[degree]) if degree in planet_hash.keys() else x.append(degree)
    new_matrix.append(x)

out_mat = new_matrix

cell_text = []
cell_colours = []
for i in range(MASTER_HEIGHT):
    cell_text.append([])
    cell_colours.append([])
    for j in range(MASTER_WIDTH):
        cell_text[i].append(str(out_mat[i][j]))
        if  i == j \
            or i == (18-j) \
            or j == (MASTER_WIDTH // 2) \
            or i == (MASTER_HEIGHT // 2):
            cell_colours[i].append("yellow")
        else:
            cell_colours[i].append("none")

fig, ax = plt.subplots()
fig.set_size_inches(15, 15, forward=True)

ax.get_xaxis().set_visible(False)
ax.get_yaxis().set_visible(False)
ax.axes.spines["left"].set_color(None)
ax.axes.spines["right"].set_color(None)
ax.axes.spines["top"].set_color(None)
ax.axes.spines["bottom"].set_color(None)
ax.set_aspect("equal")

table = plt.table(cellText=cell_text, cellColours=cell_colours, cellLoc="center", bbox=[0, 0, 1, 1])

for k, v in table._cells.items():
    v.set_edgecolor((0.7, 0.7, 0.7))

for i in range(10):
    ax.add_patch(Rect((2-0.1*i, 2-0.1*i), 0.2*i, 0.2*i, facecolor="none", edgecolor="black", lw=1.5))

plt.show()```this code plot

i just want now the Planets case ("Ear", "Nep", "Mer", etc...) to have a different background, make it purple (so it can be way more easier to read them)
do you have an idea how i could do this?
cell_text = []
cell_colours = []
for i in range(MASTER_HEIGHT):
    cell_text.append([])
    cell_colours.append([])
    for j in range(MASTER_WIDTH):
        cell_text[i].append(str(out_mat[i][j]))
        if  i == j \
            or i == (18-j) \
            or j == (MASTER_WIDTH // 2) \
            or i == (MASTER_HEIGHT // 2):
            cell_colours[i].append("yellow")
        else:
            cell_colours[i].append("none")
i think i have to add to the if statement something about the Planets inside the spiral matrix
but idk how to do it
the expected output should be this
 violet gull
Iterate through each tile and check if it’s a string
worthy hollow
violet gull
Iterate through each tile and check if it’s a string
how could I iterate over each tile? (sorry for those noobie questions)
violet gull
Probably the cell_text variable
worthy hollow
worthy hollow
```py
cell_text = []
cell_colours = []
for i in range(MASTER_HEIGHT):
cell_t...
ah honestly i'm lost, the code above is not my creation, i'm having a hard time understanding how to modifiy this part
worthy hollow
violet gull
Probably the cell_text variable
but you are right, that cannot be anything else than this variable
violet gull
Show results of print(cell_text) at the end of the code
worthy hollow
[['307', '308', '309', '310', '311', '312', '313', '314', '315', '316', '317', '318', '319', '320', '321', '322', 'Sat', '324', '325'], ['306', '241', '242', '243', '244', '245', '246', '247', '248', '249', '250', '251', '252', '253', '254', '255', '256', '257', '326'], ['305', '240', '183', '184', '185', '186', '187', '188', '189', '190', '191', '192', '193', '194', '195', '196', '197', '258', '327'], ['304', '239', '182', '133', '134', '135', '136', '137', '138', '139', '140', '141', '142', '143', '144', '145', '198', '259', '328'], ['303', '238', '181', '132', '91', '92', '93', '94', '95', '96', '97', '98', '99', '100', '101', '146', '199', '260', '329'], ['302', '237', '180', '131', '90', '57', '58', '59', '60', '61', '62', '63', '64', '65', '102', '147', '200', '261', '330'], ['301', '236', '179', '130', '89', '56', '31', 'Mar', '33', '34', '35', '36', '37', '66', '103', '148', '201', '262', '331'], ['300', '235', '178', '129', '88', '55', '30', '13', '14', '15', '16', '17', '38', '67', '104', '149', '202', '263', '332'], ['299', '234', '177', '128', '87', '54', '29', '12', 'Jup', '4', '5', '18', '39', '68', '105', '150', '203', '264', '333'], ['298', '233', '176', '127', '86', '53', '28', '11', '2', '1', '6', '19', '40', '69', '106', '151', '204', '265', '334'], ['Plu', '232', '175', '126', '85', '52', '27', '10', '9', '8', '7', '20', '41', '70', '107', '152', '205', '266', '335'], ['296', '231', '174', '125', '84', '51', '26', '25', '24', '23', '22', '21', '42', '71', '108', '153', '206', '267', '336'], ['295', '230', '173', '124', '83', '50', '49', '48', '47', 'Ura', '45', '44', '43', '72', '109', '154', '207', '268', '337'], ['294', '229', '172', '123', '82', '81', '80', '79', '78', '77', '76', '75', '74', '73', '110', '155', '208', '269', '338'], ['293', '228', '171', '122', '121', '120', '119', '118', '117', '116', '115', '114', '113', '112', '111', 'Ven', '209', '270', '339'], ['292', '227', '170', '169', '168', '167', '166', '165', '164', '163', '162', '161', '160', '159', '158', '157', '210', '271', '340'], ['291', '226', '225', '224', '223', '222', '221', '220', '219', '218', '217', '216', '215', '214', '213', '212', '211', '272', '341'], ['290', '289', '288', '287', '286', '285', '284', '283', '282', '281', '280', '279', '278', '277', '276', '275', '274', '273', '342'], ['361', '360', '359', '358', 'Ear', '356', '355', 'Nep', '353', '352', '351', '350', '349', '348', '347', 'Mer', '345', '344', '343']]```sorry i can’t type this well I’m on phone but
for i in range(len(cell_text)):
try: int(cell_text[i])
except: cell_colors[i] = ‘purple’
Of course the proper way would just to find where the cell colors is being appended but that’s hard for me to do on phone
worthy hollow
worthy hollow
```py
cell_text = []
cell_colours = []
for i in range(MASTER_HEIGHT):
cell_t...
where shall i put it
like this?
worthy hollow
ah ok wait lemme try
violet gull
Bruh
worthy hollow
added here but nothing change sadly
 violet gull
Welp I gtg but my question is now buried anyway 😭
violet gull
worthy hollow
added here but nothing change sadly
the array is empty at that point, u gotta put it before the tiles are drawn
Try 79
worthy hollow
violet gull
Try 79
in 79 it brings this error: ```py
ValueError Traceback (most recent call last)
~\AppData\Local\Temp/ipykernel_14464/160989366.py in <module>
78 except: cell_colours[i] = 'purple'
79
---> 80 table = plt.table(cellText=cell_text, cellColours=cell_colours, cellLoc="center", bbox=[0, 0, 1, 1])
81
82 for k, v in table._cells.items():
~\AppData\Roaming\Python\Python39\site-packages\matplotlib\pyplot.py in table(cellText, cellColours, cellLoc, colWidths, rowLabels, rowColours, rowLoc, colLabels, colColours, colLoc, loc, bbox, edges, **kwargs)
3175 colLoc='center', loc='bottom', bbox=None, edges='closed',
3176 **kwargs):
-> 3177 return gca().table(
3178 cellText=cellText, cellColours=cellColours, cellLoc=cellLoc,
3179 colWidths=colWidths, rowLabels=rowLabels,
~\AppData\Roaming\Python\Python39\site-packages\matplotlib\table.py in table(ax, cellText, cellColours, cellLoc, colWidths, rowLabels, rowColours, rowLoc, colLabels, colColours, colLoc, loc, bbox, edges, **kwargs)
750 for row in cellColours:
751 if len(row) != cols:
--> 752 raise ValueError("Each row in 'cellColours' must have {} "
753 "columns".format(cols))
754 else:
ValueError: Each row in 'cellColours' must have 19 columns
Show modified code
But I gtg my class just started, if anyone can take a look at my question that would be great
worthy hollow
violet gull
Show modified code
for i in range(MASTER_HEIGHT):
    cell_text.append([])
    cell_colours.append([])
    for j in range(MASTER_WIDTH):
        cell_text[i].append(str(out_mat[i][j]))
        if  i == j \
            or i == (18-j) \
            or j == (MASTER_WIDTH // 2) \
            or i == (MASTER_HEIGHT // 2):
            cell_colours[i].append("yellow")
        else:
            cell_colours[i].append("none")

fig, ax = plt.subplots()
fig.set_size_inches(15, 15, forward=True)

ax.get_xaxis().set_visible(False)
ax.get_yaxis().set_visible(False)
ax.axes.spines["left"].set_color(None)
ax.axes.spines["right"].set_color(None)
ax.axes.spines["top"].set_color(None)
ax.axes.spines["bottom"].set_color(None)
ax.set_aspect("equal")

for i in range(len(cell_text)):
    try: int(cell_text[i])
    except: cell_colours[i] = 'purple'

table = plt.table(cellText=cell_text, cellColours=cell_colours, cellLoc="center", bbox=[0, 0, 1, 1])

for k, v in table._cells.items():
    v.set_edgecolor((0.7, 0.7, 0.7))

for i in range(10):
    ax.add_patch(Rect((2-0.1*i, 2-0.1*i), 0.2*i, 0.2*i, facecolor="none", edgecolor="black", lw=1.5))
nvm thanks a lot for your time!!!!
wind barn
desert oar
<@314176610930655253> you might want to check out https://discord.gg/JgFpP5k2 an...
Hi there, just to know how can I join this data science server? -thanks
 sturdy light
Right now, I have two identical OpenCV neural network models in Python. These models are fed images from two different sources. The detections and the image reads are done in a thread pool and popped off as they're finished. So when one detection is finished, it'll queue the next one using the most recently read image. The hardware is struggling to do this in a reasonable time, so I want to try to use a single model for both inputs.
There are few different ways I can do this. First is to just toggle which image I read from each detection. What I'm curious about though is what would happen if I were to create the model and then have two references to that model. If I feed a new image to that model while it's still processing the old one, what's going to happen? I'm completely unsure.
violet gull
violet gull
Help pls
hasty mountain
violet gull
Can someone have a look at this and lmk why it trains properly on X1 and y1 but ...
X1 and y1 are both numerical arrays, right?
While X2 and y2 are both string arrays?
violet gull
np.array makes them into floats
hasty mountain
And you're flattening both X1 and X2 when you input them into the network, since you're not getting an error, afterall...
hasty mountain
np.array automatically converts string arrays into floats arrays?
hasty mountain
Oh, nevermind, now I see that .txt file is full of numbers
violet gull
You can clone it and mess with the input data, neurons, and iterations if that will help at all
hasty mountain
violet gull
You can clone it and mess with the input data, neurons, and iterations if that w...
Does this problem happens every time you run your code?
The way you're initializing your weights can make them begin with very different values, so the training performance may vary.
violet gull
The small data set consistently works, the bigger one consistently doesn’t
hasty mountain
Uh, then I don't know
Sometimes, when I run my Numpy Network, the way the weights are initialized may cause it to require more or less epochs to achieve good performance
violet gull
Still the loss should be going down
hasty mountain
violet gull
Still the loss should be going down
Is X2 composed of big images?
Like...larger than 100x100?
violet gull
Exactly 100x100
hasty mountain
Oh...then there's a bug there. 100x100 should still be working
violet gull
🙂
hasty mountain
hasty mountain
Sometimes, when I run my Numpy Network, the way the weights are initialized may ...
Though I admit the farthest I've gone in terms of big data was using an audio file...
But it had more data than an 100x100x3 image and it did well...
hasty mountain
Then Idk
violet gull
Sadge
worthy hollow
--------> https://paste.pythondiscord.com/vazuluxina this code generates me a spiral matrix output which is: https://ibb.co/VJTPzFV
** i just want now the Planets case ("Ear", "Nep", "Mer", etc...) to have a different background, make it purple (so it can be way more easier to read them) do you have an idea how I could do this?**
cell_text = []
cell_colours = []
for i in range(MASTER_HEIGHT):
    cell_text.append([])
    cell_colours.append([])
    for j in range(MASTER_WIDTH):
        cell_text[i].append(str(out_mat[i][j]))
        if  i == j \
            or i == (18-j) \
            or j == (MASTER_WIDTH // 2) \
            or i == (MASTER_HEIGHT // 2):
            cell_colours[i].append("yellow")
        else:
            cell_colours[i].append("none")
I think i have to add to the if statement something about the Planets inside the spiral matrix but idk how to do it
the expected output should be this: https://ibb.co/MCtY2cb
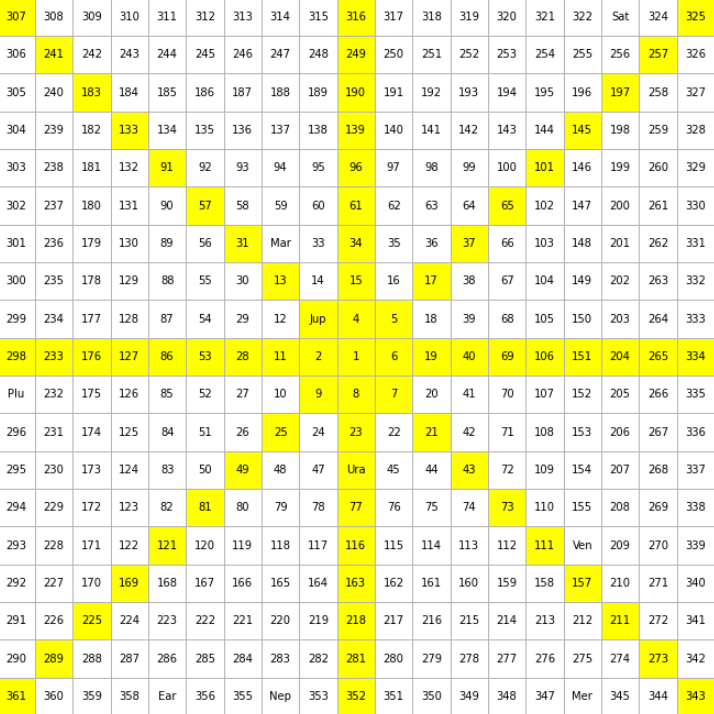 violet gull
i already told u how to implement that and even wrote code
and thats not data science
and its not even ur code
worthy hollow
violet gull
i already told u how to implement that and even wrote code
yay but didnt work or sorry i meant idk how to reproduce it right
worthy hollow
violet gull
and its not even ur code
yea never said it was i got helped
violet gull
the point is u are trying to do really basic stuff on advanced code
worthy hollow
violet gull
the point is u are trying to do really basic stuff on advanced code
yeah its what i lack
violet gull
u need to actually learn python
then figure out how the code works
and once u know how the code works u can modify it
worthy hollow
ikr i did my best this summer
worthy hollow
implemented code
MASTER_WIDTH    = 19
MASTER_HEIGHT   = 19

degrees = helio[helio.Date == today].values.tolist()[0]
degrees.pop(0)
planets = ["Ear", "Mer", "Ven", "Mar", "Jup", "Sat", "Ura", "Nep", "Plu"]
planet_hash = dict(zip(degrees, planets))
planet_hash

matrix = [[307,308,309,310,311,312,313,314,315,316,317,318,319,320,321,322,323,324,325],[306,241,242,243,244,245,246,247,248,249,250,251,252,253,254,255,256,257,326],
[305,240,183,184,185,186,187,188,189,190,191,192,193,194,195,196, 197,258,327],[304,239,182,133,134,135,136,137,138,139,140,141,142,143,144,145,198,259,328],[303,238,181,132,91,92,93,94,95,96,97,98,99,100,101,146,199,260,329],
[302,237,180,131,90,57,58,59,60,61,62,63,64,65,102,147,200,261,330],[301,236,179,130,89,56,31,32,33,34,35,36,37,66,103,148,201,262,331],[300,235,178,129,88,55,30,13,14,15,16,17,38,67,104,149,202,263,332],
[299,234,177,128,87,54,29,12,3,4,5,18,39,68,105,150,203,264,333],[298,233,176,127,86,53,28,11,2,1,6,19,40,69,106,151,204,265,334],[297,232,175,126,85,52,27,10,9,8,7,20,41,70,107,152,205,266,335],
[296,231,174,125,84,51,26,25,24,23,22,21,42,71,108,153,206,267,336],[295,230,173,124,83,50,49,48,47,46,45,44,43,72,109,154,207,268,337],[294,229,172,123,82,81,80,79,78,77,76,75,74,73,110,155,208,269,338],
[293,228,171,122,121,120,119,118,117,116,115,114,113,112,111,156,209,270,339],[292,227,170,169,168,167,166,165,164,163,162,161,160,159,158,157,210,271,340],[291,226,225,224,223,222,221,220,219,218,217,216,215,214,213,212,211,272,341],
[290,289,288,287,286,285,284,283,282,281,280,279,278,277,276,275,274,273,342],[361,360,359,358,357,356,355,354,353,352,351,350,349,348,347,346,345,344,343]]
new_matrix = []

for row in matrix:
    x = []
    for i, degree in enumerate(row):
        if i < len(row):
            x.append(planet_hash[degree]) if degree in planet_hash.keys() else x.append(degree)
    new_matrix.append(x)

out_mat = new_matrix

cell_text = []
cell_colours = []
for i in range(MASTER_HEIGHT):
    cell_text.append([])
    cell_colours.append([])
    for j in range(MASTER_WIDTH):
        cell_text[i].append(str(out_mat[i][j]))
        if  i == j \
            or i == (18-j) \
            or j == (MASTER_WIDTH // 2) \
            or i == (MASTER_HEIGHT // 2):
            cell_colours[i].append("yellow")
        else:
            cell_colours[i].append("none")

for i in range(len(cell_text)):
    try: int(cell_text[i])
    except: cell_colours[i] = 'purple'

fig, ax = plt.subplots()
fig.set_size_inches(15, 15, forward=True)

ax.get_xaxis().set_visible(False)
ax.get_yaxis().set_visible(False)
ax.axes.spines["left"].set_color(None)
ax.axes.spines["right"].set_color(None)
ax.axes.spines["top"].set_color(None)
ax.axes.spines["bottom"].set_color(None)
ax.set_aspect("equal")

table = plt.table(cellText=cell_text, cellColours=cell_colours, cellLoc="center", bbox=[0, 0, 1, 1])

for k, v in table._cells.items():
    v.set_edgecolor((0.7, 0.7, 0.7))

for i in range(10):
    ax.add_patch(Rect((2-0.1*i, 2-0.1*i), 0.2*i, 0.2*i, facecolor="none", edgecolor="black", lw=1.5))

plt.show()```error
---------------------------------------------------------------------------
ValueError                                Traceback (most recent call last)
~\AppData\Local\Temp/ipykernel_17492/1699734711.py in <module>
     56 ax.set_aspect("equal")
     57
---> 58 table = plt.table(cellText=cell_text, cellColours=cell_colours, cellLoc="center", bbox=[0, 0, 1, 1])
     59
     60 for k, v in table._cells.items():

~\AppData\Roaming\Python\Python39\site-packages\matplotlib\pyplot.py in table(cellText, cellColours, cellLoc, colWidths, rowLabels, rowColours, rowLoc, colLabels, colColours, colLoc, loc, bbox, edges, **kwargs)
   3175         colLoc='center', loc='bottom', bbox=None, edges='closed',
   3176         **kwargs):
-> 3177     return gca().table(
   3178         cellText=cellText, cellColours=cellColours, cellLoc=cellLoc,
   3179         colWidths=colWidths, rowLabels=rowLabels,

~\AppData\Roaming\Python\Python39\site-packages\matplotlib\table.py in table(ax, cellText, cellColours, cellLoc, colWidths, rowLabels, rowColours, rowLoc, colLabels, colColours, colLoc, loc, bbox, edges, **kwargs)
    750         for row in cellColours:
    751             if len(row) != cols:
--> 752                 raise ValueError("Each row in 'cellColours' must have {} "
    753                                  "columns".format(cols))
    754     else:

ValueError: Each row in 'cellColours' must have 19 columns
 undone mirage
Eww
worthy hollow
from matplotlib.patches import Rectangle as Rect``` violet gull
so what happened to all the tiles that had words and not numbers
worthy hollow
well i think it just plot no tiles regardless of their words or numbers
 violet gull
didnt u want to change the tiles that had words to be purple
worthy hollow
violet gull
didnt u want to change the tiles that had words to be purple
yess
violet gull
so where are the words
worthy hollow
ahhh
they are inside out_mat dataframe

stored as:py [['307', '308', '309', '310', '311', '312', '313', '314', '315', '316', '317', '318', '319', '320', '321', '322', 'Sat', '324', '325'], ['306', '241', '242', '243', '244', '245', '246', '247', '248', '249', '250', '251', '252', '253', '254', '255', '256', '257', '326'], ['305', '240', '183', '184', '185', '186', '187', '188', '189', '190', '191', '192', '193', '194', '195', '196', '197', '258', '327'], ['304', '239', '182', '133', '134', '135', '136', '137', '138', '139', '140', '141', '142', '143', '144', '145', '198', '259', '328'], ['303', '238', '181', '132', '91', '92', '93', '94', '95', '96', '97', '98', '99', '100', '101', '146', '199', '260', '329'], ['302', '237', '180', '131', '90', '57', '58', '59', '60', '61', '62', '63', '64', '65', '102', '147', '200', '261', '330'], ['301', '236', '179', '130', '89', '56', '31', 'Mar', '33', '34', '35', '36', '37', '66', '103', '148', '201', '262', '331'], ['300', '235', '178', '129', '88', '55', '30', '13', '14', '15', '16', '17', '38', '67', '104', '149', '202', '263', '332'], ['299', '234', '177', '128', '87', '54', '29', '12', 'Jup', '4', '5', '18', '39', '68', '105', '150', '203', '264', '333'], ['298', '233', '176', '127', '86', '53', '28', '11', '2', '1', '6', '19', '40', '69', '106', '151', '204', '265', '334'], ['Plu', '232', '175', '126', '85', '52', '27', '10', '9', '8', '7', '20', '41', '70', '107', '152', '205', '266', '335'], ['296', '231', '174', '125', '84', '51', '26', '25', '24', '23', '22', '21', '42', '71', '108', '153', '206', '267', '336'], ['295', '230', '173', '124', '83', '50', '49', '48', '47', 'Ura', '45', '44', '43', '72', '109', '154', '207', '268', '337'], ['294', '229', '172', '123', '82', '81', '80', '79', '78', '77', '76', '75', '74', '73', '110', '155', '208', '269', '338'], ['293', '228', '171', '122', '121', '120', '119', '118', '117', '116', '115', '114', '113', '112', '111', 'Ven', '209', '270', '339'], ['292', '227', '170', '169', '168', '167', '166', '165', '164', '163', '162', '161', '160', '159', '158', '157', '210', '271', '340'], ['291', '226', '225', '224', '223', '222', '221', '220', '219', '218', '217', '216', '215', '214', '213', '212', '211', '272', '341'], ['290', '289', '288', '287', '286', '285', '284', '283', '282', '281', '280', '279', '278', '277', '276', '275', '274', '273', '342'], ['361', '360', '359', '358', 'Ear', '356', '355', 'Nep', '353', '352', '351', '350', '349', '348', '347', 'Mer', '345', '344', '343']]
worthy hollow
worthy hollow
stored as:```py
[['307', '308', '309', '310', '311', '312', '313', '314', '315',...
you can barely see them in all those numbers but they are here focus on the thing you'll see the words popping up
violet gull
where does that go
worthy hollow
and call that dataframe as "helio"
violet gull
ill be back in a little
 dusty valve
model = keras.Sequential([
    tf.keras.layers.Flatten(input_shape=(250,)),
    tf.keras.layers.Dense(128, activation='relu'),
    tf.keras.layers.Embedding(VOCAB_SIZE, 256),
    tf.keras.layers.LSTM(128),
    tf.keras.layers.Dropout(0.2),
    tf.keras.layers.Dense(len(classes), activation='softmax'),
])``` making a model that takes an encoded string, and it has to classify it as one of 5 classes. are these layers okay or should i do something more like
```py
model = keras.Sequential([
    tf.keras.layers.Flatten(input_shape=(250,)),
    tf.keras.layers.Embedding(VOCAB_SIZE, 256),
    tf.keras.layers.LSTM(128),
    tf.keras.layers.Dropout(0.2),
    tf.keras.layers.Dense(len(classes), activation='softmax'),
])```and each word in the string is encoded, not character
or should i just make it all dense layers and encode each character
shell crest
I don't know anything about NNs but why does your former have dropout layer but the latter doesn't
dusty valve
now that i think about it it's probably not accurate because i don't have a lot of training data
dusty valve
shell crest
I don't know anything about NNs but why does your former have dropout layer but ...
missed that
shell crest
TBH asking about NN architecture, other than general theory is there anything really better than just training and fitting?
I think you can say more if you do a lot of 'pulling apart' of the NN architecture
Else it becomes a generic-hyperparameter-search problem
dusty valve
what's the difference sigmoid and softmax functions?
the graphs are almost identical
grave token
I got time limit with colab.. Will it work if i use another account?
lapis sequoia
Best python libraries for NLP?
shell crest
dusty valve
what's the difference sigmoid and softmax functions?
I don't think there's 'the' sigmoid function (there are typically multiplec considered as sigmoidal). Softmax turns weights into probabilities as a multivariate version of the logistic function
lapis sequoia
charred cedar
you can read excel sheets into pandas dataframes fairly easily.
What about the example image I showed? It would require multi index. How do I give that?
charred cedar
lapis sequoia
What about the example image I showed? It would require multi index. How do I gi...
You can specify multiple index columns.
import pandas as pd

df = pd.read_excel('test/ipsos_excel_tables_type_2_trimed_nosig.xlsx',
                   header=[0,1],
                   index_col=[0,1],
                   sheetname="0001")
print df
(I grabbed that example from stack overflow but it works.)
 cyan geode
So... say i have X amount of user names that are all fake, but are being created and used by 1 individual (who is a scammer) is there a way to have python compile all known data, and possibly return a true user?? If so where the h*ll do i start.
dusty valve
shell crest
I don't think there's 'the' sigmoid function (there are typically multiplec cons...
Doesn't sigmoid also squish weights between 0 and 1 too?
lapis sequoia
charred cedar
You can specify multiple index columns.
```py
import pandas as pd
df = pd.rea...
Yeah but it's quite weird there. The multi index is not actually in a different column
Checkout the screenshot
lapis sequoia
lapis sequoia
How can I read in this excel file appropriately
The 20601 thingy is like the outer index
violet gull
Can someone have a look at this and lmk why it trains properly on X1 and y1 but won’t work on X2 and y2. https://github.com/Saratii/MLStuff
If you clone and run on x1 it will get to a really low loss and correct predictions but on X2 the loss is all over the place
And the predicted values are all equal
I already verified that they are the correct sized matrixes and have the same range of input values
The only difference between data I see is that there is more data in X2
Training on 6 dog pictures and 6 cat pictures 100x100 pixels but the neural net does not seem to be working
GitHub
Contribute to Saratii/MLStuff development by creating an account on GitHub.
serene scaffold
lapis sequoia
Best python libraries for NLP?
spacy, I guess?
hasty mountain
lapis sequoia
Best python libraries for NLP?
There's also Natural Language Toolkit(NLTK)
hasty mountain
Also...
Why tutorials on working with audio in neural networks make things so complex and hard to understand?
I mean...when I remembered that .wav files can be interpreted as numpy arrays just like images, I just passed then into a neural network designed to work with images and everything went smoothly. No Fourier Transformations, no spectrograms... only scaling and voilá...
lapis sequoia
How can I convert this into 2 columns
 serene scaffold
lapis sequoia
How can I convert this into 2 columns
serene scaffold
lapis sequoia
How can I convert this into 2 columns
.apply(pd.Series)
lapis sequoia
How to call these initial columns

They are neither getting extracted. nor working with rename function
like df.rename({"Unnamed:0":"abhsbs"})
worthy hollow
violet gull
ill be back in a little
are u there?
 eternal panther
Hlo,can anyone suggest me with good data science project to boost my resume plz
wooden sail
dusty valve
what's the difference sigmoid and softmax functions?
if you pay attention to the functions, the common logistic sigmoid is exactly the softmax func when there are 2 variables. if one of the two has value 0, the other one is a 1D sigmoid
so you can think of softmax as a multivariate sigmoid. it's just that it's usually interpreted differently
shell crest
dusty valve
Doesn't sigmoid also squish weights between 0 and 1 too?
It can if transformed, but sigmoids are just S-shapey functions
 stuck schooner
Hello guys,
Would there by any tools that you have used and recommend for :
- automating numerous Python notebook
- parameterize notebook
- do some PDF reporting from those notebook
and all that while keeping those notebook as mostly independant as possible ?
warped laurel
can i use linear regression algorithm to predict strings?
or is it only numbers/float?
hope my question makes sense
arctic wedgeBOT
Hey @worthy hollow!
You either uploaded a .txt file or entered a message that was too long. Please use our paste bin instead.
worthy hollow
hey lads, here's my full code: https://paste.pythondiscord.com/guyizopato
it generate this chart

we got two set of planets
Planets_H (for helio) & Planets_G (for geo)
cell_text = []
cell_colours = []
for i in range(MASTER_HEIGHT):
    cell_text.append([])
    cell_colours.append([])
    for j in range(MASTER_WIDTH):
        cell_text[i].append(str(out_mat[i][j]))

        if not str(out_mat[i][j]).isdigit():
                cell_colours[i].append("#f5567b")

        elif  i == j \
            or i == (18-j) \
            or j == (MASTER_WIDTH // 2) \
            or i == (MASTER_HEIGHT // 2):
            cell_colours[i].append("#fff700")
        else:
cell_colours[i].append("w")```I know that it is this part of the code i have to change as
 if str(out_mat[i][j]).isdigit() is False:
cell_colours[i].append("#f5567b")``` is where i get the planets in colorsBUT NOW, AS I HAVE 2 DIFFERENT SETS OF PLANETS (H & G), I WANT PLANET_H set TO BE DISPLAYED ONLY IN RED AND PLANET_G est TO BE DISPLAYED ONLY IN BLUE, i'm pretty much blocked here, if anyone could help out that'd be lovely
serene scaffold
warped laurel
hope my question makes sense
your question does make sense! but remember that linear regression is about curve fitting, and strings are not numbers. So you have to find a way to represent the strings numerically. What are they? labels of some kind?
warped laurel
serene scaffold
your question does make sense! but remember that linear regression is about curv...
oh alright, i recently got into ML and this question came to my mind
Thank you!
i thought my question didn't make any sense haha
 median mica
hasn't anyone made an AI for online poker yet?
just occurred to me that if someone did that, they could take a ton of money right?
worthy hollow
worthy hollow
**BUT NOW, AS I HAVE 2 DIFFERENT SETS OF PLANETS (H & G), I WANT PLANET_H set TO...
anyone pls? it's almost here
serene scaffold
median mica
just occurred to me that if someone did that, they could take a ton of money rig...
online poker services would probably consider that cheating and pursue legal action against people who do that.
median mica
serene scaffold
online poker services would probably consider that cheating and pursue legal act...
how would they even detect it though
serene scaffold
median mica
how would they even detect it though
I don't know, but I promise you're not the first person to think of it.
median mica
the only thing i can think is that they have AI to detect the AI
which seems likely with the amount of money they have
lapis sequoia
I aim to become a data scientist , i googled and found the roadmap to become a data scientist .
Things I have learnt
python , its libraries ( numpy , pandas and matplotlib ) , excel basics
currently learning
sql , machine learning
things to learn in future
R language , Statistics , Linear Algebra , Deep learning , PowerBi , Tableu ,Deployment , Docker
My doubts
1 - Am i missing out on something in things to learn in future
2- What exactly is deployment
Also if you can suggest some course for ML that would be of a great help to me
desert oar
"ai poker player" is an interesting machine learning topic, "ai poker player that i use to cheat in online poker" is probably a crime
wooden sail
what's the difference for you between deep learning, machine learning, and stats+linalg?
ML is a weird umbrella term, and you can't learn much of ML nor deep learning in depth without the maths
 fresh tiger
Hey! Not sure if this is the right place, but I have a question related to polynomial regression
Can polynomial regression be done with more than 1 feature?
For example, I understand that the image in the screenshot would not be polynomial

since x_2 != x_3
unique flame
median mica
how would they even detect it though
Or they can hire the person who made such a thing to create security measures instead.
median mica
unique flame
Or they can hire the person who made such a thing to create security measures in...
only thing is that i could imagine an AI that could almost perfectly mimic a human player at this point
desert oar
fresh tiger
For example, I understand that the image in the screenshot would not be polynomi...
why not? its a multivariate polynomial with some terms set to 0
the w1s all being the same is a bit weird
still a polynomial, just a constrained one
 lavish crypt
lapis sequoia
I aim to become a data scientist , i googled and found the roadmap to become a d...
lavish crypt
lapis sequoia
I aim to become a data scientist , i googled and found the roadmap to become a d...
Hello there! You'll need some knowledge of linear algebra, calculus, and statistics to even have a minimal grasp of machine learning algorithms. Since we use ready-made libraries in most of the processes, you don't need much expertise in these matters, but you still need to have an idea.
Therefore, you should not evaluate the concepts separately. A good course in Machine Learning from 0 will give you a sufficient understanding of all these subjects.
As for the course recommendation, Prof Andrew Ng's old Stanford Coursera course was fantastic. It's back on Coursera in a remastered version, although I haven't completed the new version yet, I'm sure it's still great.
 dawn fable
It feels weird funny asking this in a channel that's all about data science, but how and what do I learn for data science? I'm 14 years old and I want to become a data scientist since I was nine and started learning. I already can do python and c# quite a bit. How do I continue?
lapis sequoia
lavish crypt
Hello there! You'll need some knowledge of linear algebra, calculus, and statist...
https://www.coursera.org/specializations/machine-learning-introduction
is this the course , the remastered version ?

Coursera
Offered by DeepLearning.AI and Stanford University. #BreakIntoAI with Machine Learning Specialization. Master fundamental AI concepts and ... Enroll for free.
lavish crypt
dawn fable
It feels weird funny asking this in a channel that's all about data science, but...
Although it changes with your learning preferences, you can start by learning effective Python libraries for data science. NumPy, Pandas, matplotlib and then (optional) SciPy, SymPy, scikit-learn and so on...
dawn fable
Alright, so I just continue at python
lavish crypt
lapis sequoia
https://www.coursera.org/specializations/machine-learning-introduction
is this ...
Yes, this specialization package consists of 3 courses. Hope it helps!
unique flame
...and ethics.
dawn fable
lavish crypt
Yes, this specialization package consists of 3 courses. Hope it helps!
Thank you! Another question, how do you learn those libraries in a good way?
lavish crypt
unique flame
...and ethics.
Exactly. These courses include not only the subject, but also a lot of important information that you will need in the sector.
lavish crypt
dawn fable
Thank you! Another question, how do you learn those libraries in a good way?
Like I said, it all depends on your learning preferences. Freecodecamp has good tutorials, check it out!
dawn fable
I've watched some videos before, but forgot about it. Thanks!
lavish crypt
dawn fable
I've watched some videos before, but forgot about it. Thanks!
You're welcome, I hope it helps!
dusk tide
I have a question
While doing any imports in python like
from tensorflow.keras.preprocessing.image import ImagedataGenerator
and
import os
Is there any easy way in which just by looking the imports we can tell that what is package or module or library ??
Like in import os this is a module but in first one after import is a function
desert oar
dusk tide
I have a question
While doing any imports in python like
from *tensorflow.kera...
"library" has no technical meaning in python. it's commonly used to refer to a collection of modules/packages. another term used in the context of distributing code is a "distribution", i.e. the thing you install with pip install is technically called a distribution.
in import a.b.c, a and b must be packages, because packages are more or less defined as "modules that contain other modules". c could be a module or a package, and it's impossible to know just by looking at this import statement. this is arguably a good thing.
when you write from a.b import c, the c could be a module, package or another python object like a class or function or some constant value
in general it's best to not think too hard about packages vs. modules in python. "a package is a module that can contain other modules" is all you should care about.
lapis sequoia
lavish crypt
Yes, this specialization package consists of 3 courses. Hope it helps!
okay , thx , ill start doing it
 gloomy anvil
if someone of you is well versed in timeseries and stationarity, maybe you can have a look at #help-kiwi and help me with my problem 🙂
i need to know how often i can apply differencing or detrending to a timeseries to convert it to a stationary process
fresh tiger
desert oar
why not? its a multivariate polynomial with some terms set to 0
I think I was confusing a lot of definitions with Linear model being a simple linear model, while in actuallity general linear models are just just represented as linear combinations
Hence, that what I wrote is still a linear combination
but not specifically a polynomial regression since I am not using one variable
thx for the help 🙂
wooden sail
fresh tiger
but not specifically a polynomial regression since I am not using one variable
polynomials don't need to have only one variable
what's more, you can't solve for w0 and w1 uniquely unless you substitute all the other terms out, since as you mentioned, the terms are linearly dependent with each other. that makes the model matrix rank deficient
desert oar
 pure plover
Hi all, wondering if there is a good reference or guide for managing propagation of error when doing dynamic time warping to synchronize two datasets? I want to make sure any methods I use are statistically sound.
 arctic fossil
Not sure of the best place to ask this... but basically I want to start researching on how to make a stock trading bot. I was curious if they are known to use AI, or just base calculations off previous market conditions. Hopefully my question makes sense.
Just wondering if I'll need AI in order to do what I want to.
serene scaffold
arctic fossil
Not sure of the best place to ask this... but basically I want to start research...
whether or not something is AI isn't absolute, but generally speaking, a program that decides when to purchase or sell stocks would be an AI no matter how you implement it. Is your question really whether or not you'd need to use machine learning?
undone mirage
arctic fossil
Not sure of the best place to ask this... but basically I want to start research...
Check the subreddit Reddit.com/r/algotrading there’s tons of resources out there
arctic fossil
serene scaffold
whether or not something is AI isn't absolute, but generally speaking, a program...
yeah, pretty much. Just trying to figure out what I need to get started basically
 trail radish
I'm prototyping a game idea that would use a chatbot instead of a traditional dialogue tree when talking to NPCs. I'm already aware that it might not end up being a good player experience even if it works, but I'd like to give it a try just to see how it would play. Which chatbot library would you recommend? The ones I've poked around in seem to be old and not maintained any longer. Easy to setup, train, and configure is more important to me than fully realistic conversations since it's a prototype, and preferably it would work alongside flask since I already have a flask server setup to serve other python information to the game.
dusty valve
arctic fossil
yeah, pretty much. Just trying to figure out what I need to get started basicall...
i would get a dataset, with the x data being price of the stock in intervals (maybe len of 1000-10000 in hours) and and the label of -3 to 3, representing going up a bit, going up, and going up a lot in the future. and the opposite for the negative numbers (0 being no change). but of course stocks have to have a lot more in consideration than just the graph thus far.
i dunno how you'd mix in extra elements as well
hey that sounds like a fun project
imma try it out
violet gull
Can someone have a look at this and lmk why it trains properly on X1 and y1 but won’t work on X2 and y2. https://github.com/Saratii/MLStuff
If you clone and run on x1 it will get to a really low loss and correct predictions but on X2 the loss is all over the place
And the predicted values are all equal
I already verified that they are the correct sized matrixes and have the same range of input values
The only difference between data I see is that there is more data in X2
Training on 6 dog pictures and 6 cat pictures 100x100 pixels but the neural net does not seem to be working
pls help - day 11
GitHub
Contribute to Saratii/MLStuff development by creating an account on GitHub.
 little dagger
hey guys, I need a project idea (for my porfolio) that uses a machine learning model and some sort of orchestrating platform like kubernetes
need any help
desert oar
trail radish
I'm prototyping a game idea that would use a chatbot instead of a traditional di...
you could do this the "old fashioned" way, using more traditional ai techniques. you might want to look into the old text adventure games which implemented (what would today be considered crude) natural language processing, as well as the old "expert systems"
trail radish
desert oar
you _could_ do this the "old fashioned" way, using more traditional ai technique...
That sounds like it would be an interesting project. I’d really like to use something plug and play for this prototype though. I’m fairly certain that it will be a more frustrating experience than a normal RPG branching dialogue system, so I don’t want to do a bunch of work just to find out it isn’t fun. Do you know of any sources on how the old text games worked though? Sounds like that’d be interesting reading even if I decide against implementing it myself
 celest patrol
Is it me or is pandas changing more often and deprecating like crazy :/ might have to freeze my version
desert oar
celest patrol
Is it me or is pandas changing more often and deprecating like crazy :/ might ha...
i think there are a lot of dark corners, inconsistencies, and other lurking issues in pandas that have been on the deprecation and/or refactor wish list for a long time. it looks like they're heading towards a 2.0 now, so i'm not surprised if they are starting to ramp up changes like that
the authors are probably also starting to feel more confident in their vision for the library in the longer term
it also looks like a lot of "consistency fixes", like the maddeningly confusing pachinko machine of logic around groupby options https://pandas.pydata.org/pandas-docs/stable/whatsnew/v1.5.0.html#using-group-keys-with-transformers-in-groupby-apply
celest patrol
That's fair. You have good points about 2.0 and inconsistencies. I guess I'm just really rubbed the wrong way by things like changing integer indexing since it would silently change my code and throw a bunch of errors
desert oar
celest patrol
That's fair. You have good points about 2.0 and inconsistencies. I guess I'm jus...
i wouldn't have even noticed if it wasn't in the changelog because i always use .loc and .iloc. i remember back in like 2015 when i was first learning pandas i decided that i was going to take a firm stance on this, and i have not regretted it since
if it were up to me, "plain" [] would be removed entirely except for column access. too much magic
celest patrol
But inclusive exclusive 😦
desert oar
are you talking about this? https://pandas.pydata.org/pandas-docs/stable/whatsnew/v1.5.0.html#label-based-integer-slicing-on-a-series-with-an-int64index-or-rangeindex as far as it can tell it's still exclusive, and only affecting Series
desert oar
not with rangeindex at least, i was about to demo it
!e ```python
import pandas as pd
df = pd.DataFrame({
'x': [11,12,13],
'y': [21,22,23],
}, index=pd.RangeIndex(50,53))
print(df.loc[50:52])
Oh go for it, always happy to learn more pd
arctic wedgeBOT
@desert oar :white_check_mark: Your 3.11 eval job has completed with return code 0.
001 |      x   y
002 | 50  11  21
003 | 51  12  22
004 | 52  13  23
oh hm. that is inclusive
you might be right... i wonder if this is an oversight of some kind, or some other special case behavior
yeah nope you're totally right
i think they made a mistake in the release notes and/or added a special case (ugh) and/or didn't realize how big of a breaking change this was
celest patrol
Yeah my issue is less major changes and more the fact that it changes behavior silently
desert oar
well this is only a deprecation notice. i would be surprised if this wasn't actively being discussed in the issue tracker
celest patrol
Yeah trying to find it. Thanks for the chat!
desert oar
there's an issue linked in the release notes. not much of any discussion there.. maybe it's better to open a new issue about it
 polar haven
hey folks, some help, im using open cv and i want to detect colors in real time, all the tutorials they are detecting three, red, green and blue, but what i want is to detect the most dominant colors of a video, livestream, etc, its real time processing, so i dont know which colors will appears, cant set a range because that wont make sense, im complety lost and i really dont know how to do it, any idea?
 topaz night
WOO HOO DATA SCIENTIFIC GANG BOISSSS
topaz night
polar haven
hey folks, some help, im using open cv and i want to detect colors in real time,...
hmmm this sht hard af no cap fr but hard cuzz we dono how but ez if we know what the algorythm tho ??
polar haven
topaz night
hmmm this sht hard af no cap fr but hard cuzz we dono how but ez if we know what...
bro wat
talking like can take you serious 😂
topaz night
xdxd but sorry cant help tho, me nub and watching 4hour python beginer by mike
topaz night
polar haven
hey folks, some help, im using open cv and i want to detect colors in real time,...
but i think this need detecting all colors and then make all color variable count per frame and then shor from big to short AND BOOM DOMINANT COLOR AT THE TOP(cuz from big to short)
 woven spire
Does anyone have a recommendation for a guide to idiomatic pandas? I've used R professionally for like 10 years and love data.table, have always found pandas super frustrating bc there are so many ways of doing things, api has slowly drifted, it's slow, etc. Was wondering if there was anything like a guide that focuses on idiomatic code that runs quickly. Almost like a template gallery.
 somber sphinx
hey does anyone know how to find the number of languages used in a string (preferably using fasttext) ?
example:
f(text)
output = 3``` winter barn
Why does any ai tutorial/article/educational material use mathematical formulae instead of programming language notations?

This is just a for loop with an if statement inside
Instead I have to learn all about sigma summations and things that wouldnt be relevant if just written as python instead lol
wooden sail
because ML is math
it just happens that you then write it as code
you can certainly write it as for loops and ifs, but for loops and ifs tell you nothing about the dimension and of a vector space, or the image and codomain of a linear transformation
lapis sequoia
LogisticRegression(max_iter = 2000,random_state=seed)
Is this paramateter fine
at 2000
I don't really know what it does. I just need to compare performance of 3 feature sets. So just need an okay model
wooden sail
lapis sequoia
```LogisticRegression(max_iter = 2000,random_state=seed)```
from which library?
wooden sail
it's the number of steps the solver takes when fitting the parameters
the fitting process stops when either the desired tolerance or the max number of iterations is reached
lapis sequoia
is the higher the better?
wooden sail
not necessarily. if you want higher accuracy, you'd also need to make the tolerance smaller
that also makes everything slower
"better" depends on whether you aim for speed or accuracy. can't have both
lapis sequoia
Doesn't really matter to me to get the most optimal model. I just don't want something super trashy and inconsistent
 copper pollen
def plot_central_tendency_per_label(df, column):
    """
    Plot point estimates for the given column of the mean, per label.
    On the y-axis the values of the given column, and on the x-axis all the labels.
    The plot can be a point plot, bar plot, or similar.
    The labels on the x-axis should be in decreasing order of their point estimates,
    and all labels are on the plot are readable (e.g. not overlapping or too small)
    :param df: pd.DataFrame
    :param column: string, a name of a column in the df
    """
    plt.figure(figsize=(10,6))
    sns.pointplot(x=df.Label, y= column, data= df)
im not sure how to plot the point plot in decreasing order
wondering if i could get a direction
 fast slate
copper pollen
```Python
def plot_central_tendency_per_label(df, column):
"""
Plot poin...
fast slate
copper pollen
```Python
def plot_central_tendency_per_label(df, column):
"""
Plot poin...
to plot a single line, you can use plt.axhline() or plt.axvline() from matplotlib
copper pollen
copper pollen
```Python
def plot_central_tendency_per_label(df, column):
"""
Plot poin...
this is my output

 haughty marsh
does anybody know why downsampling and upsampling the input image of UNet model increase the accuracy? I tried doing UNet but without downsampling and upsampling (Only changing the channel size) but the accuracy become a lot worse
somber sphinx
somber sphinx
hey does anyone know how to find the number of languages used in a string (prefe...
anyone know how to do this?
haughty marsh
somber sphinx
hey does anyone know how to find the number of languages used in a string (prefe...
not sure but im wondering what happens if there are multiple countries who use hello for example?
winter barn
In a timeseries where different data comes at different dates, what methods are avaiable to normalize the data to line them all up to the same "date"?
Is it wise to just consolidate everything from a single month into just month by month timeseries, or is that very problem-specific?
To elaborate I have data on public companies, but each company releases these data updates on different dates in different months, etc
Would a best approach be to seperate the timeseries into quarters, since every company will release some data within every 3 month period perhaps? 🤷
fresh tiger
wooden sail
what's more, you can't solve for w0 and w1 uniquely unless you substitute all th...
Ahh I see thx 🙂 Thank you both for the help!
 deep arch
What is the fastest way to download image from a given link(there is a single image on the link). I have a csv containing links of images(over 50k) and I want to download those images. I am using urllib.ulrretrieve but it is slow. Is there any faster way to do this?
fresh tiger
Hey, I had a question regarding decision boundaries, specifically in the screenshot. I feel like im missing something super basic, but how is this line corresponding to x_1 + x_2 = 3?

Like for x_1 and x_2 to be 3
how can these two values be equal to 3, wouldnt 3 + 3 = 6?
wooden sail
fresh tiger
Hey, I had a question regarding decision boundaries, specifically in the screens...
they aren't each equal to 3
their SUM is equal to 3
e.g. you can take x1 = 0, x2 = 3. you could also take x1 = -100, and x2 as 103
it's a line because there are infinitely many pairs (x1, x2) for which this is true
we can do the following
let x1 = y
then y + x2 = 3
now let's get y on its own. we write y = -x2 + 3
and substitute x2 = x
now we have y = -x + 3, which is the equation of a line with slope -1 and y intercept b = 3. every point on this line (infinitely many) satisfies that y + x = x1 + x2 = 3
.latex and in general, [
\sum_{n=1}^N x_n = c,
]
for some constant $c$, is the equation of an $N$ dimensional hyperplane, which is $N-1$ dimensional. in 2 dimensions, that'd be a line.
 strange elbowBOT
 hasty mountain
Does anyone know if someone has tested a GAN which uses distinct losses for the Generator and the Discriminator?
I was thinking about, instead of using the Discriminator's loss to optimize the Generator(which is probably what causes so much unstability in the architecture), I could simply pass a loss function to the generator that is somehow inversely proportional to the Discriminator's loss.
D loss could be like: (1-Dpredicted)²
While G loss could be 1/(1-Dpredicted)²
somber sphinx
haughty marsh
not sure but im wondering what happens if there are multiple countries who use h...
oh no that's just an example; the full dataset i'm working with has more specifications
i just wanna know how do i detect how many languages are there in the text
hasty mountain
hasty mountain
Does anyone know if someone has tested a GAN which uses distinct losses for the ...
I just hope that I can test this in Pytorch using G_loss.backward()...
 tame zodiac
Hey everybody, I'm currently planning to make a custom Machine Learning infrastructure, operating on the cloud. For now, I have difficulties choosing which tool to use from either Apache Spark or Kubeflow. Which of them do you suggest is more beginner-friendly?
 jade prism
Hello, i got a dataframe in pandas like that

how i can filter out column that does not have any 1 in atleast one of the three first column ( what is the pandas syntaxe to do that ) please
my code ```python
poi_copy = tableau_poi.copy()
tab_cbr = poi_copy.filter(items=["restaurant", "bar", "cafe", "prix"])
tab_cbr = tab_cbr[tab_cbr["prix"] > 0 & ( tab_cbr["restaurant"] | tab_cbr["cafe"] | tab_cbr["bar"])]
type_column = []
k = 0
while k < len(tab_cbr):
# (bar, cafe, resto) -> 8 combinaisons possibles donc 7 en enlevant le cas (0,0,0)
row = tab_cbr.iloc[0]

if row["cafe"] == 1:
    type_column.append(1)
elif row["restaurant"] == 1 and not ( row["cafe"] == 1 or row["bar"] == 1):
    type_column.append(2)
elif row["bar"] == 1 and not (row["cafe"] == 1 or row["restaurant"] == 1):
    type_column.append(3)

elif row["bar"] == 1 and row["cafe"] == 1 and not ["restaurant"] == 1:
    type_column.append(4)
elif row["bar"] == 1 and row["restaurant"] == 1 and not ["cafe"] == 1:
    type_column.append(5)
elif row["restaurant"] == 1 and row["cafe"]==1 and not ["bar"] == 1:
    type_column.append(6)

else:
    type_column.append(7)

k+= 1
tab_cbr["type"] = type_column
tab_cbr
can you give a specific example? usually just moving variables around doesn't change runtime performance at all, but moving variables around can naturally cause bugs if you make a mistake in the process
 fiery crest
oi
my code is giving this problem
'LTChar' object is not iterable
this is the code
from pdfminer.high_level import extract_pages
from pdfminer.layout import LTTextContainer, LTChar,LTLine,LAParams
import os
path=r'{my file path}'

Extract_Data=[]

for page_layout in extract_pages(path):
    for element in page_layout:
        if isinstance(element, LTTextContainer):
            for text_line in element:
                for character in text_line:
                    if isinstance(character, LTChar):
                        Font_size=character.size
            Extract_Data.append([Font_size,(element.get_text())])
 stone oracle
Where can I learn ai best?
desert oar
you are asking about moving some code into a separate function? i still think it would be best if you shared the code "before" and "after"
lapis sequoia
jade prism
how i can filter out column that does not have any 1 in atleast one of the three...
What does that mean. "does not have any 1 in atleast one of the first three column"?
jade prism
lapis sequoia
What does that mean. "does not have any 1 in atleast one of the first three colu...
i fixed my problem sorry, thanks you
lapis sequoia
Hmm okay. Did you mean to say in first three rows?
 lapis sequoia
Ah
desert oar
i'm saying that you need to share the actual code. "the location where all the other variables are" is not a standard location that exists in all programs.
!paste read below for instructions on posting code here:
arctic wedgeBOT
Pasting large amounts of code
If your code is too long to fit in a codeblock in Discord, you can paste your code here:
https://paste.pythondiscord.com/
After pasting your code, save it by clicking the floppy disk icon in the top right, or by typing ctrl + S. After doing that, the URL should change. Copy the URL and post it here so others can see it.
jade prism
maybe there is a better way but i did like that
desert oar
jade prism
you want rows that have a 1 in any of the first 3 columns?
jade prism
poi_copy = tableau_poi.copy()
tab_cbr = poi_copy.filter(items=["restaurant", "bar", "cafe", "prix"])
tab_cbr = tab_cbr[(tab_cbr["restaurant"] == 1) | (tab_cbr["cafe"] == 1 )| (tab_cbr["bar"] == 1)]
tab_cbr = tab_cbr[(tab_cbr["prix"] > 0)]
this looks correct to me:
tab_cbr = tab_cbr[(tab_cbr["restaurant"] == 1) | (tab_cbr["cafe"] == 1 )| (tab_cbr["bar"] == 1)]
 glacial ginkgo
Hi I am trying to implement a voice recognition system not the speech recognition
How should I do it ?
Any libraries or ways you wanna recommend ?
 iron basalt
winter barn
Why does any ai tutorial/article/educational material use mathematical formulae ...
iron basalt
winter barn
Why does any ai tutorial/article/educational material use mathematical formulae ...
Mathematical notation lets one manipulate the expression further as needed for analysis, mathematical notation is concise, it's not just a for loop with an if statement (consider that it could be implemented with water gates (as an example (analog)), or something else, not just a modern computer (anywhere for loops don't apply)), and from a mathematician's POV they now need to learn about for loops instead just using sigma.
 alpine nexus
anyone know how I can select a numpy row matching an AND condition (within range), it works with 1 condition but doesn't with 2
 dusty valve
odd meteor
What are y'all thoughts on this? 🙄😒🤔
dusty valve
odd meteor
What are y'all thoughts on this? 🙄😒🤔
does everyone really hate tf that much 🥺
odd meteor
dusty valve
does everyone really hate tf that much 🥺
ML Research folks say hi 🖐️🤣
Apparently it's not the most preferred deep learning framework for Research. I was at DLI conference in Tunis and most folks at Deep Mind are heavy on JAX.
PyTorch & JAX are kinda more popular in Research / Academia. TensorFlow is however more popular in Industry application.
desert oar
alpine nexus
anyone know how I can select a numpy row matching an AND condition (within range...
you left out a comma in the 2nd condition, you wrote i1[: -1] instead of i1[:, -1] which of course means something different
desert oar
i've been there too, lol
alpine nexus

hasty mountain
odd meteor
ML Research folks say hi 🖐️🤣
Apparently it's not the most preferred deep lear...
Lol. I always thought Tensorflow was the cool kid in ML
Most papers I used to see in ML were made in tf, sooo...
But then...now that I remember it...those papers were mostly made before Pytorch was released  Except for BigGAN
odd meteor
hasty mountain
Lol. I always thought Tensorflow was the cool kid in ML
Well, TF is still the most used DL framework. Number of industries > Number of Research Labs / Universities
hasty mountain

alpine nexus
desert oar
you left out a comma in the 2nd condition, you wrote `i1[: -1]` instead of `i1[:...
ducky multi-label works now :)

 last crypt
Hello, I would like to output PyTesseract metrics at the end of the OCR process but do not know how to go about doing so. Can anyone help?
Basically, the basic things I'd love to output is accuracy of the actual OCR of images supplied to the algorithm.
I've seen some blog posts talking about fastwer Python library, but I thought maybe PyTesseract already has something that would help me but don't yet know what it's called.
 rough anchor
hey fellow humans. I'd like to preface this by saying that this probably isn't all question you get a lot so I'm fine if you can't answer it. I'm currently a high school student enrolled in a programme where you research and read papers on a topic for a few months then try and get a job in a lab. It's been going for years and has a pretty long history so connections aren't really an issue. I've always been really into computer science and machine learning and I know a fair bit of python and c. I'm interested in perhaps going into a lab which uses machine learning in some way shape or form. I've pretty much given up on trying for a more theoretical ai lab due to the maths involved and I'm interested in perhaps doing some research that utilizes ai but I want to know what you guys think. As for maths, I don't know very much in the grand scheme of things. I'm an algebra 2 student but I have a teacher who's willing to teach me the linear algebra and some of the calculus required to make a basic positron (like the number matching one in the 3 blue 1 brown video). Thanks for reading!
woven spire
rough anchor
hey fellow humans. I'd like to preface this by saying that this probably isn't a...
Sounds like a cool program for a HS student to be involved in. What exactly is your question? You want to get thoughts on a research direction?
It might be helpful to give some more context on what kind of labs you're talking about. Labs in an academic context? Attached to a local university? Attached to a local company?
rough anchor
woven spire
Sounds like a cool program for a HS student to be involved in. What exactly is y...
my question is mostly if you think there's a chance I could go into a more theoretical lab or if I should just go into a lab that uses ml on the side. I'm also curious about any disciplines you'd suggest that'd be ml heavy, I know things like comp bio can be. The school defines lab pretty loosely, it can be attached to a university or company but pretty much anywhere that publishes papers and has credible professors.
It's also worth mentioning that my school goes faster than most, everyone took physics as a freshman and the math courses are pretty rigorous.
arctic wedgeBOT
@woven spire Per Rule 6, your invite link has been removed. If you believe this was a mistake, please let staff know!
Our server rules can be found here: https://pythondiscord.com/pages/rules
woven spire
Sounds like a great high school. I've never been involved in academia - probably not the best person to answer that side of things. If someone here with exp doesn't get to it, check out /r/MachineLearning on reddit, or somewhere like the EleutherAI discord, where people with research connections usually hang out and can probably provide better advice.
In my limited experience, I've never heard of a pure AI lab taking on HS students even in like an intern capacity. But maybe it happens. Either way I think your idea about applying ML to other disciplines is a good one, it lets you learn the ropes on practical application of it without diving into the deep end. Comp Bio unfortunately I think is a little deep to start with, I would think more along the lines of financial applications.
Or things like weather/climate modeling. Stuff that perhaps has a very specific math component but is more approachable and intuitive to everyday life.
rough anchor
woven spire
Sounds like a great high school. I've never been involved in academia - probably...
could you dm me the link to that discord?
 royal hound

how much data do i need for better precission?
the more the better?
or do i just need to increase epochs

 serene scaffold
@royal hound are you trying to make a RuneScape bot?
royal hound
nah
im messing around with machine learning and osrs was the first thing that came to my mind
might be interesting to make a ML that plays from start to finish
kind of like dota 2
serene scaffold
If you say so.
royal hound
it is working amazingly now tho
i must say this is amazing

there goes 6 hours of my day
good bye now
 wheat ice
woven spire
Sounds like a great high school. I've never been involved in academia - probably...
wheat ice
woven spire
Sounds like a great high school. I've never been involved in academia - probably...
here's the server invite you posted earlier
sorry the bot deleted your message
https://discord.gg/eW556Pyg
topaz night
any good youtube vid for python data scientist ?
lapis sequoia
Does someone have 2 simple datasets for me that can be merged. I need to do a uni project in R and don't want anything complex.
tacit basin
topaz night
any good youtube vid for python data scientist ?

YouTube
This free course is designed for people with some coding experience who want to learn how to apply deep learning and machine learning to practical problems. ...
 dry wharf
does anyone know how to merge vertical cell for dataframe in r?
grave token
Guys how to run models like knn, svm on colab gpu?
 gentle hornet
I want to build project so do i need to fill up a high programmimg competition profile or just go for the details of a language??
tacit basin
grave token
Guys how to run models like knn, svm on colab gpu?
You could try rapids cuml https://docs.rapids.ai/api/cuml/stable/
serene scaffold
dry wharf
does anyone know how to merge vertical cell for dataframe in r?
This channel isn't for R questions; sorry
dry wharf
serene scaffold
This channel isn't for R questions; sorry
can i know which channel is for?
serene scaffold
dry wharf
can i know which channel is for?
None of them, as this is the Python server. I'm not sure where to send you to get R help. Sorry.
dry wharf
oh ok
 hardy berry
how do i make it so that my x-axis only has integers/whole numbers? idw these decimals come

 steady basalt
royal hound
steady basalt
royal hound
Nice osrs
 lavish swift
I recently started playing with/testing some AI based tools for image restoration and upscaling so apologies if my terminology is off, but I had a couple questions:
- Are things like
Real-ESRGANandGFPGANconsidered "models" - Are they meant to be used "as is" or should one be tuning them more?
- I've got the super basics working, but wondering if there are good resources for learning more (specifically for image restoration and upscaling) - for fun I've been playing with Stable Diffusion, but I'm currently less interested in AI image creation.
odd meteor
Hi everyone 👋
I'm excited to share that Cohere For AI has launched the Cohere For AI Scholars Program 🎓 📚
This is an incredible opportunity for emerging talent in NLP research around the world. If selected, Scholars will work alongside our team and have access to a large-scale experimental framework. The Cohere For AI team will match scholar interests with research projects supported by dedicated mentors heart
If you’re looking for an opportunity to start your research journey, look no further.
Learn more about Cohere For AI Scholars Program here: https://txt.cohere.ai/introducing-the-cohere-for-ai-scholars-program-your-research-journey-starts-here/
Have a wonderful day! 😀✌️

Context by Cohere
We're excited to announce our Scholars Program, inviting a class of emerging talent to work alongside our team – exploring the unknown, together. If you're looking for an opportunity to develop your research skills, your journey starts here.
hasty mountain
@odd meteor hey, since you're a researcher that uses Pytorch, tell me...
If I'm testing a GAN and I use
Discriminator_loss = torch.nn.BCE(Discriminator_output, fake_labels)

Discriminator_loss.backward()

Generator_loss = 1/Discriminator_loss

Generator_loss.backward()
Will Pytorch make the backpropagation through the Gen as if I used Generator_loss = Discriminator_loss?
I'm trying to do this and I'm getting an RuntimeError: Trying to backward through the graph a second time. So I thought that perhaps this backpropagation issue might be the cause
I hope I don't have to create a backpropagation function through all my ten transposeconv2d layers...
 static mesa
Hey all, currently trying to run a GridSearchCV and I keep getting the following error: numpy.AxisError: axis -1 is out of bounds for array of dimension 0.
Here is the code:
estimator = Pipeline([
('polynomial_features', PolynomialFeatures()),
('scaler', StandardScaler()),
('elasticnetCV', ElasticNetCV())])
params = {
'polynomial_features__degree': [1, 2],
'elasticnetCV__alphas': np.geomspace(1, 20, 10),
'elasticnetCV__l1_ratio': np.linspace(0.01, 0.1, 5),
'elasticnetCV__max_iter': [500000]
}
grid = GridSearchCV(estimator, params)```
```grid.fit(X_train, y_train)```
I know that its telling me my alphas are in the wrong shape but ive tried a few different variations for that input, am I missing something? spring marsh
Hey everyone I am trying to get live Air quality data state wise for India can someone suggest some good API for the same ?
royal hound
detection in real time done

 quartz grotto
royal hound
detection in real time done
quartz grotto
royal hound
detection in real time done
Thats pretty sick
royal hound
quartz grotto
Thats pretty sick
Thank you
It works with anything as well thats the best part
quartz grotto
What did you use for it?
royal hound
quartz grotto
What did you use for it?
yolov7
i had to modify the source code a lot
so that it works in realtime
it currently works at 40 fps which is pretty good compared to everything else i've seen
 grizzled barn
Ive wanted to learn about AI for awhile now, but Im not exactly sure where to start at all. Is there a certain roadmap I should follow while learning about it?
hasty mountain
grizzled barn
Ive wanted to learn about AI for awhile now, but Im not exactly sure where to st...
I've began learning data science and then some statistics, supervised learning, unsupervised learning and then deep learning(AIs)
I didn't know how to code back then, so before all that came in basic Python after I failed miserably at learning C++ with codeblocks
quartz grotto
Whats a good start project for learning ai?
lapis sequoia
Can someone help me on how can I generate a cloud excel file which has an xlsx link. So that pandas can read the most updated file each time
but the excel file can be edited online like you do on google drive
except google drive is not returning an .xlsx link
so pandas doesn't recognise it as an excel file
lapis sequoia
´´´
numPos: 47
numNeg: 200
numStages: 10
precalcValBufSize[Mb] : 1024
precalcIdxBufSize[Mb] : 1024
acceptanceRatioBreakValue : -1
stageType: BOOST
featureType: HAAR
sampleWidth: 24
sampleHeight: 24
boostType: GAB
minHitRate: 0.995
maxFalseAlarmRate: 0.5
weightTrimRate: 0.95
maxDepth: 1
maxWeakCount: 100
mode: BASIC
Number of unique features given windowSize [24,24] : 162336
===== TRAINING 0-stage =====
<BEGIN
POS count : consumed 47 : 47
Train dataset for temp stage can not be filled. Branch training terminated.
Cascade classifier can't be trained. Check the used training parameters.
´´´
Some help me with this? It's a error while trying to train cascade
 glossy totem
quartz grotto
Whats a good start project for learning ai?
glossy totem
quartz grotto
Whats a good start project for learning ai?
With python?
I recommend trying to make a simple word sentiment analysis. it pretty fun and you get a basic understanding
unique flame
royal hound
it currently works at 40 fps which is pretty good compared to everything else i'...
Yea was released in July. How long did it take you to train?
 cloud sand
@rough anchor hey mate! got 5 mins? (your dms are disabled)
winter barn
To create a dataset of many company's historical financial datas in a time series for use in machine learning, what is the best way to structure the data?
If I structure it as a json, should I make a dict like so? Should I structure it as something else?
{'2022-01-01': {'AAPL': 'dividend':1.00, 'GOOGL': 'dividend:1.00}, '2022-02-01: {'AAPL': 'dividend':1.00, 'GOOGL': 'dividend:1.00}, ..
by using the date as the seperator in this dataset? or what should I do
cloud sand
winter barn
To create a dataset of many company's historical financial datas in a time serie...
don't worry about that
it doesn't matter, it's always going to end up as a tensor
winter barn
You mean as long as the data is in there in some form it will all generally work out?
cloud sand
so you can put however it's more comfortable for you 😄
cloud sand
winter barn
You mean as long as the data is in there in some form it will all generally work...
yea, how you store it it doesn't affect anything, since you're still going to preprocess it
winter barn
Is storing the dataset as a json inefficient in terms of storage? Since it has to repeat things like 'dividend' feature for every stock in every date?
Would CSV be better storage for this data, just text kb size-wise?
winter barn
so will not likely ever be overburdening to vram/ram?
oke yea the timeseries is only on 500 companies for 5-20 years of data (quarterly) so I doubt it gets much larger than 250mb
cloud sand
nah don't worry
unless you dump something like 6 gigs (assuming you have 8 gb vram) it won't hurt you
winter barn
I suppose it wouldnt be hard to just convert it to csv later with a small script if it really did become aproblem
cloud sand
also consider that stuff is doing in batches, so the whole data will never be fully loaded to ram
99% of your data will still be on the disk
just the tiny portion that you need will be loaded
winter barn
ok I have never actually done machine learning with my own data or train a ML model before so I just wanted to make sure i dont fail from the start 😄
ty 🤗
cloud sand
winter barn
ok I have never actually done machine learning with my own data or train a ML mo...
don't worry! if you have any other doubts don't hesitate to ask here! 😄
glossy totem
yeah im sure one of us will have a answer
cloud sand
glossy totem
yeah im sure one of us will have a answer
yup!
winter barn
Im certain I will be back soon enough 😄 thank you 🙂
glossy totem
you working on any data scince or ml things gman?
cloud sand
I'm still a student, but I work part time as a machine learning R&D Engineer and probably will also be an intern at Wolfram Research still working on ai
glossy totem
nice very nice
cloud sand
ty!
 silk minnow
Morning guys. A beginner here. Do you have any idea how can I create a new list including all the elements in the given table and the Sum of each element with all others. The elements of each row shouldnt be summed together
 glossy totem
loop over them and append to the list sorry i cant really help without asking how its formatted
silk minnow
the list contains 7 unique items. B6 to B20. IT also contains 1B6, 2B6...8B6, 1B8, 2B8...8B8 etc etc
Honestly, I don't even know how to do it I am a beginner 🙂
winter barn
Okay I too have another question about the structure of my data.
I want to make a timeseries dataset, like I was talking about earlier. But I kind of want it to be a 3 dimensional dataset?
I want it to follow dates, but for multiple assets, each seperate asset having the same features, similar to how this chart shows it but I dont know if I should just seperate out each timeseries into seperate dataseries for each seperate stock. I think I want to work with darts for this ML modeling. Am I doing anything wrong by setting my dataset up like this?
 glossy totem
winter barn
Okay I too have another question about the structure of my data.
I want to make ...
glossy totem
winter barn
Okay I too have another question about the structure of my data.
I want to make ...
i think separating could be the way to go
winter barn
Im just worried the ML Model will be mistrained if I keep every asset in the same timeseries
winter barn
glossy totem
i think separating could be the way to go
If I do seperate, can I train the ML models on each dataset or is it only capable of training/fitting with a single set?
Like I want it to learn a general trend/relation between the features, but by looking at many timeseries of different assets
I assume it can but like I said I have never done any ML training or used my own datasets before
glossy totem
Well you can train with multiple datasets thats not a problem
glossy totem
the thing is when training with multiple datasets you should be asking why as they may not have anything in common
winter barn
So I can do like, train on dataset for X asset, once it is done, I can do train on dataset Y asset?
glossy totem
so make sure you are training for the in common thing
what are you using to program this
winter barn
Yeah I assume the why here would be that they are all companies, who have uniform datasets - so I want it to learn general trends and correlations between different features affects on eachother, but more generally then for a single company
winter barn
glossy totem
what are you using to program this
I had heard darts is a good option but I am open to look into other options if you know of any better/simpler ones to use
glossy totem
oh yeah thats great
winter barn
ok cool 🙂
glossy totem
not sure if it supports it
winter barn
oh 😮
glossy totem
look into it first and by it i mean multiple dataset training
winter barn
Training Forecasting Models on Multiple Time Series with Darts
I think this is what I need to read about
winter barn
Are these models good models? Models working with multiple time series are:RNNModel, BlockRNNModel, TCNModel, NBEATSModel, TransformerModel and RegressionModel (incl. LinearRegressionModel and RandomForest).
I think I heard Transformers are the most robust/best? but idk 😄
glossy totem
winter barn
I think I heard Transformers are the most robust/best? but idk 😄
your right about transformers
fresh tiger
wooden sail
their SUM is equal to 3
AHHH i see okay yes this is super clear now! I believe I was being a monkey. I focusing on where the line intercepts the 3s for some reason... but yeah when x2 = 3, then x1 is = 0. Thank u so much for ur help 🙂
lapis sequoia
´´´
numPos: 47
numNeg: 200
numStages: 10
precalcValBufSize[Mb] : 1024
precalcIdxBufSize[Mb] : 1024
acceptanceRatioBreakValue : -1
stageType: BOOST
featureType: HAAR
sampleWidth: 24
sampleHeight: 24
boostType: GAB
minHitRate: 0.995
maxFalseAlarmRate: 0.5
weightTrimRate: 0.95
maxDepth: 1
maxWeakCount: 100
mode: BASIC
Number of unique features given windowSize [24,24] : 162336
===== TRAINING 0-stage =====
<BEGIN
POS count : consumed 47 : 47
Train dataset for temp stage can not be filled. Branch training terminated.
Cascade classifier can't be trained. Check the used training parameters.
´´´
Some help me with this? It's a error while trying to train cascade
I have 47 positives and 90 negatives
royal hound
unique flame
Yea was released in July. How long did it take you to train?
30 minutes
maybe less
 arctic needle
Does anyone know if it is possible to train models in python and then use them to create android apps in kotlin?
Or maybe in flutter apps...
 agile cobalt
it's possible (edit; assuming that you mean using it inside of an app, not using it to create an app) - see https://www.tensorflow.org/lite/android/development for example
(or, if it's a large or important model, you can just make an API and use it)
arctic needle
ok thanks, I'll have a look on it
lapis sequoia
ii) to convert a non-linear relation into linear one, or
iii) to decrease the skewness and convert the distribution into a normal distribution.
What does these things mean
 hardy kernel
Is there any time efficient way of achieving this?
I want to remove continuous windows with an absolute value LESS than a pre-determined threshold. Is there a numpy function for this? The data is given as a 1-D numpy array of length >> window size
 lapis sequoia
People with experience in computer vision (open cv, cascade, vision, yolo)
How better yolo is in comparison with open cv? I'm using AI to make a bot for a game
rough anchor
cloud sand
<@675095560990228481> hey mate! got 5 mins? (your dms are disabled)
I accepted your req
 ashen sun
TENSORFLOW >>>>>
lapis sequoia
ashen sun
TENSORFLOW >>>>>
Is that for me?
wooden sail
hardy kernel
Is there any time efficient way of achieving this?
I want to remove continuous w...
by "remove", do you mean to replace them with 0 or to make a new array without those samples?
wooden sail
all right
is the window part a must? you have to realize the behavior is not unique as you specified it
say you have n+10 consecutive samples that are below the threshold and the window is of length 10. then there are 10 ways to remove n of those samples
and you can only remove n, not all n+10
hardy kernel
why 10 ways tho?
I wanted any length to be removed if it's > window, it doesnt have to be multiples of the window size
wooden sail
ah i missed that part, that's my bad
hardy kernel
nah it's fine
wooden sail
and also you probably don't want just the abs, that looks like an audio signal
you probably want the envelope instead
hardy kernel
sorry Im very new to all this haha, I shouldn't use the abs then, ill keep that in mind
wooden sail
you'd want the abs of the analytic representation of the signal is what i mean
but that aside. regardless of whether you use abs or abs(hilbert), you can compare all of the array to the threshold at once by doing index = my_array > my_threshold. this gives you an array of booleans
now we need to go through the array and replace strings of 'False's of length < window with True
wooden sail
there might be a more clever way, but i think this one is the easiest to code, naive though it might be
lemme see if i can whip up a minimum working example
serene scaffold
@craggy swallow I removed your message, as this server is not a place to recruit for paid opportunities. Please keep this in mind.
hardy kernel
I was thinking I can
- traverse through the array and append stuff to a new array if it's > threshold
- push them into a queue like data structure if it's < threshold
- when I encounter the next element > threshold I check if the queue size is > window size,
- if it's more I reject it AND if it's less I append it to the previously mentioned array
- reset queue
you think this approach is correct?
wooden sail
appending is a bad idea if you're using numpy arrays
 craggy swallow
I'm making a proposal writing  bot for freelancer.

I have the data.
All applied text by users for proposal and the selected one.

I want to train the ai model.
So that can ai write high quality proposal.
Any idea how i could do this .
pardon the delay, i got stuck doing dumb stuff. here's my artistic interpretation
import numpy as np
import matplotlib.pyplot as plt

threshold = 5
window = 50
x = np.concatenate((
    10*np.ones(100),
    4*np.ones(51),
    7*np.ones(10),
    3*np.ones(20),
    10*np.ones(30)), axis=0)

counter = 0
indices = (x > threshold)

for ind, val in enumerate(indices[1:]):
    if val:
        if counter < window:
            indices[ind+1-counter:ind] = True
        counter = 0
    else:
        counter += 1

chopped = x[indices]
axis = np.arange(len(x))
plt.plot(axis,x)
plt.plot(axis[indices], chopped, 'o',
            markevery=5, linewidth=2)
plt.legend(('original','thresholded'))

there's probably a more clever way than iterating over the array in python, but off the top of my head it would involve some first and second order finite differences and i'm a little too tired to think that through rn
fresh tiger
Hey! I have a question related to regularization.
I understand why we do it, how to do it etc. But I just feel like I can't completely understand it
My first question is related to the screenshot above with the cost function. So I undestand the point of this is to keep all our w values smaller (ie close to 0). Does this mean that the effect of our features are then also reduced? In that case, wouldnt the value of y then change with extremely small values of w for all of our features?

oh wait
is this balanced out due to the first term of the cost function?
hardy kernel
wooden sail
pardon the delay, i got stuck doing dumb stuff. here's my artistic interpretatio...
oooo thanks for the help 😁
wooden sail
fresh tiger
Hey! I have a question related to regularization.
I understand why we do it, ho...
i don't understand either of your questions tbh. note that if w is 0, you have the classical least squares cost function without regularization
the more regularization you add, the more biased your estimate of y becomes, so that's why you want to keep w small
on the other hand, there are two ws in that equation and i don't know if they're meant to be the same w or not. not the best notation here
fresh tiger
So if we have the model in the screenshot, and apply gradient descent on a set of values using the cost function in the previous screenshot, the values of w will be made smaller right? But how does this cause an overfitted model to become less overfitted. <= this is kinda waht im not getting.
After reading what u wrote, I think im starting to undestand

so we DO want more bias to occur with regularization
wooden sail
the values of which w lol
fresh tiger
sorry haha
wooden sail
is it the same w?
fresh tiger
w_i where i > 0
wooden sail
in the image you shared first, f depends on w and b. there is also a w in the sum to the right, indexed by j. are the w_j the elements of the vector w or are these two not related?
fresh tiger
Ahh yes, they are I believe
lapis sequoia
very basic statistics question regarding anscombe's quartet. i feel stupid for asking but please be patient :))
wooden sail
ok. then this is like tikhonov regularization
it yields a smoother estimate of the parameters. makes the parameters "similar" to each other, slowly-varying
lapis sequoia
i dont understand any of this. im taking intro to data science class and im confused what the purpose of taking a "linear regression" of something or in this case the "first pair"
 fresh tiger
wooden sail
it yields a smoother estimate of the parameters. makes the parameters "similar" ...
fresh tiger
wooden sail
it yields a smoother estimate of the parameters. makes the parameters "similar" ...
but wouldnt this like completely change the model?
or the graph output by the model*
hardy kernel
wooden sail
pardon the delay, i got stuck doing dumb stuff. here's my artistic interpretatio...
I implemented this, what do you think?
#same array definition as yours
buffer_list = []
output_list = []

for element in myarray:
  if (element > threshold):
    if (len(buffer_list) < window):
      output_list.extend(buffer_list)
    buffer_list.clear()
    output_list.append(element)
  else:
    buffer_list.append(element)

output_array  = np.array(output_list)
the idea in linear regression is that you have observations of input variables and output variables, and you have good reason to believe that they are linearly related to each other. you don't know the parameters through which they are related though. you find those parameters via linear regression. for example, say you know y = mx + b. you also have several examples of x and y, but you don't know m and b. you can find m and b using y and x, and that'S called regression
wooden sail
hardy kernel
I implemented this, what do you think?
```python
#same array definition as you...
if your window is big, appending is going to be super slow. otherwise, looks ok
hardy kernel
I see
wooden sail
fresh tiger
but wouldnt this like completely change the model?
no. this is the cost function. you're not changing the model. you're adding additional info on how to find the parameters of the model, which might be otherwise impossible or very difficult
and the amount of regularization needs to be as small as possible, or the cost function will be too strongly biased toward the regularizing term and ignore the fitting term
you can think of it as having a "data fidelity term" which lets you fit the parameters you want, and a "regularizing term" that allows you to steer the solution in a particular direction when it otherwise wouldn't exist, there would be infinitely many sols, or the sold is hard to find
but this does nothing to the model. it changes the cost function only
lapis sequoia
wooden sail
the idea in linear regression is that you have observations of input variables a...
building off of that, when the exercise is asking to "fit a regression model between x and y" is it simply asking me for lm()??
 wooden sail
lapis sequoia
building off of that, when the exercise is asking to "fit a regression model bet...
wooden sail
lapis sequoia
building off of that, when the exercise is asking to "fit a regression model bet...
i have no idea what lm() is, this doesn't look like python and i don't recognize what it is
so i can't say
lapis sequoia
oh sorry....